
调试内嵌的Flutter module
Debug your add-to-app module
Once you've integrated the Flutter module to your project and used Flutter's platform APIs to run the Flutter engine and/or UI, you can then build and run your Android or iOS app the same way you run normal Android or iOS apps.
Flutter now powers the UI wherever your code includes FlutterActivity or FlutterViewController.
Overview
You might be used to having your suite of favorite Flutter debugging tools available when running flutter run or an equivalent command from an IDE. But you can also use all your Flutter debugging functionalities such as hot reload, performance overlays, DevTools, and setting breakpoints in add-to-app scenarios.
The flutter attach command provides these functionalities. To run this command, you can use the SDK's CLI tools, VS Code or IntelliJ IDEA or Android Studio.
The flutter attach command connects once you run your FlutterEngine. It remains attached until you dispose your FlutterEngine. You can invoke flutter attach before starting your engine. The flutter attach command waits for the next available Dart VM that your engine hosts.
Debug from the Terminal
To attach from the terminal, run flutter attach. To select a specific target device, add -d <deviceId>.
flutter attach
content_copy
The command should print output resembling the following:
Syncing files to device iPhone 15 Pro...
 7,738ms (!)

To hot reload the changes while running, press "r".
To hot restart (and rebuild state). press "R".
An Observatory debugger and profiler on iPhone 15 Pro is available at:
http://127.0.0.1:65525/EXmCgco5zjo=/
For a more detailed help message, press "h".
To detach, press "d"; to quit, press "q".
content_copy
Debug iOS extension in Xcode and VS Code
Build the iOS version of the Flutter app in the Terminal
To generate the needed iOS platform dependencies, run the flutter build command.
flutter build ios --config-only --no-codesign --debug
content_copy
Warning: Building for device with codesigning disabled. You will have to manually codesign before deploying to device.
Building com.example.myApp for device (ios)...
content_copy
Start debugging with VS Code first
If you use VS Code to debug most of your code, start with this section.
Start the Dart debugger in VS Code
-
To open the Flutter app directory, go to File > Open Folder... and choose the
my_appdirectory. -
Open the
lib/main.dartfile. -
If you can build an app for more than one device, you must select the device first.
Go to View > Command Palette...
You can also press Ctrl / Cmd + Shift + P.
-
Type
flutter select. -
Click the Flutter: Select Device command.
-
Choose your target device.
-
Click the debug icon (
![VS Code's bug icon to trigger the debugging mode of a Flutter app]() ). This opens the Debug pane and launches the app. Wait for the app to launch on the device and for the debug pane to indicate Connected. The debugger takes longer to launch the first time. Subsequent launches start faster.
). This opens the Debug pane and launches the app. Wait for the app to launch on the device and for the debug pane to indicate Connected. The debugger takes longer to launch the first time. Subsequent launches start faster.This Flutter app contains two buttons:
- Launch in browser: This button opens this page in the default browser of your device.
- Launch in app: This button opens this page within your app. This button only works for iOS or Android. Desktop apps launch a browser.
Enable automatic attachment
You can configure VS Code to attach to your Flutter module project whenever you start debugging. To enable this feature, create a .vscode/launch.json file in your Flutter module project.
-
Go to View > Run.
You can also press Ctrl / Cmd + Shift + D.
VS Code displays the Run and Debug sidebar.
-
In this sidebar, click create a launch.json file.
VS Code displays the Select debugger menu at the top.
-
Select Dart & Flutter.
VS Code creates then opens the
.vscode/launch.jsonfile.Expand to see an example launch.json file
-
To attach, go to Run > Start Debugging.
You can also press F5.
Attach to the Flutter process in Xcode
To attach to the Flutter app in Xcode:
- Go to Debug > Attach to Process >
- Select Runner. It should be at the top of the Attach to Process menu under the Likely Targets heading.
Debug Android extension in Android Studio
-
To open the Flutter app directory, go to File > Open... and choose the
my_appdirectory. -
Open the
lib/main.dartfile. -
Choose a virtual Android device. Go to the toolbar, open the leftmost dropdown menu, and click on Open Android Emulator:
. You can choose any installed emulator that's doesn't include
arm64. -
From that same menu, select the virtual Android device.
-
From the toolbar, click Run 'main.dart'.
You can also press Ctrl + Shift + R.
After the app displays in the emulator, continue to the next step.
Debug without USB connection
To debug your app over Wi-Fi on an iOS or Android device, use flutter attach.
Debug over Wi-Fi on iOS devices
For an iOS target, complete the follow steps:
-
Verify your device connects to Xcode over Wi-Fi as described in the iOS setup guide.
-
On your macOS development machine, open Xcode > Product > Scheme > Edit Scheme....
You can also press Cmd + <.
-
Click Run.
-
Click Arguments.
-
In Arguments Passed On Launch, Click +.
- If your dev machine uses IPv4, add
--vm-service-host=0.0.0.0. - If your dev machine uses IPv6, add
--vm-service-host=::0.
- If your dev machine uses IPv4, add
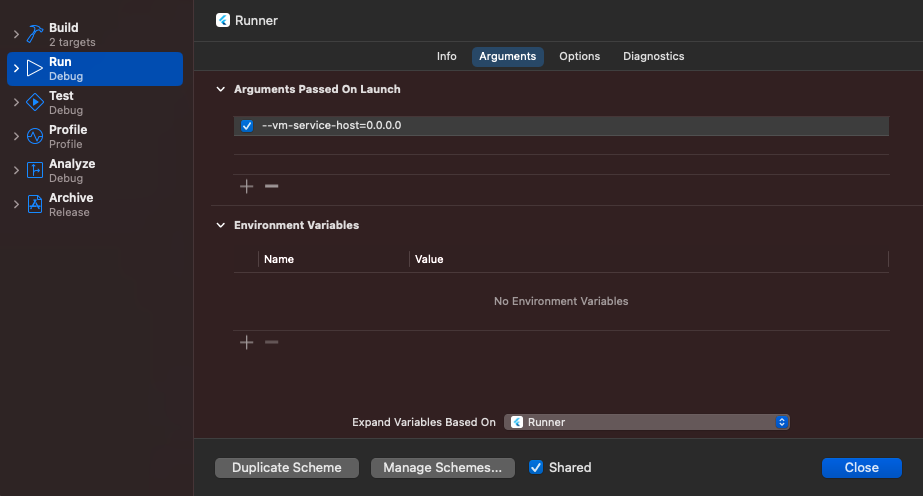 Arguments Passed On Launch with an IPv4 network added
To determine if you're on an IPv6 network
-
Open Settings > Wi-Fi.
-
Click on your connected network.
-
Click Details...
-
Click TCP/IP.
-
Check for an IPv6 address section.
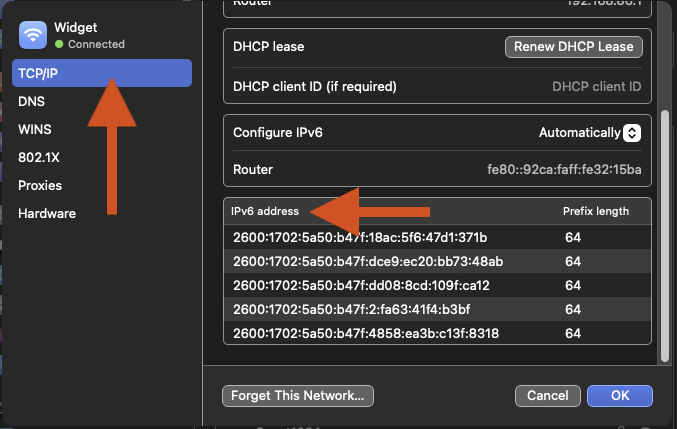 WiFi dialog box for macOS System Settings

 浙公网安备 33010602011771号