
1.安装echarts
首先安装vue-cli脚手架工具,我之前博客有写安装方法,此处省略。然后安装echarts:
1)在命令行输入 npm install echarts -S
2)在main.js中引入,代码如下:
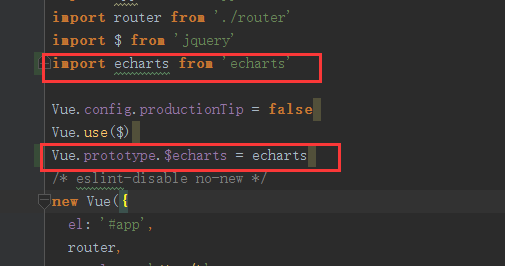
红色框住的就是引入的代码。
2.使用方法
1)新建一个second.vue页面写入以下代码:
<template>
  <div class="">
    <h1>{{ msg }}</h1>
    <div class="pic-nature">
      <div id="myChart" :style="{width: '300px', height: '300px'}"></div>
    </div>
  </div>
</template>

<script>
  export default {
    name: 'second',
    data () {
      return {
        msg: 'myChart'
      }
    },
    mounted () {
      this.drawBar()
    },
    methods: {
      drawBar () {
        let myChart = this.$echarts.init(document.getElementById('myChart'))
        // 绘制图表
        myChart.setOption({
          title: { text: '柱状图' },
          tooltip: {},
          xAxis: {
            data: ['笔记本', '钢笔', '圆珠笔', '橡皮擦', '文具盒']
          },
          yAxis: {},
          series: [{
            name: '数量',
            type: 'bar',
            data: [5, 10, 11, 23, 22]
          }]
        })
      }
    }
  }
</script>

<style scoped>
  .pic-nature {
    text-align: center;
    display: inline-block;
  }
</style>
在主页面写入如下代码:

表示一个按钮,点击该按钮就可以跳入新建的界面。
新建一个路由,在 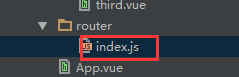 中写入如下路由代码:
2)如果不想新建一个页面来使用echarts,自己只是想试试echarts的话可以在app.vue中写入刚刚‘1)’的代码,然后运行即可。
3.运行结果如下:


 浙公网安备 33010602011771号