Plot the function 使用numpy matplotlib 绘制函数
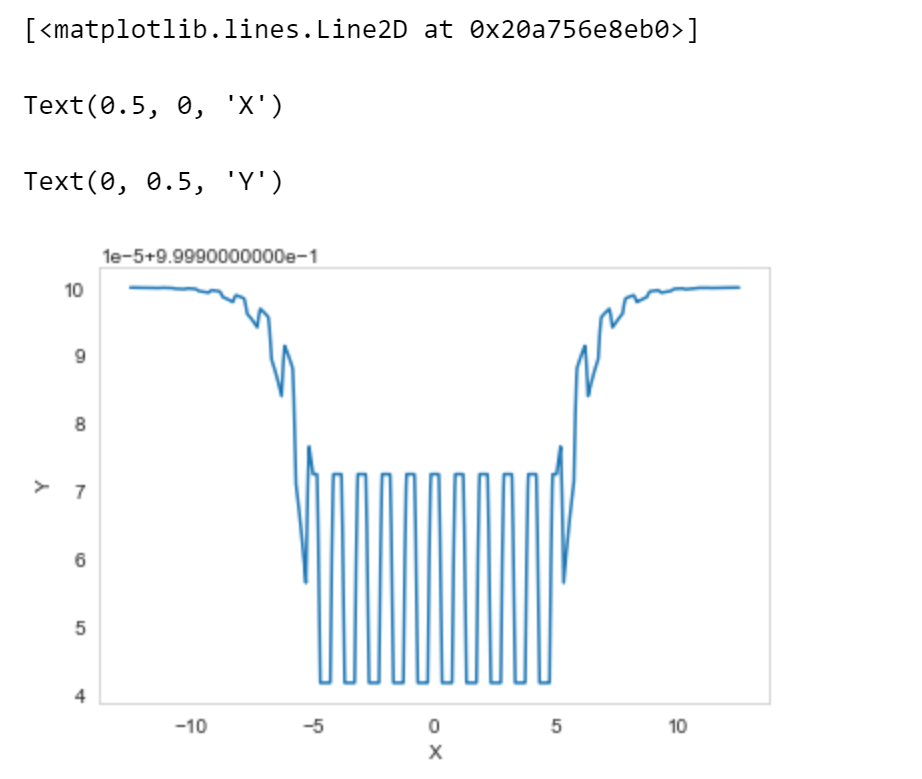
Plot the following fancy function:
\begin{equation}
f(x) = \sigma\bigl(
\max{x + 5, 0} + \max{5 - x, 0}
+ \max{\min{\cos(2 x \pi), \tfrac12}, -\tfrac14}
\bigr)
,,
\end{equation}
where \(\sigma(x) = (1+e^{-x})^{-1}\) is the sigmoid function.
Plot your function for the x-values ranging from \(-12.5\) to \(12.5\)
需要注意:
- np.max只能是整数,要使用np.maximum。
- 输入x是一个数组
最开始需要引入包
import pandas as pd
import numpy as np
import matplotlib.pyplot as plt
函数如下
def fancy_function(x):
    """Compute some fancy function.

    Parameters
    ----------
    X : array, 1 dimendional, shape=(n_samples,)
        The array argument values.

    Returns
    -------
    y : array, 1 dimendional, shape=(n_samples,)
        The values of the fancy function.
    """
    ### BEGIN Solution
    # x = np.arange(-12.5,12.5,0.01)
    a = np.array(x)
    np.clip(a,-12.5,12.5,out=a)
    sigma_x = np.maximum(a+5,0)+np.maximum(5-a,0)+np.maximum(np.minimum(np.cos(2*a*np.pi),0.5),-0.25)
    out = (1 + np.exp(-sigma_x))**(-1)
    # print(out)
    ### END Solution

    return out
绘图
print("EXPECTED OUTPUT FORMAT\n")
### BEGIN Solution
import matplotlib.pyplot as plt
import seaborn as sns
sns.set_style('whitegrid')
%matplotlib inline
x = np.arange(-12.5,12.5,0.01)
# Simple plot
x = x
y = fancy_function(x)
plt.plot(x, y,)
plt.xlabel('X')
plt.ylabel('Y')
plt.grid(None)
### END Solution
plt.show()
结果如下
对于np.maximum的用法,数组与一个数比较。(向量与标量进行比较的感觉),看到公式就对数组和数比较很奇怪,下面是解释
np.maximum([-2.5, -1.5, 0, 1.5, 2.5], 0)
array([0, 0, 0, 1.5, 2.5])

        # np.maximum 接受的两个参数
        # 或者更为准确地说,第二个参数只是一个单独的值时,其实是用到了维度的 broadcast 机制;
参考
maximum
No pains, No gains

 浙公网安备 33010602011771号