Linux实战(20):非docker部署ELK
部署环境:
Elasticsearch:7.5.2
Kibana:7.5.2
Logstash:7.5.2
filebeat:7.5.2
redis:最新版
部署方式:rpm+二进制包
使用架构
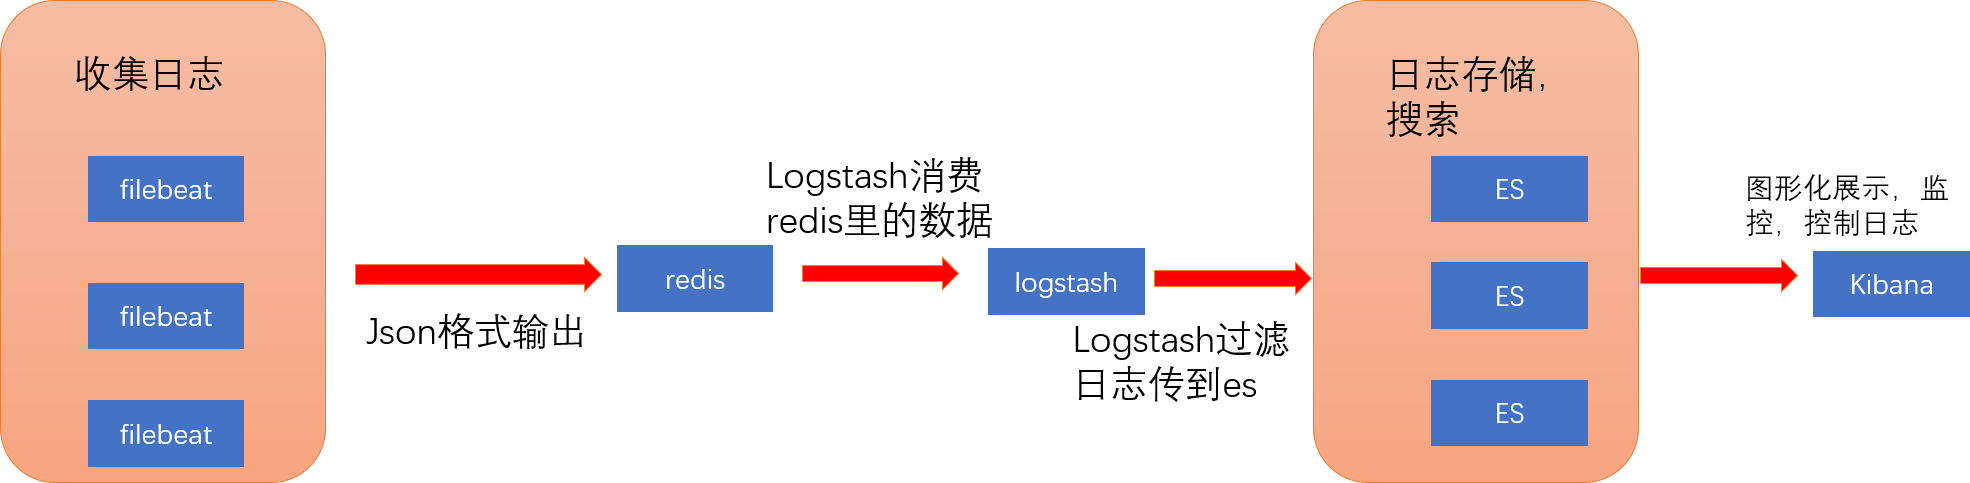
软件包
logstash-7.5.2.rpm
elasticsearch-7.5.2-x86_64.rpm
filebeat-7.5.2-linux-x86_64.tar.gz
安装
Elasticsearch集群安装
主节点:10.228.83.120 从节点:10.228.83.112、10.228.83.111、10.228.83.66
- 通过rpm包安装
rpm --install elasticsearch-7.5.2-x86_64.rpm
- 主节点配置
# ======================== Elasticsearch Configuration =========================
#
# NOTE: Elasticsearch comes with reasonable defaults for most settings.
#       Before you set out to tweak and tune the configuration, make sure you
#       understand what are you trying to accomplish and the consequences.
#
# The primary way of configuring a node is via this file. This template lists
# the most important settings you may want to configure for a production cluster.
#
# Please consult the documentation for further information on configuration options:
# https://www.elastic.co/guide/en/elasticsearch/reference/index.html
#
# ---------------------------------- Cluster -----------------------------------
#
# Use a descriptive name for your cluster:
#
cluster.name: my-application  #集群名
#
# ------------------------------------ Node ------------------------------------
#
# Use a descriptive name for the node:
#
node.name: node-2  #节点名,唯一
#
# Add custom attributes to the node:
#
#node.attr.rack: r1
#
# ----------------------------------- Paths ------------------------------------
#
# Path to directory where to store the data (separate multiple locations by comma):
#
path.data: /var/lib/elasticsearch
#
# Path to log files:
#
path.logs: /var/log/elasticsearch
#
# ----------------------------------- Memory -----------------------------------
#
# Lock the memory on startup:
#
#bootstrap.memory_lock: true
#
# Make sure that the heap size is set to about half the memory available
# on the system and that the owner of the process is allowed to use this
# limit.
#
# Elasticsearch performs poorly when the system is swapping the memory.
#
# ---------------------------------- Network -----------------------------------
#
# Set the bind address to a specific IP (IPv4 or IPv6):
#
network.host: 0.0.0.0  #可访问的地址,这里配置所有都可访问
#
# Set a custom port for HTTP:
#
http.port: 9200
transport.tcp.port: 9300
node.master: true
node.data: true
cluster.initial_master_nodes: ["node-2","node-1"]		#以上4行配置都是集群的配置非集群可不配,配置具体含义建议去查一下,大致意思就是配置端口,配置是否可成为master,配置node是否存data。
#
# For more information, consult the network module documentation.
#
# --------------------------------- Discovery ----------------------------------
#
# Pass an initial list of hosts to perform discovery when this node is started:
# The default list of hosts is ["127.0.0.1", "[::1]"]
#
discovery.seed_hosts: ["10.228.83.120:9300", "10.228.83.66:9300","10.228.83.112:9300"]   #集群话配置非集群可不配
#
# Bootstrap the cluster using an initial set of master-eligible nodes:
#
#cluster.initial_master_nodes: ["node-1", "node-2","node-3"]
#
# For more information, consult the discovery and cluster formation module documentation.
#
# ---------------------------------- Gateway -----------------------------------
#
# Block initial recovery after a full cluster restart until N nodes are started:
#
#gateway.recover_after_nodes: 3
#
# For more information, consult the gateway module documentation.
#
# ---------------------------------- Various -----------------------------------
#
# Require explicit names when deleting indices:
#
#action.destructive_requires_name: true
#http.cors.enabled: true
#http.cors.allow-origin: "*"
#index.number_of_shards: 3   #设置es索引分片数量,分布式存储,提高查询效率等
#index.number_of_replicas: 1 #设置分片副本数量,提供数据高可用
#discovery.zen.ping.unicast.hosts: ["10.228.83.120","10.228.83.111","10.228.83.112","10.228.83.66" ]
#action.auto_create_index: true
xpack.monitoring.enabled: true
xpack.monitoring.elasticsearch.collection.enabled: true
xpack.monitoring.collection.indices: my-application #以上三行是开启kibana监控功能,此行为监控集群名为:my-application
- 从节点配置
从节点的配置跟主节点配置基本一致,就是监控只需在主节点配置就可显示了,
node.name也需不同。
# ======================== Elasticsearch Configuration =========================
#
# NOTE: Elasticsearch comes with reasonable defaults for most settings.
#       Before you set out to tweak and tune the configuration, make sure you
#       understand what are you trying to accomplish and the consequences.
#
# The primary way of configuring a node is via this file. This template lists
# the most important settings you may want to configure for a production cluster.
#
# Please consult the documentation for further information on configuration options:
# https://www.elastic.co/guide/en/elasticsearch/reference/index.html
#
# ---------------------------------- Cluster -----------------------------------
#
# Use a descriptive name for your cluster:
#
cluster.name: my-application
#
# ------------------------------------ Node ------------------------------------
#
# Use a descriptive name for the node:
#
node.name: node-3
#
# Add custom attributes to the node:
#
#node.attr.rack: r1
#
# ----------------------------------- Paths ------------------------------------
#
# Path to directory where to store the data (separate multiple locations by comma):
#
path.data: /var/lib/elasticsearch
#
# Path to log files:
#
path.logs: /var/log/elasticsearch
#
# ----------------------------------- Memory -----------------------------------
#
# Lock the memory on startup:
#
#bootstrap.memory_lock: true
#
# Make sure that the heap size is set to about half the memory available
# on the system and that the owner of the process is allowed to use this
# limit.
#
# Elasticsearch performs poorly when the system is swapping the memory.
#
# ---------------------------------- Network -----------------------------------
#
# Set the bind address to a specific IP (IPv4 or IPv6):
#
network.host: 0.0.0.0
#
# Set a custom port for HTTP:
#
http.port: 9200
transport.tcp.port: 9300
node.master: false
cluster.initial_master_nodes: ["node-2","node-1"]
node.data: true

#
# For more information, consult the network module documentation.
#
# --------------------------------- Discovery ----------------------------------
#
# Pass an initial list of hosts to perform discovery when this node is started:
# The default list of hosts is ["127.0.0.1", "[::1]"]
#
discovery.seed_hosts: ["10.228.83.120:9300", "10.228.83.66:9300","10.228.83.112:9300","10.228.83.111:9300"]
#
# Bootstrap the cluster using an initial set of master-eligible nodes:
#
#cluster.initial_master_nodes: ["node-1", "node-2","node-3"]
#
# For more information, consult the discovery and cluster formation module documentation.
#
# ---------------------------------- Gateway -----------------------------------
#
# Block initial recovery after a full cluster restart until N nodes are started:
#
#gateway.recover_after_nodes: 3
#
# For more information, consult the gateway module documentation.
#
# ---------------------------------- Various -----------------------------------
#
# Require explicit names when deleting indices:
#
#action.destructive_requires_name: true
#http.cors.enabled: true
#http.cors.allow-origin: "*"
- 启动,排错
#启动
systemctl start elasticsearch
#排错
#在无法启动的状态下查看elasticsearch.log日志是否有报错
tail -f /var/log/elasticsearch/elasticsearch.log
#上面看不出什么的情况下可看一下,你集群名为开头的日志
tail -100f /var/log/elasticsearch/my-application.log
- 处理报错
如果无法启动,查看日志报错
ERROR: bootstrap checks failed max virtual memory areas vm.max_map_count [65530] is too low, increase to at least [262144],需修改sysctl.conf。
参考连接
sudo vim /etc/sysctl.conf
#末尾添加这一行
vm.max_map_count=262144
#加载配置
sudo sysctl -p
- 访问测试
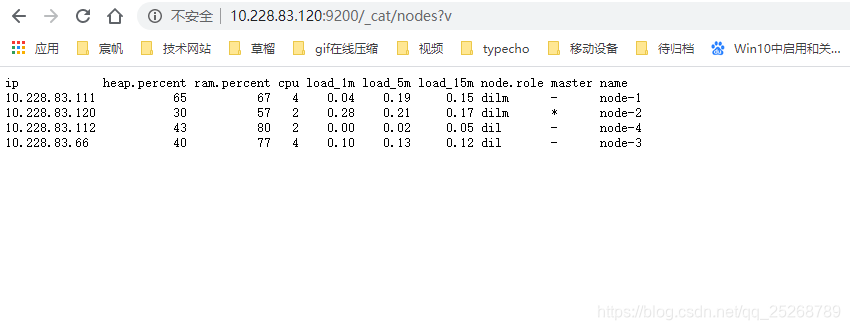
elasticsearch已经启动的状态下,我们通过网页访问一下是否可通,如下图,集群状态
http://10.228.83.120:9200/_cat/nodes?v
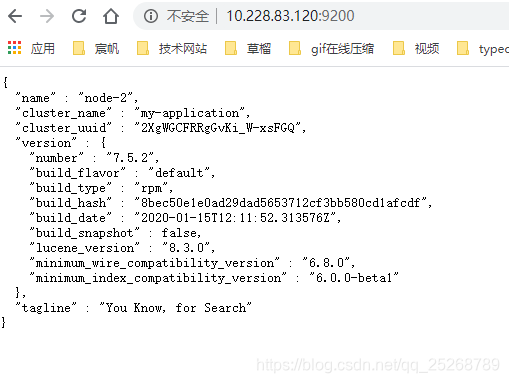
注意:如果没有接入集群得先看一下配置是否正确,在配置正确的情况下,服务起来的情况下,访问一下 ip+端口,查看cluster_uuid是否为_na_,如果是那就是启动不对。
我遇到此问题的解决方案是:先停止此服务,然后删除原有的数据文件,重新启动一边即可解决。
redis 安装
我这也是采用的rpm包安装。
yum -y update
yum list redis
yum -y install redis
systemctl start redis
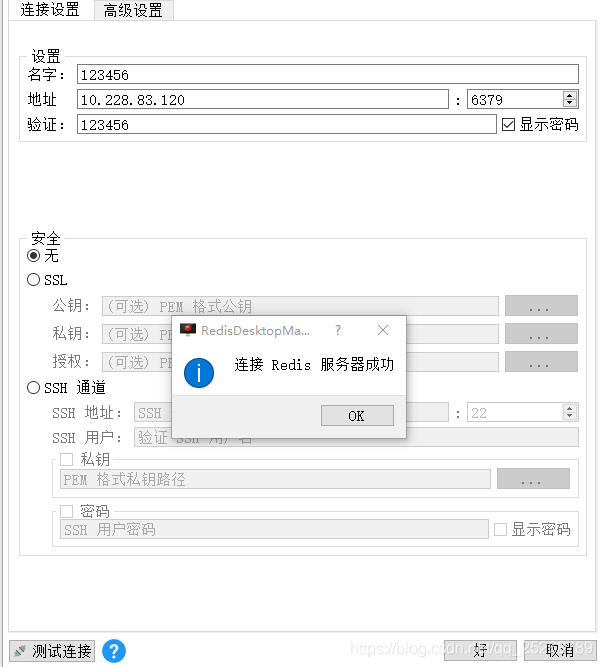
vim /etc/redis.conf
#requirepass foobared去掉注释,foobared改为自己的密码,我在这里改为
requirepass 123456
#保存退出,重启
systemctl restart redis
下载一个redis客户端,连接一下是否可通。下载连接如下图:
Kibana安装
个人感觉Kibana没什么东西,为了省事就直接用docker部署了,当然你也可以选择二进制或者yum安装。
# 启动
docker run --name kibana -p 5601:5601   -itd kibana:7.5.2
# 配置
docker exec -it kibana bash
cd config
vim kibana.yml
#如下配置
server.name: kibana
server.host: "0"
elasticsearch.hosts: [ "http://10.228.83.120:9200","http://10.228.83.111:9200","http://10.228.83.111:9200","http://10.228.83.66:9200" ]
xpack.monitoring.ui.container.elasticsearch.enabled: true
xpack.monitoring.enabled: true  #以上两个配置也是可以让kibana监控kibana
#i18n.locale: zh-CN #汉化,不是很好用,我就不用了
kibana.index: ".kibana"
# 保存退出
exit
docker restart kibana
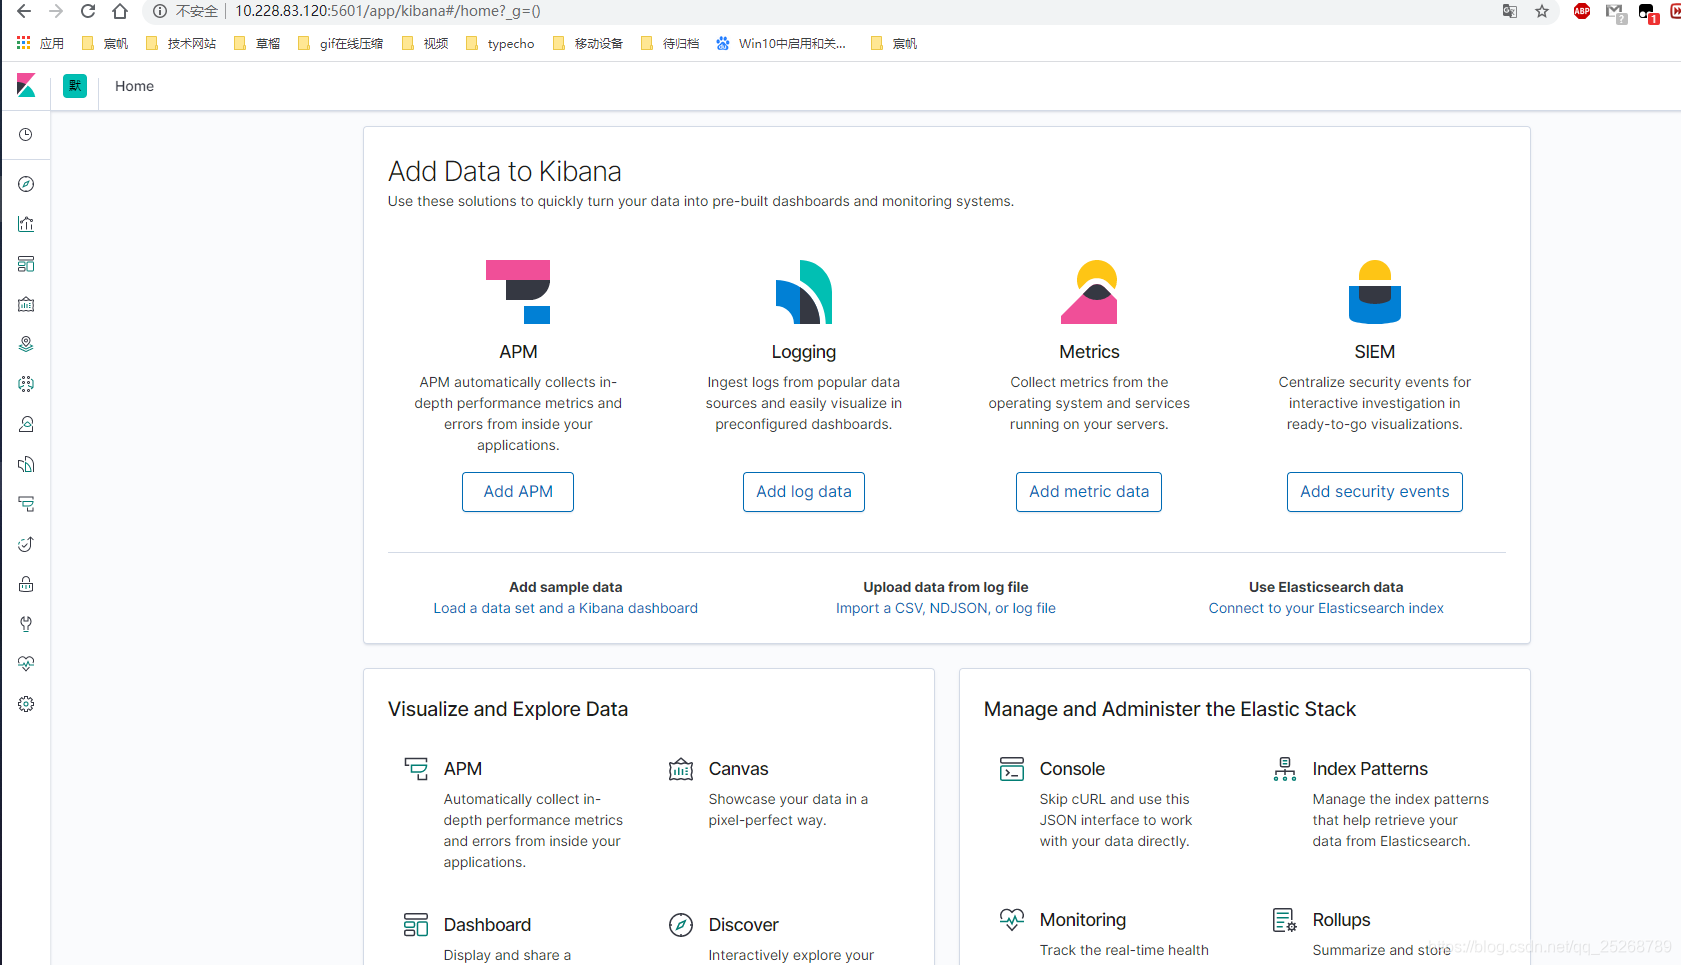
通过网页访问,效果如下图:
Filebeat安装
filebeat使用的是二进制包后台运行的,rpm安装也行,不过我在启动的时候显示已经启动了但无log日志输出,而且日志数据传输也有点问题,最后就使用了二进制包安装了。
- 安装
#解压
tar -xzvf filebeat-7.5.2-linux-x86_64.tar.gz
#进入解压目录
cd filebeat-7.5.2-linux-x86_64
- 配置
vim filebeat.yml
###################### Filebeat Configuration Example #########################

# This file is an example configuration file highlighting only the most common
# options. The filebeat.reference.yml file from the same directory contains all the
# supported options with more comments. You can use it as a reference.
#
# You can find the full configuration reference here:
# https://www.elastic.co/guide/en/beats/filebeat/index.html

# For more available modules and options, please see the filebeat.reference.yml sample
# configuration file.

#=========================== Filebeat inputs =============================

filebeat.inputs:

# Each - is an input. Most options can be set at the input level, so
# you can use different inputs for various configurations.
# Below are the input specific configurations.
#已下配置log的路径,tags可以在logstash做过滤的时候用到,multiline.pattern对Java日志做一个格式化。
- type: log
  enabled: true
  paths:
    - /var/base/out.log
  tags: ["base","pro"]
  multiline.pattern: '^\s*(\d{4}|\d{2})\-(\d{2}|[a-zA-Z]{3})\-(\d{2}|\d{4})'
  multiline.negate: true
  multiline.match: after
  fields:
        type: plm
  fields_under_root: true
- type: log
  enabled: true
  paths:
    - /var/api/out.log
  tags: ["api","pro"]
  multiline.pattern: '^\s*(\d{4}|\d{2})\-(\d{2}|[a-zA-Z]{3})\-(\d{2}|\d{4})'
  multiline.negate: true
  multiline.match: after
  fields:
        type: plm
  fields_under_root: true
#- type: log

  # Change to true to enable this input configuration.
  # Paths that should be crawled and fetched. Glob based paths.
#  paths:
#     - /var/log/audit/audit.log
#  tags: ["auth","test"]
#  fields:
#       type: system
#  fields_under_root: true
    #- c:\programdata\elasticsearch\logs\*

  # Exclude lines. A list of regular expressions to match. It drops the lines that are
  # matching any regular expression from the list.
  #exclude_lines: ['^DBG']

  # Include lines. A list of regular expressions to match. It exports the lines that are
  # matching any regular expression from the list.
  #include_lines: ['^ERR', '^WARN']

  # Exclude files. A list of regular expressions to match. Filebeat drops the files that
  # are matching any regular expression from the list. By default, no files are dropped.
  #exclude_files: ['.gz$']

  # Optional additional fields. These fields can be freely picked
  # to add additional information to the crawled log files for filtering
  #fields:
  #  level: debug
  #  review: 1

  ### Multiline options

  # Multiline can be used for log messages spanning multiple lines. This is common
  # for Java Stack Traces or C-Line Continuation

  # The regexp Pattern that has to be matched. The example pattern matches all lines starting with [
  #multiline.pattern: ^\[

  # Defines if the pattern set under pattern should be negated or not. Default is false.
  #multiline.negate: false

  # Match can be set to "after" or "before". It is used to define if lines should be append to a pattern
  # that was (not) matched before or after or as long as a pattern is not matched based on negate.
  # Note: After is the equivalent to previous and before is the equivalent to to next in Logstash
  #multiline.match: after


#============================= Filebeat modules ===============================

filebeat.config.modules:
  # Glob pattern for configuration loading
  path: ${path.config}/modules.d/*.yml

  # Set to true to enable config reloading
  reload.enabled: false

  # Period on which files under path should be checked for changes
  #reload.period: 10s

#==================== Elasticsearch template setting ==========================

setup.template.settings:
  index.number_of_shards: 1
  #index.codec: best_compression
  #_source.enabled: false

#================================ General =====================================

# The name of the shipper that publishes the network data. It can be used to group
# all the transactions sent by a single shipper in the web interface.
#name:

# The tags of the shipper are included in their own field with each
# transaction published.
#tags: ["service-X", "web-tier"]

# Optional fields that you can specify to add additional information to the
# output.
#fields:
#  env: staging


#============================== Dashboards =====================================
# These settings control loading the sample dashboards to the Kibana index. Loading
# the dashboards is disabled by default and can be enabled either by setting the
# options here or by using the `setup` command.
#setup.dashboards.enabled: false

# The URL from where to download the dashboards archive. By default this URL
# has a value which is computed based on the Beat name and version. For released
# versions, this URL points to the dashboard archive on the artifacts.elastic.co
# website.
#setup.dashboards.url:

#============================== Kibana =====================================

# Starting with Beats version 6.0.0, the dashboards are loaded via the Kibana API.
# This requires a Kibana endpoint configuration.
setup.kibana:

  # Kibana Host
  # Scheme and port can be left out and will be set to the default (http and 5601)
  # In case you specify and additional path, the scheme is required: http://localhost:5601/path
  # IPv6 addresses should always be defined as: https://[2001:db8::1]:5601
  #host: "localhost:5601"

  # Kibana Space ID
  # ID of the Kibana Space into which the dashboards should be loaded. By default,
  # the Default Space will be used.
  #space.id:

#============================= Elastic Cloud ==================================

# These settings simplify using Filebeat with the Elastic Cloud (https://cloud.elastic.co/).

# The cloud.id setting overwrites the `output.elasticsearch.hosts` and
# `setup.kibana.host` options.
# You can find the `cloud.id` in the Elastic Cloud web UI.
#cloud.id:

# The cloud.auth setting overwrites the `output.elasticsearch.username` and
# `output.elasticsearch.password` settings. The format is `<user>:<pass>`.
#cloud.auth:

#================================ Outputs =====================================

# Configure what output to use when sending the data collected by the beat.

#-------------------------- Elasticsearch output ------------------------------
#output.elasticsearch:
  # Array of hosts to connect to.
#  hosts: ["10.228.83.120:9200"]

  # Optional protocol and basic auth credentials.
  #protocol: "https"
  #username: "elastic"
  #password: "changeme"

#----------------------------- Logstash output --------------------------------
#output.logstash:
  # The Logstash hosts
  #hosts: ["localhost:5044"]

  # Optional SSL. By default is off.
  # List of root certificates for HTTPS server verifications
  #ssl.certificate_authorities: ["/etc/pki/root/ca.pem"]

  # Certificate for SSL client authentication
  #ssl.certificate: "/etc/pki/client/cert.pem"

  # Client Certificate Key
  #ssl.key: "/etc/pki/client/cert.key"

#================================ Processors =====================================

# Configure processors to enhance or manipulate events generated by the beat.

processors:
  - add_host_metadata: ~
  - add_cloud_metadata: ~
  - add_docker_metadata: ~
  - add_kubernetes_metadata: ~

#================================ Logging =====================================

# Sets log level. The default log level is info.
# Available log levels are: error, warning, info, debug
#logging.level: debug

# At debug level, you can selectively enable logging only for some components.
# To enable all selectors use ["*"]. Examples of other selectors are "beat",
# "publish", "service".
#logging.selectors: ["*"]

#============================== X-Pack Monitoring ===============================
# filebeat can export internal metrics to a central Elasticsearch monitoring
# cluster.  This requires xpack monitoring to be enabled in Elasticsearch.  The
# reporting is disabled by default.

# Set to true to enable the monitoring reporter.
#monitoring.enabled: false

# Sets the UUID of the Elasticsearch cluster under which monitoring data for this
# Filebeat instance will appear in the Stack Monitoring UI. If output.elasticsearch
# is enabled, the UUID is derived from the Elasticsearch cluster referenced by output.elasticsearch.
#monitoring.cluster_uuid:

# Uncomment to send the metrics to Elasticsearch. Most settings from the
# Elasticsearch output are accepted here as well.
# Note that the settings should point to your Elasticsearch *monitoring* cluster.
# Any setting that is not set is automatically inherited from the Elasticsearch
# output configuration, so if you have the Elasticsearch output configured such
# that it is pointing to your Elasticsearch monitoring cluster, you can simply
# uncomment the following line.
#monitoring.elasticsearch:

#================================= Migration ==================================

# This allows to enable 6.7 migration aliases
#migration.6_to_7.enabled: true
#配置输出地址,此处输入到redis。
output.redis:
        hosts: ["10.228.83.120:6379"]
        password: "123456"
        db: "0"
        key: "logstash"
        timeout: 5
        datatype: list
- 启动
注意:需要进filebeat解压文件夹目录下启动。
#后台启动
nohup ./filebeat &
logstash安装
- 安装
rpm --install logstash-7.5.2.rpm
- 配置
vim /etc/logstash/logstash.yml
#末尾添加一条配置,是可以让kabina监控logstash的
xpack.monitoring.enabled: true
- 设置过滤规则
过滤规则是在
/etc/logstash/conf.d目录下,在此目录下创建配置文件。
vim /etc/logstash/conf.d/demo.conf

input {
    redis {
        host => "10.228.83.120"
        port => 6379
        password => "123456"
        db => "0"
        data_type => "list"
        key => "logstash"
    }
}
# 以上是消费logstash里的数据
filter {
        grok {
            match => ["message","%{TIMESTAMP_ISO8601:local_time}\s*%{WORD:condition}"]   #grok匹配Java 时间与状态值
    	}
	date {
 		locale => "en"
		match => ["local_time","yyyy-MM-dd HH:mm:ss.SSS"]  #将日志时间覆盖默认  时间戳
 		target =>"@timestamp"
	}
	ruby {
    		code => "event.timestamp.time.localtime"

	}
}
output {
    if [type] == "plm" {
        if [tags][0] == "base" {
            elasticsearch {
                hosts => ["http://10.228.83.120:9200","http://10.228.83.111:9200","http://10.228.83.66:9200","http://10.228.83.112:9200"]
                index => "demo-base-%{+YYYY.MM.dd}"
            }
        }
        else if [tags][0] == "config" {
            elasticsearch {
                hosts => ["http://10.228.83.120:9200","http://10.228.83.111:9200","http://10.228.83.66:9200","http://10.228.83.112:9200"]
                index => "demo-%{[tags][0]}-%{+YYYY.MM.dd}"
            }
        }
     }
}
可通过 /usr/share/logstash/bin/logstash -t -f demo.conf 测试配置文件是否有问题
kibana配置
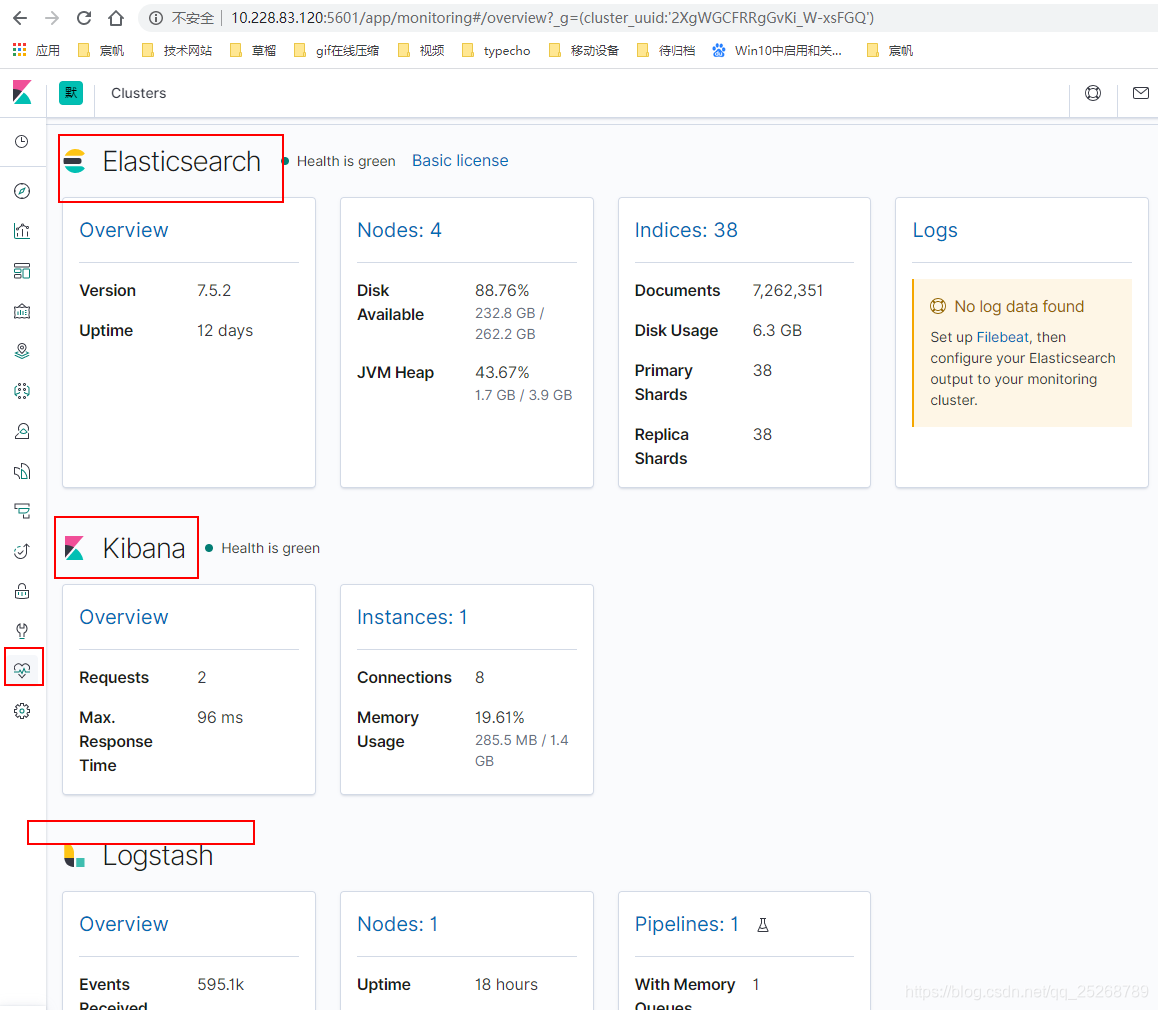
- 查看监控
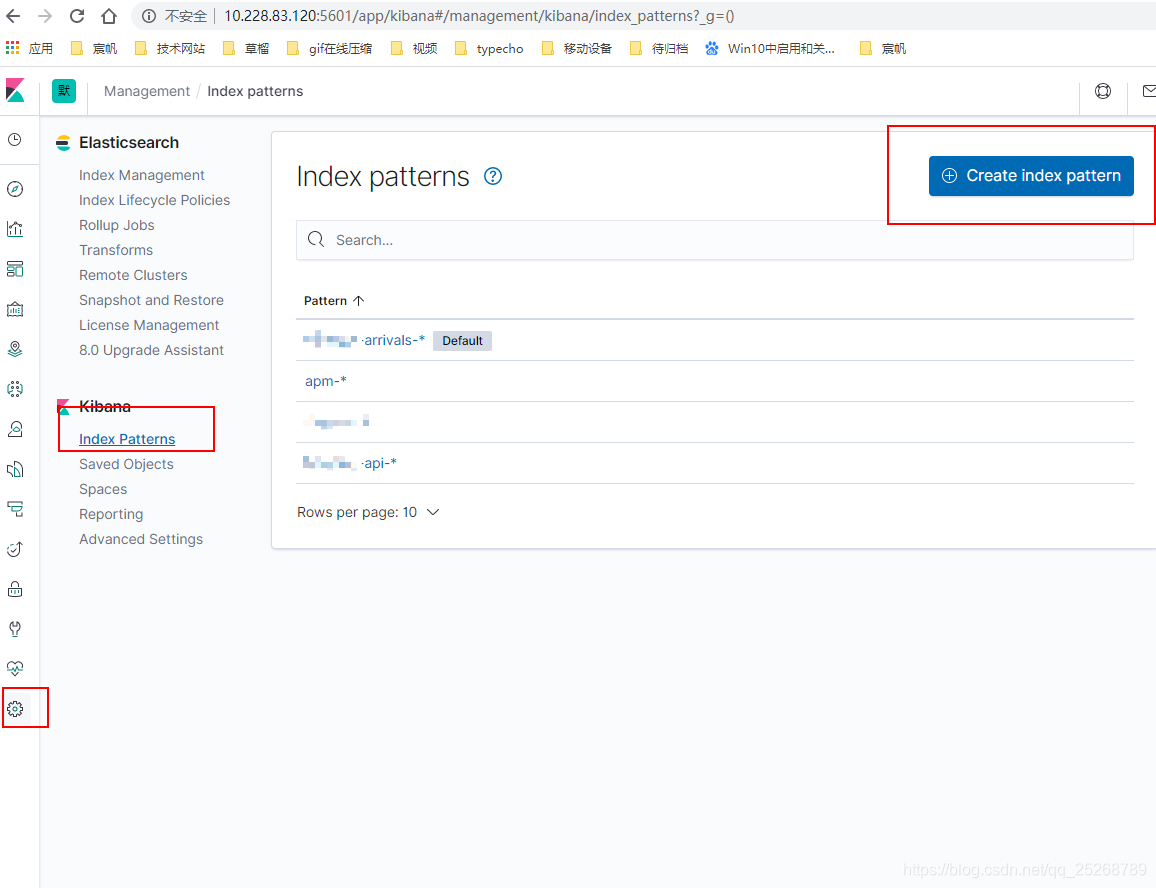
- 配置索引
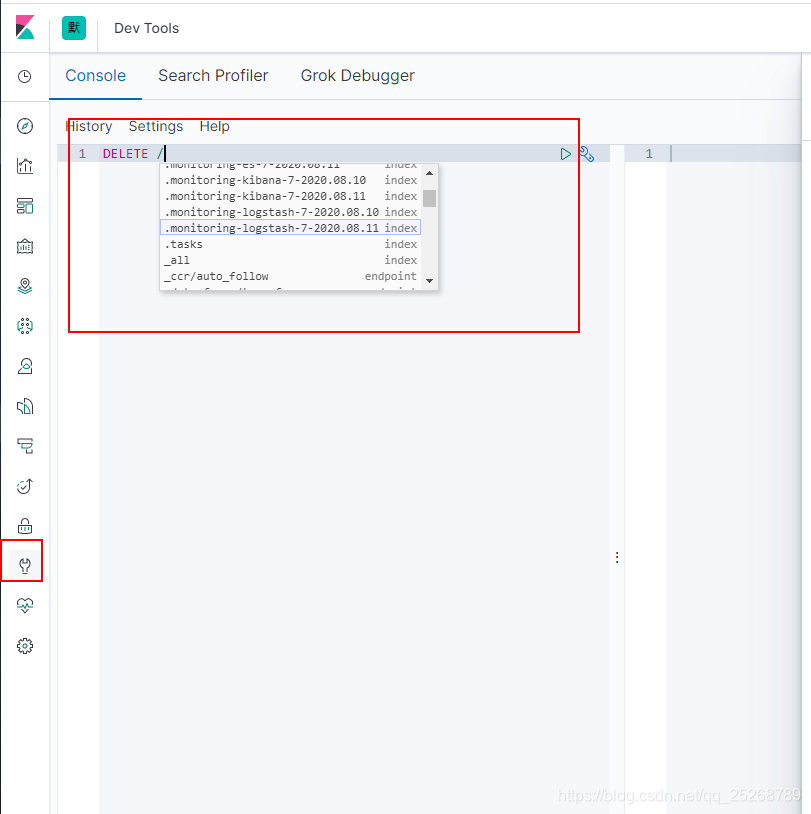
- 支持命令行删除索引,支持通配符
还有很多高阶功能我就不一一述说了,EKL安装基本已经至此结束了,此文档是在我实操后一点点整理记录的,如有哪一步配置,启动失效的欢迎大家指出,我可就此纠正。
注意:
以上使用到的端口一定要记得放开,谨记放开端口,或者操作完后 关闭防火墙尝试一下是否可通。

 浙公网安备 33010602011771号