python爬虫爬取福布斯排行榜并可视化
一、选题的背景
由于我对福布斯排行榜的印象还处于小时候的阶段,所以我用网络爬虫去爬取福布斯排行榜来重新认识一下,并且去分析榜单上的人都来自哪些国家,和一共有多少资金。
二、主题式网络爬虫设计方案
1.主题式网络爬虫名称
爬取福布斯排行榜并可视化
2.主题式网络爬虫爬取的内容与数据特征分析
爬取福布斯排行榜上的名单
3.主题式网络爬虫设计方案概述
先确定此次的选题的主题内容,然后爬取数据,设计爬取程序进行爬取,并以csv的形式储存,接着利用pandas库进行数据分析以及清洗,之后进行进行图形与图像的绘制。最后,保存数据。
三、主题页面的结构特征分析
1.主题页面的结构特征分析
要爬取的网站是https://www.phb123.com/renwu/fuhao/shishi.html,是个html式网站。
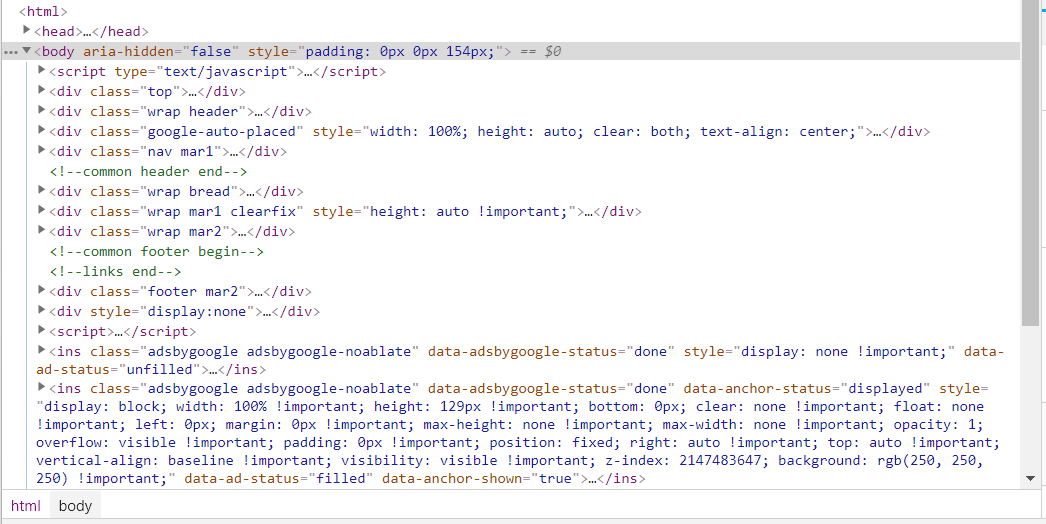
通过进入网页按下f12进行检查,找到所需要的标签名——上图中红色箭头所示。
四、网络爬虫程序设计
1.获取数据
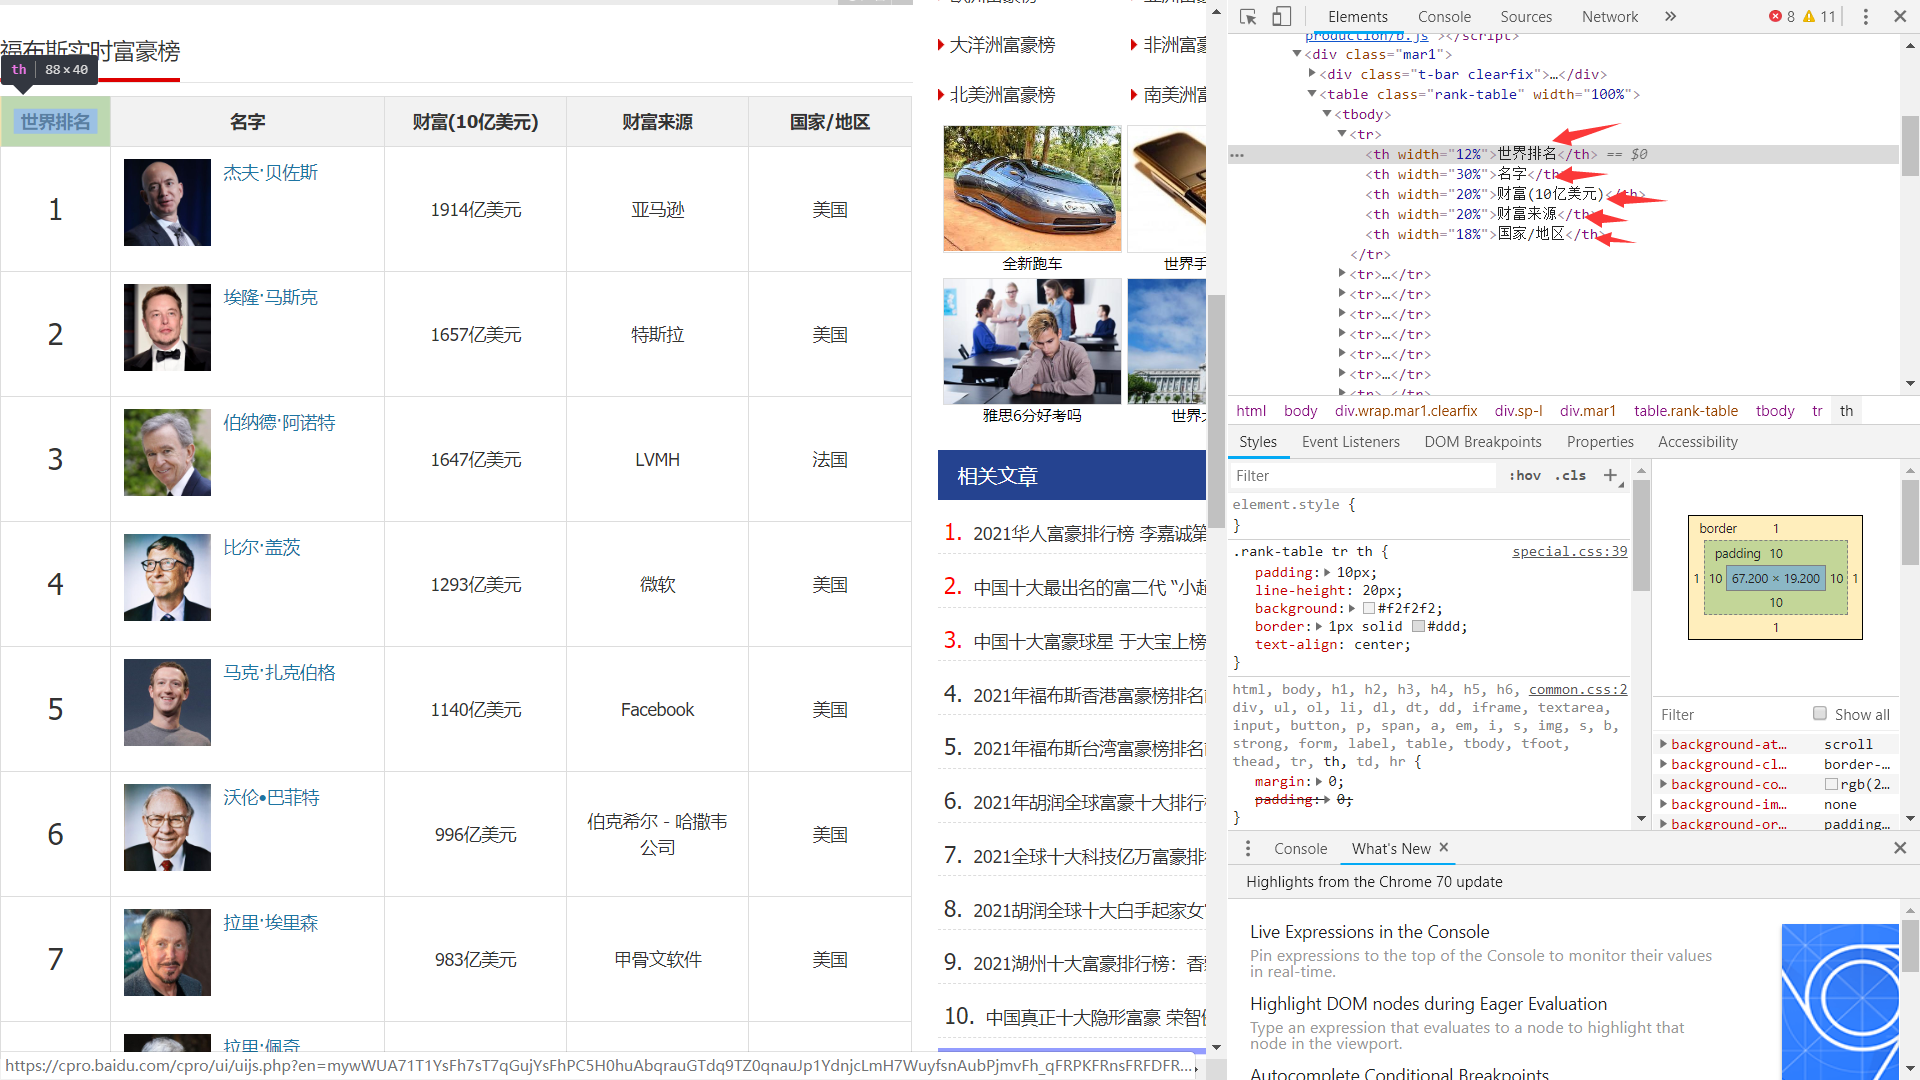
 1 # 读取一页的数据
 2 def loaddata(url):
 3    from bs4 import BeautifulSoup
 4    import requests
 5    headers = {
 6        'User-Agent':'Mozilla/5.0 (Macintosh; Intel Mac OS X 10_14_3) AppleWebKit/537.36 (KHTML, like Gecko) '
 7                     'Chrome/72.0.3626.121 Safari/537.36'
 8    }
 9    f = requests.get(url,headers=headers)   #Get该网页从而获取该html内容
10    soup = BeautifulSoup(f.content, "lxml")  #用lxml解析器解析该网页的内容
11    # print(f.content.decode())        #尝试打印出网页内容,看是否获取成功
12    ranktable = soup.find_all('table',class_="rank-table" )[0]   #获取排行榜表格
13    trlist = ranktable.find_all('tr') #获取表格中所有tr标签
14    trlist.pop(0) #去掉第一个元素
15    persionlist = []
16    for tr in trlist:
17       persion = {}
18       persion['num'] = tr.find_all('td')[0].string  #编号
19       persion['name'] = tr.find_all('td')[1].p.string #名称
20       persion['money'] = tr.find_all('td')[2].string #财产
21       persion['company'] = tr.find_all('td')[3].string #企业
22       persion['country'] = tr.find_all('td')[4].a.string #国家
23       persionlist.append(persion)
24    print("页面"+url+"爬取成功")
25    return persionlist
2.将所爬取到的数据转入excel表格内
 1 ## 读取所有福布斯排行榜数据
 2 def loadalldata():
 3    alldata = []
 4    for i in range(1,16,1):
 5       url = "https://www.phb123.com/renwu/fuhao/shishi_"+str(i)+".html"
 6       data = loaddata(url)
 7       alldata = alldata + data
 8    return alldata
 9
10 ## 将爬取的数据保存到文件
11 def savedata(path,persionlist):
12    import xlwt
13    workbook = xlwt.Workbook()
14    worksheet = workbook.add_sheet('test')
15    worksheet.write(0, 0, '排名')
16    worksheet.write(0, 1, '姓名')
17    worksheet.write(0, 2, '财富')
18    worksheet.write(0, 3, '企业')
19    worksheet.write(0, 4, '国家')
20    for i in range(1,len(persionlist)+1,1):
21       worksheet.write(i, 0, persionlist[i-1]['num'])
22       worksheet.write(i, 1, persionlist[i-1]['name'])
23       worksheet.write(i, 2, persionlist[i-1]['money'])
24       worksheet.write(i, 3, persionlist[i-1]['company'])
25       worksheet.write(i, 4, persionlist[i-1]['country'])
26    workbook.save(path)
27    print("数据保存成功:"+path)
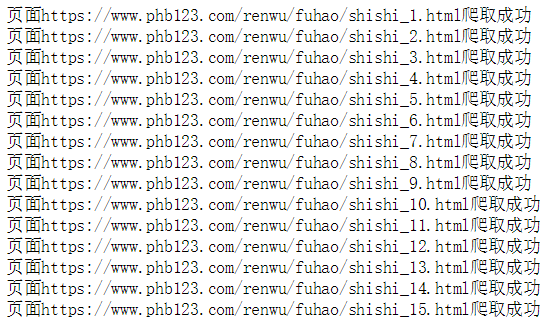
表格内容如下
3.对数据进行处理,取出前十位的数据
 1 ## 取出排行榜前十的姓名和财富数据 以两个list返回
 2 def loadtop10(path):
 3     import xlrd
 4     book = xlrd.open_workbook(path)
 5     sheet1 = book.sheets()[0]
 6     namelist = sheet1.col_values(1)
 7     moneylist = sheet1.col_values(2)
 8     namelist = namelist[1:11]
 9     moneylist = moneylist[1:11]
10
11     moneylist2 = []
12     for a in moneylist:
13         a = int(a[0:-3])
14         moneylist2.append(a)
15     print("取出排行榜前十的姓名和财富数据")
16     print(namelist)
17     print(moneylist2)
18     return namelist,moneylist2
19
20 ## 统计排行榜中每个国家的上榜人数 以字典list返回
21 def countcountrynum(path):
22    import xlrd
23    book = xlrd.open_workbook(path)
24    sheet1 = book.sheets()[0]
25    countrylist = sheet1.col_values(4)[1:-1]
26    print(countrylist)
27    countryset = list(set(countrylist))
28    dictlist = []
29    for country in countryset:
30       obj = {"name":country,"count":0}
31       dictlist.append(obj)
32    ## 统计出每个国家对应的数量
33    for obj in dictlist:
34       for a in countrylist:
35          if obj['name'] == a:
36             obj['count'] = obj['count'] + 1
37    print(dictlist)
38    ## 将dictlist排序 数量多的放前面 8 5 6 9 3 2 4
39    for i in range(0,len(dictlist),1):
40       for j in range(0,len(dictlist)-i-1,1):
41           if dictlist[j]['count'] < dictlist[j+1]['count']:
42              temp = dictlist[j]
43              dictlist[j] = dictlist[j+1]
44              dictlist[j+1] = temp
45    dictlist2 = dictlist[0:5]
46    set2 = []
47    for a in dictlist2:
48       set2.append(a['name'])
49    othercount = 0;
50    for a in dictlist:
51       if a['name'] not in set2:
52          othercount = othercount + 1
53    dictlist2.append({"name":"其他","count":othercount})
54    print('获取排行榜中每个国家的上榜人数')
55    print(dictlist2)
56    return dictlist2
取出后如下图

4.进行数据可视化
 1 ## 绘制条形图和饼状图
 2 def drow():
 3    import matplotlib.pyplot as plt
 4    plt.rcParams['font.sans-serif'] = ['SimHei'] # 设置中文字体
 5    plt.figure('福布斯前十榜',figsize=(15,5))
 6
 7    ## 读取福布斯排行榜前十的数据
 8    listx,listy = loadtop10('rank.xls')
 9
10    plt.title('福布斯前十榜', fontsize=16)
11    plt.xlabel('人物', fontsize=14)
12    plt.ylabel('金额/亿美元', fontsize=14)
13    plt.tick_params(labelsize=10)
14    plt.grid(linestyle=':', axis='y')
15    a = plt.bar(listx, listy, color='dodgerblue', label='Apple', align='center')
16    # 设置标签
17    for i in a:
18       h = i.get_height()
19       plt.text(i.get_x() + i.get_width() / 2, h, '%d' % int(h), ha='center', va='bottom')
20    ## -------------------------------------------------------------------------
21    dictlist = countcountrynum("rank.xls")
22    plt.figure('各国家上榜人数所占比例')
23    labels = []
24    sizes = []
25    for a in dictlist:
26       labels.append(a['name'])
27       sizes.append(a['count'])
28    explode = (0.1, 0, 0, 0, 0, 0)
29    plt.pie(sizes, explode=explode, labels=labels, autopct='%1.1f%%', shadow=False, startangle=150)
30    plt.title("各国家上榜人数所占比例", fontsize=16)
31    plt.axis('equal')  # 该行代码使饼图长宽相等
32
33    plt.show()
34
35 if __name__ == '__main__':
36
37    ## 爬取数据
38    data = loadalldata()
39    ## 保存数据
40    savedata("rank.xls",data)    # py文件同级目录创建rank.xls文件
41    ## 展示数据
42    drow()
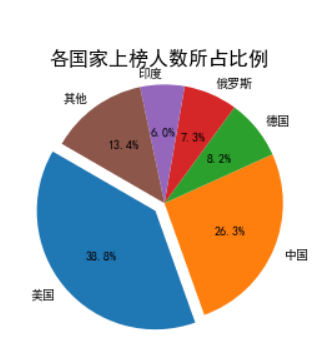
效果如图

5.完整代码
  1 # 读取一页的数据
  2 def loaddata(url):
  3    from bs4 import BeautifulSoup
  4    import requests
  5    headers = {
  6        'User-Agent':'Mozilla/5.0 (Macintosh; Intel Mac OS X 10_14_3) AppleWebKit/537.36 (KHTML, like Gecko) '
  7                     'Chrome/72.0.3626.121 Safari/537.36'
  8    }
  9    f = requests.get(url,headers=headers)   #Get该网页从而获取该html内容
 10    soup = BeautifulSoup(f.content, "lxml")  #用lxml解析器解析该网页的内容
 11    # print(f.content.decode())        #尝试打印出网页内容,看是否获取成功
 12    ranktable = soup.find_all('table',class_="rank-table" )[0]   #获取排行榜表格
 13    trlist = ranktable.find_all('tr') #获取表格中所有tr标签
 14    trlist.pop(0) #去掉第一个元素
 15    persionlist = []
 16    for tr in trlist:
 17       persion = {}
 18       persion['num'] = tr.find_all('td')[0].string  #编号
 19       persion['name'] = tr.find_all('td')[1].p.string #名称
 20       persion['money'] = tr.find_all('td')[2].string #财产
 21       persion['company'] = tr.find_all('td')[3].string #企业
 22       persion['country'] = tr.find_all('td')[4].a.string #国家
 23       persionlist.append(persion)
 24    print("页面"+url+"爬取成功")
 25    return persionlist
 26
 27
 28 ## 读取所有福布斯排行榜数据
 29 def loadalldata():
 30    alldata = []
 31    for i in range(1,16,1):
 32       url = "https://www.phb123.com/renwu/fuhao/shishi_"+str(i)+".html"
 33       data = loaddata(url)
 34       alldata = alldata + data
 35    return alldata
 36
 37 ## 将爬取的数据保存到文件
 38 def savedata(path,persionlist):
 39    import xlwt
 40    workbook = xlwt.Workbook()
 41    worksheet = workbook.add_sheet('test')
 42    worksheet.write(0, 0, '排名')
 43    worksheet.write(0, 1, '姓名')
 44    worksheet.write(0, 2, '财富')
 45    worksheet.write(0, 3, '企业')
 46    worksheet.write(0, 4, '国家')
 47    for i in range(1,len(persionlist)+1,1):
 48       worksheet.write(i, 0, persionlist[i-1]['num'])
 49       worksheet.write(i, 1, persionlist[i-1]['name'])
 50       worksheet.write(i, 2, persionlist[i-1]['money'])
 51       worksheet.write(i, 3, persionlist[i-1]['company'])
 52       worksheet.write(i, 4, persionlist[i-1]['country'])
 53    workbook.save(path)
 54    print("数据保存成功:"+path)
 55
 56 ## 取出排行榜前十的姓名和财富数据 以两个list返回
 57 def loadtop10(path):
 58     import xlrd
 59     book = xlrd.open_workbook(path)
 60     sheet1 = book.sheets()[0]
 61     namelist = sheet1.col_values(1)
 62     moneylist = sheet1.col_values(2)
 63     namelist = namelist[1:11]
 64     moneylist = moneylist[1:11]
 65
 66     moneylist2 = []
 67     for a in moneylist:
 68         a = int(a[0:-3])
 69         moneylist2.append(a)
 70     print("取出排行榜前十的姓名和财富数据")
 71     print(namelist)
 72     print(moneylist2)
 73     return namelist,moneylist2
 74
 75 ## 统计排行榜中每个国家的上榜人数 以字典list返回
 76 def countcountrynum(path):
 77    import xlrd
 78    book = xlrd.open_workbook(path)
 79    sheet1 = book.sheets()[0]
 80    countrylist = sheet1.col_values(4)[1:-1]
 81    print(countrylist)
 82    countryset = list(set(countrylist))
 83    dictlist = []
 84    for country in countryset:
 85       obj = {"name":country,"count":0}
 86       dictlist.append(obj)
 87    ## 统计出每个国家对应的数量
 88    for obj in dictlist:
 89       for a in countrylist:
 90          if obj['name'] == a:
 91             obj['count'] = obj['count'] + 1
 92    print(dictlist)
 93    ## 将dictlist排序 数量多的放前面 8 5 6 9 3 2 4
 94    for i in range(0,len(dictlist),1):
 95       for j in range(0,len(dictlist)-i-1,1):
 96           if dictlist[j]['count'] < dictlist[j+1]['count']:
 97              temp = dictlist[j]
 98              dictlist[j] = dictlist[j+1]
 99              dictlist[j+1] = temp
100    dictlist2 = dictlist[0:5]
101    set2 = []
102    for a in dictlist2:
103       set2.append(a['name'])
104    othercount = 0;
105    for a in dictlist:
106       if a['name'] not in set2:
107          othercount = othercount + 1
108    dictlist2.append({"name":"其他","count":othercount})
109    print('获取排行榜中每个国家的上榜人数')
110    print(dictlist2)
111    return dictlist2
112
113 ## 绘制条形图和饼状图
114 def drow():
115    import matplotlib.pyplot as plt
116    plt.rcParams['font.sans-serif'] = ['SimHei'] # 设置中文字体
117    plt.figure('福布斯前十榜',figsize=(15,5))
118
119    ## 读取福布斯排行榜前十的数据
120    listx,listy = loadtop10('rank.xls')
121
122    plt.title('福布斯前十榜', fontsize=16)
123    plt.xlabel('人物', fontsize=14)
124    plt.ylabel('金额/亿美元', fontsize=14)
125    plt.tick_params(labelsize=10)
126    plt.grid(linestyle=':', axis='y')
127    a = plt.bar(listx, listy, color='dodgerblue', label='Apple', align='center')
128    # 设置标签
129    for i in a:
130       h = i.get_height()
131       plt.text(i.get_x() + i.get_width() / 2, h, '%d' % int(h), ha='center', va='bottom')
132    ## -------------------------------------------------------------------------
133    dictlist = countcountrynum("rank.xls")
134    plt.figure('各国家上榜人数所占比例')
135    labels = []
136    sizes = []
137    for a in dictlist:
138       labels.append(a['name'])
139       sizes.append(a['count'])
140    explode = (0.1, 0, 0, 0, 0, 0)
141    plt.pie(sizes, explode=explode, labels=labels, autopct='%1.1f%%', shadow=False, startangle=150)
142    plt.title("各国家上榜人数所占比例", fontsize=16)
143    plt.axis('equal')  # 该行代码使饼图长宽相等
144
145    plt.show()
146
147 if __name__ == '__main__':
148
149    ## 爬取数据
150    data = loadalldata()
151    ## 保存数据
152    savedata("rank.xls",data)    # py文件同级目录创建rank.xls文件
153    ## 展示数据
154    drow()
五、总结
1.经过对主题数据的分析与可视化,可以看出进入榜单的大多数都是美国人,总占比38.8%其次是中国,总站比为26.3%。
2.在这次设计过程中,进一步加深对网络爬虫和数据可视化原理的认知,需要改进的是对于可视化部分的掌握还是不够,需要进一步了解

 浙公网安备 33010602011771号