
高三网中国大学综合排名网络爬虫
一、选题的背景
为什么要选择此选题?要达到的数据分析的预期目标是什么?(10 分) 从社会、经济、技术、数据来源等方面进行描述(200 字以内)
随着时间的推移,我们步入高考步入考研,这个时候作为一个考生了解中国大学排名就十分重要了,了解中国高校能提高我们的择校观,在分数一定情况下尽量上个好大学。本次爬虫我将获取中国本科院校的排名,了解这些大学在那些省份,了解他们的星级综合实力。希望在本次爬虫后能更加了解中国高校,数据来源于高三网
二、主题式网络爬虫设计方案(10 分)
1.主题式网络爬虫名称
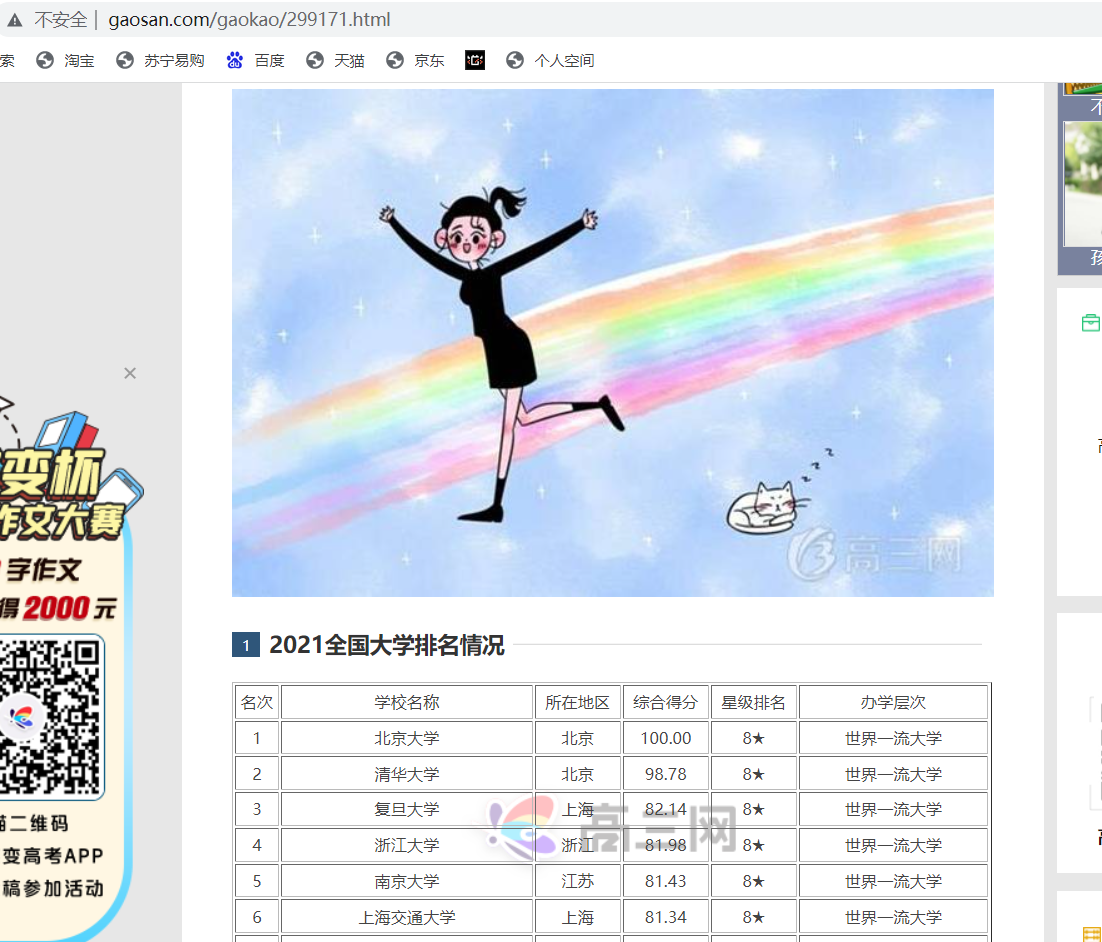
名称是python网络爬虫—中国大学综合排名,url='http://www.gaosan.com/gaokao/299171.html',高三网
2.主题式网络爬虫爬取的内容与数据特征分析
内容是名次 、学校名称 、所在地区 、综合得分 、星级排名 、办学层次 ,这些数据能看出高校的水平和所在地
3.主题式网络爬虫设计方案概述(包括实现思路与技术难点)
找到一个网址并查看他的源代码,看数据所在源代码的位置,通过标签来查看这些数据被谁包裹起来,查看包裹标签的特点,思考是否可爬,怎么爬,技术难点在于他们在一个数据在一个标签里,标签之间没有特点,如何在没有特点的标签中爬取数据呢
三、主题页面的结构特征分析(10 分)
1.主题页面的结构与特征分析 2.Htmls 页面解析 3.节点(标签)查找方法与遍历方法 (必要时画出节点树结构)
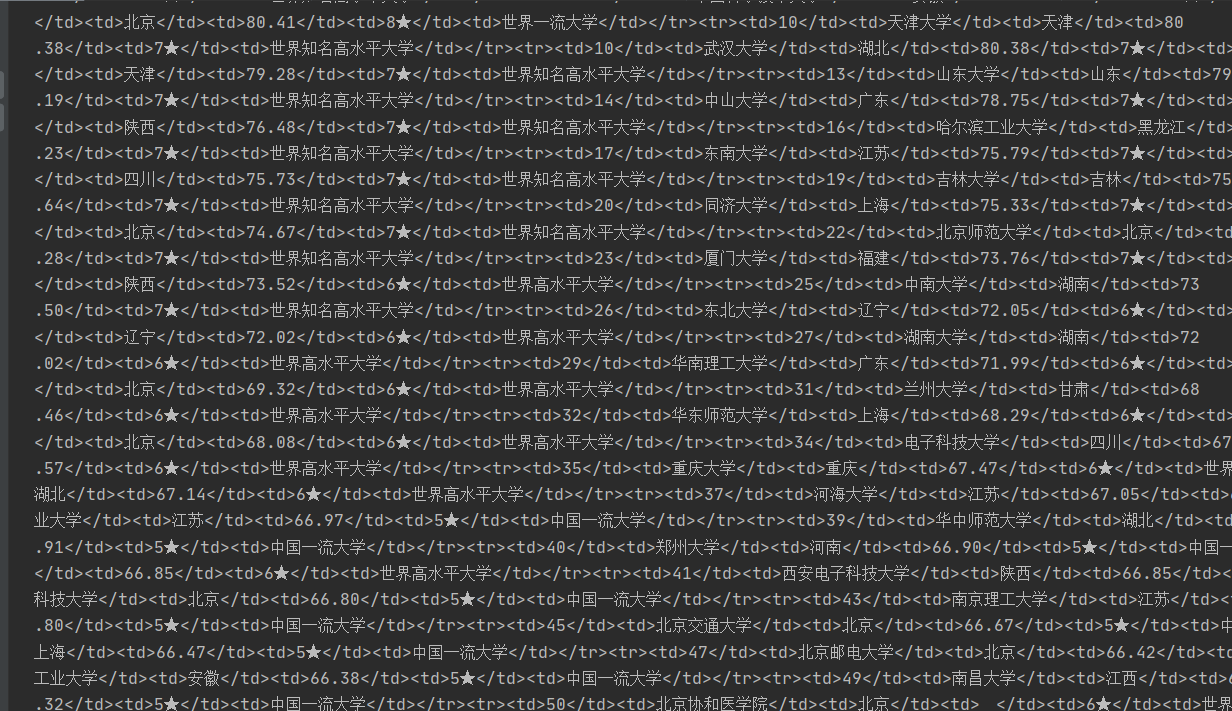
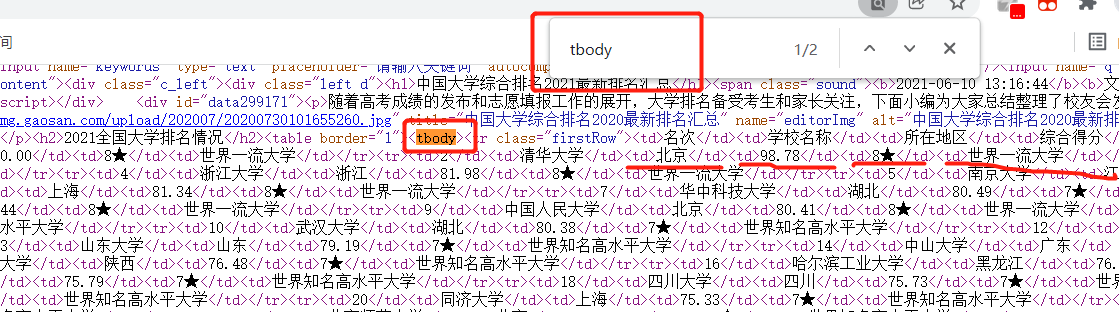
结构是数据被tbody包裹着,每个数据被td标签包裹着,而每行被tr标签包裹着,所以我们可以在网页中查找tbody然后查找tr标签再查找td标签就可以对全部数据进行查找访问了,逐步击破
四、网络爬虫程序设计(60 分)
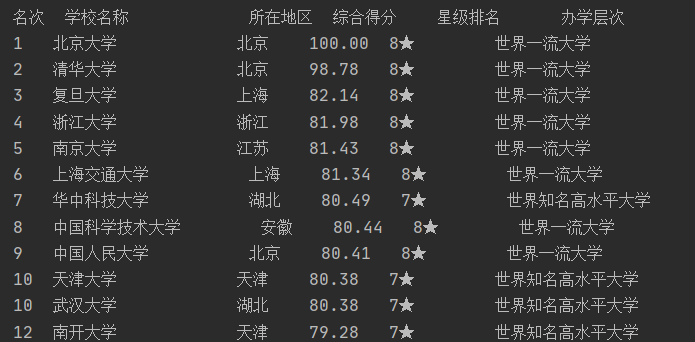
爬取数据
 1 import requests
 2 from bs4 import BeautifulSoup
 3 import matplotlib.pyplot as plt
 4 import jieba
 5 jieba.setLogLevel(jieba.logging.INFO)
 6
 7 #获取网页信息
 8 def gethtml():
 9     #异常处理
10     try:
11         #高三网的url
12         url='http://www.gaosan.com/gaokao/299171.html'
13         #对网页发起请求获取信息
14         re= requests.get(url)
15         #如果返回值不是200说明发生了HTMLerror
16         re.raise_for_status()
17         #统一编码
18         re.encoding = re.apparent_encoding
19         return  re.text
20     except:
21         #如果失败发出失败提示
22         return '获取失败'
23
24 #放大学信息
25 college=[]
26 #用美味谈解析网页
27 def htmlsoup(txt):
28     #美味汤解析网页,按照HTML的原则
29     soup=BeautifulSoup(txt, 'html.parser')
30     #解析的网页查找全部标签是tbody的内容
31     soupf= soup.find_all('tbody')
32     #对美味汤分析的html页面进行遍历
33     for i in soupf:
34         #查找所有tr标签
35         tr=i.find_all('tr')
36         #每一个tr都是一个tr标签
37         for j in tr:
38             #j都是一个td
39             for td in j:
40                 #string获得标签之间的内容
41                 #再转str
42                 strtr=str(td.string)
43                 #字符添加到大学列表
44                 college.append(strtr)
45     return college
46
47 #处理内容
48 def dealhtml(college):
49     #用来切分的工具
50     dealmark=0
51     #对其中的数据一个个的遍历
52     # 用来装分数组的
53     dealc = []
54     for c in college:
55         dealmark=dealmark+1
56         #每6个一组
57         if dealmark%6!=0:
58             dealc.append(c)
59         #如果已经6个一组了
60         else:
61             dealc.append(c)
62             #添加到总的
63             dealcollege.append(dealc)
64             #再初始化
65             dealc=[]
66     return dealcollege
67
68 #处理得分异常问题
69 def dealcolleges(dealcollege):
70     for i in dealcollege:
71         if i[3]=='\u3000':
72             i[3]='无得分'
73         else:
74             continue
75     return dealcollege
76
77 import pandas
78 #用来输出的函数
79 def printcollege(dealcollege):
80     for i in dealcollege:
81         print("%-4s%-16s%-6s%-8s%-10s%-12s"%(i[0],i[1],i[2],i[3],i[4],i[5]))
82
83 #经过处理的大学
84 dealcollege=[]
85 #运行函数
86 def run():
87     txt=gethtml()
88     collegesoup=htmlsoup(txt)
89     d=dealhtml(collegesoup)
90     dd=dealcolleges(d)
91     printcollege(dd)
92
93 if __name__ == '__main__':
94     run()
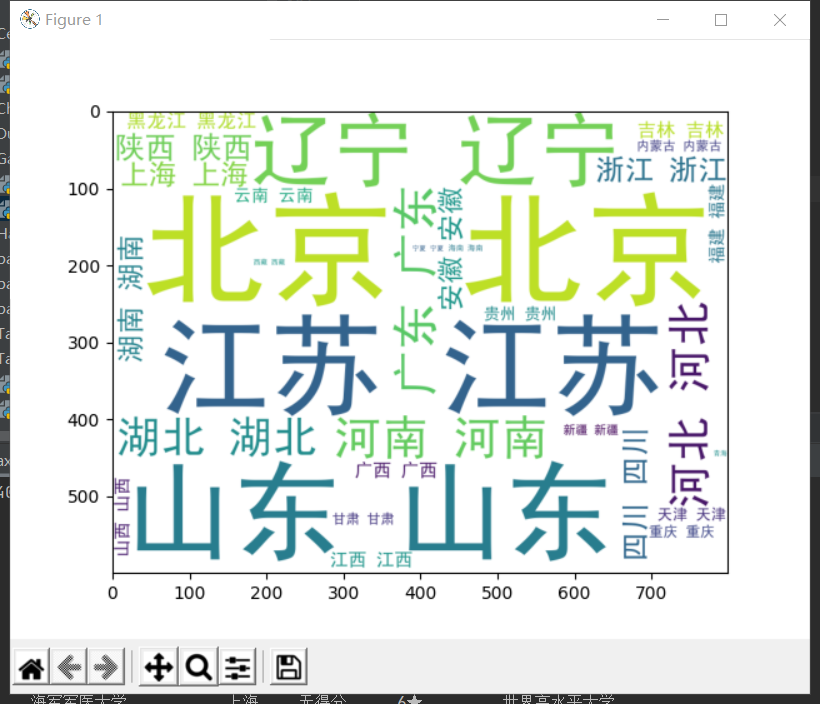
词云如下
 1 from wordcloud import WordCloud
 2 #省份
 3 province=[]
 4 #从dealcollege添加进去
 5 for d in dealcollege[1:]:
 6     province.append(d[2])
 7 #单个省份
 8 everyprovinse=set(province)
 9 listp=list(everyprovinse)
10 #一共多少省份
11 len_listp=len(listp)
12 number=[0 for i in range(len_listp)]
13 #每个省份的数量
14 for p in province:
15     for i in range(len_listp):
16         #有多少个
17         if listp[i]==p:
18             number[i]+=1
19             break
20         else:
21             continue
22
23 strprovince=''
24 #所有省份加一起
25 for i in range(len_listp):
26     intnumber=int(number[i])
27     #加\t才能分词
28     strp=(listp[i]+'\t')*intnumber
29     strprovince+=strp
30 #中文包地址
31 path='e:\\SimHei.ttf'
32 w=WordCloud(font_path=path,
33             background_color='White',
34             width=800,
35             height=600,
36             )
37 #放入文本
38 w.generate(strprovince)
39 plt.imshow(w)
40 # 坐标轴
41 plt.axis()
42 #显示
43 plt.show()
44 #词云保存地
45 w.to_file('地址')
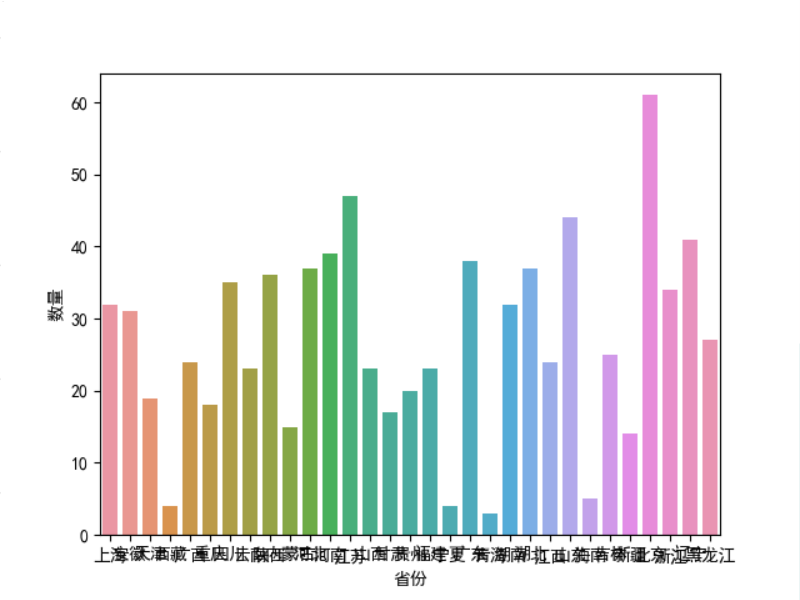
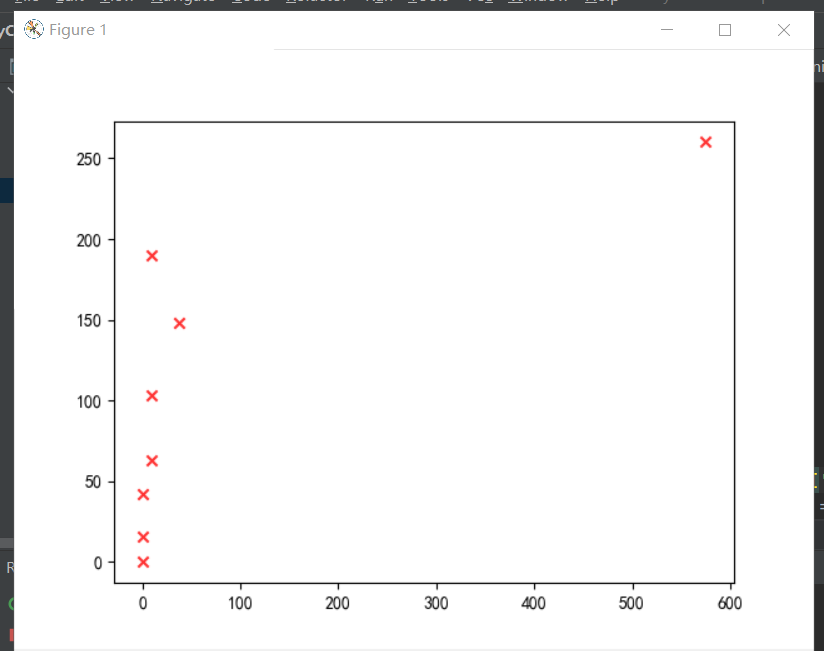
可视化
 1 #条形图
 2 import matplotlib.pyplot as plt
 3 import seaborn as sns
 4 #中文包
 5 plt.rcParams['font.sans-serif'] = ['SimHei']
 6 plt.rcParams['axes.unicode_minus'] = False
 7 x =listp
 8 y =number
 9 # Seaborn画条形图
10 data=pandas.DataFrame({
11 '数量':y,
12 '省份':x})
13 sns.barplot(
14             x="省份",
15             y="数量",
16             data=data
17             )
18 plt.show()
19
20 #散点图
21 import matplotlib.pyplot as plt
22 #高校的星级
23 xx=[0 for i in range(8)]
24 #高校的评分范围
25 score=[0 for i in range(8)]
26 for i in dealcollege[1:]:
27     if i[3]!='无得分':
28         inti=int(eval(i[3]))
29         if 0<=inti<60:
30             score[0]+=1
31         elif 60<=inti<65:
32             score[1]+=1
33         elif 65<=inti<70:
34             score[2]+=1
35         elif 70<=inti<75:
36             score[3]+=1
37         elif 75<=inti<80:
38             score[4]+=1
39         elif 80<=inti<85:
40             score[5]+=1
41         elif 85<=inti<90:
42             score[6]+=1
43         elif 90<=inti<100:
44             score[7]+=1
45     for h in range(8):
46         if int(i[-2][:-1])==h:
47             xx[h]+=1
48 plt.scatter(score,xx,marker='x', c="red", alpha=0.8)
49 plt.show()
保存
1 #保存
2 import csv
3 f = open('e:\\daxue.csv','w',newline='')
4 w= csv.writer(f)
5 for i in dealcollege:
6     w.writerow(i)
7 f.close()

全部代码
  1 # --*-- coding:utf-8 --*--
  2 import requests
  3 from bs4 import BeautifulSoup
  4 import matplotlib.pyplot as plt
  5
  6
  7 #获取网页信息
  8 def gethtml():
  9     #异常处理
 10     try:
 11         #高三网的url
 12         url='http://www.gaosan.com/gaokao/299171.html'
 13         #对网页发起请求获取信息
 14         re= requests.get(url)
 15         #如果返回值不是200说明发生了HTMLerror
 16         re.raise_for_status()
 17         #统一编码
 18         re.encoding = re.apparent_encoding
 19         return  re.text
 20     except:
 21         #如果失败发出失败提示
 22         return '获取失败'
 23
 24 #放大学信息
 25 college=[]
 26 #用美味谈解析网页
 27 def htmlsoup(txt):
 28     #美味汤解析网页,按照HTML的原则
 29     soup=BeautifulSoup(txt, 'html.parser')
 30     #解析的网页查找全部标签是tbody的内容
 31     soupf= soup.find_all('tbody')
 32     #对美味汤分析的html页面进行遍历
 33     for i in soupf:
 34         #查找所有tr标签
 35         tr=i.find_all('tr')
 36         #每一个tr都是一个tr标签
 37         for j in tr:
 38             #j都是一个td
 39             for td in j:
 40                 #string获得标签之间的内容
 41                 #再转str
 42                 strtr=str(td.string)
 43                 #字符添加到大学列表
 44                 college.append(strtr)
 45     return college
 46
 47 #处理内容
 48 def dealhtml(college):
 49     #用来切分的工具
 50     dealmark=0
 51     #对其中的数据一个个的遍历
 52     # 用来装分数组的
 53     dealc = []
 54     for c in college:
 55         dealmark=dealmark+1
 56         #每6个一组
 57         if dealmark%6!=0:
 58             dealc.append(c)
 59         #如果已经6个一组了
 60         else:
 61             dealc.append(c)
 62             #添加到总的
 63             dealcollege.append(dealc)
 64             #再初始化
 65             dealc=[]
 66     return dealcollege
 67
 68 #处理得分异常问题
 69 def dealcolleges(dealcollege):
 70     for i in dealcollege:
 71         if i[3]=='\u3000':
 72             i[3]='无得分'
 73         else:
 74             continue
 75     return dealcollege
 76
 77 import pandas
 78 #用来输出的函数
 79 def printcollege(dealcollege):
 80     for i in dealcollege:
 81         print("%-4s%-16s%-6s%-8s%-10s%-12s"%(i[0],i[1],i[2],i[3],i[4],i[5]))
 82
 83 #经过处理的大学
 84 dealcollege=[]
 85 #运行函数
 86 def run():
 87     txt=gethtml()
 88     collegesoup=htmlsoup(txt)
 89     d=dealhtml(collegesoup)
 90     dd=dealcolleges(d)
 91     printcollege(dd)
 92
 93 if __name__ == '__main__':
 94     run()
 95
 96 #词云
 97 from wordcloud import WordCloud
 98 #省份
 99 province=[]
100 #从dealcollege添加进去
101 for d in dealcollege[1:]:
102     province.append(d[2])
103 #单个省份
104 everyprovinse=set(province)
105 listp=list(everyprovinse)
106 #一共多少省份
107 len_listp=len(listp)
108 number=[0 for i in range(len_listp)]
109 #每个省份的数量
110 for p in province:
111     for i in range(len_listp):
112         #有多少个
113         if listp[i]==p:
114             number[i]+=1
115             break
116         else:
117             continue
118
119 strprovince=''
120 #所有省份加一起
121 for i in range(len_listp):
122     intnumber=int(number[i])
123     #加\t才能分词
124     strp=(listp[i]+'\t')*intnumber
125     strprovince+=strp
126 #中文包地址
127 path='e:\\SimHei.ttf'
128 w=WordCloud(font_path=path,
129             background_color='White',
130             width=800,
131             height=600,
132             )
133 #放入文本
134 w.generate(strprovince)
135 plt.imshow(w)
136 # 坐标轴
137 plt.axis()
138 #显示
139 plt.show()
140 #词云保存地
141 w.to_file('地址')
142
143 #条形图
144 import matplotlib.pyplot as plt
145 import seaborn as sns
146 #中文包
147 plt.rcParams['font.sans-serif'] = ['SimHei']
148 plt.rcParams['axes.unicode_minus'] = False
149 x =listp
150 y =number
151 # Seaborn画条形图
152 data=pandas.DataFrame({
153 '数量':y,
154 '省份':x})
155 sns.barplot(
156             x="省份",
157             y="数量",
158             data=data
159             )
160 plt.show()
161
162 #散点图
163 import matplotlib.pyplot as plt
164 #高校的星级
165 xx=[0 for i in range(8)]
166 #高校的评分范围
167 score=[0 for i in range(8)]
168 for i in dealcollege[1:]:
169     if i[3]!='无得分':
170         inti=int(eval(i[3]))
171         if 0<=inti<60:
172             score[0]+=1
173         elif 60<=inti<65:
174             score[1]+=1
175         elif 65<=inti<70:
176             score[2]+=1
177         elif 70<=inti<75:
178             score[3]+=1
179         elif 75<=inti<80:
180             score[4]+=1
181         elif 80<=inti<85:
182             score[5]+=1
183         elif 85<=inti<90:
184             score[6]+=1
185         elif 90<=inti<100:
186             score[7]+=1
187     for h in range(8):
188         if int(i[-2][:-1])==h:
189             xx[h]+=1
190 plt.scatter(score,xx,marker='x', c="red", alpha=0.8)
191 plt.show()
192
193 #保存
194 import csv
195 f = open('e:\\daxue.csv','w',newline='')
196 w= csv.writer(f)
197 for i in dealcollege:
198     w.writerow(i)
199 f.close()
五、总结(10 分)
1.经过对主题数据的分析与可视化,可以得到哪些结论?是否达到预期的目标?
高校集中在北京、江苏、山东、河南,北京的高校最多质量也最高,国家文档的排名星级可以得到自己的最好选择,已达到预期目标
2.在完成此设计过程中,得到哪些收获?以及要改进的建议?
可以根据高校排名和自身水平寻找合适自己的高校。网址信息不足,如果能获取各个高校的最牛专业进行数据分析就更有针对性了
#条形图
import matplotlib.pyplot as plt
import seaborn as sns
#中文包
plt.rcParams['font.sans-serif'] = ['SimHei']
plt.rcParams['axes.unicode_minus'] = False
x =listp
y =number
# Seaborn画条形图
data=pandas.DataFrame({
'数量':y,
'省份':x})
sns.barplot(
            x="省份",
y="数量",
data=data
            )
plt.show()

#散点图
import matplotlib.pyplot as plt
#高校的星级
xx=[0 for i in range(8)]
#高校的评分范围
score=[0 for i in range(8)]
for i in dealcollege[1:]:
    if i[3]!='无得分':
        inti=int(eval(i[3]))
        if 0<=inti<60:
            score[0]+=1
elif 60<=inti<65:
            score[1]+=1
elif 65<=inti<70:
            score[2]+=1
elif 70<=inti<75:
            score[3]+=1
elif 75<=inti<80:
            score[4]+=1
elif 80<=inti<85:
            score[5]+=1
elif 85<=inti<90:
            score[6]+=1
elif 90<=inti<100:
            score[7]+=1
for h in range(8):
        if int(i[-2][:-1])==h:
            xx[h]+=1
plt.scatter(score,xx,marker='x', c="red", alpha=0.8)
plt.show()

 浙公网安备 33010602011771号