期末大作业
一、boston房价预测
# 线性回归模型:建立13个变量与房价之间的预测模型,并检测模型好坏
import numpy as np
from sklearn.datasets import load_boston
from sklearn.linear_model import LinearRegression
from sklearn.model_selection import train_test_split
import matplotlib.pyplot as plt
# 读取数据集
boston = load_boston()
print(boston.keys())
print(boston.target)# 房价数据
print(boston.feature_names) # 数据集特征
# 划分训练集与测试集
#随机擦痒25%的数据构建测试样本,剩余作为训练样本
X_train,X_test,y_train,y_test = train_test_split(boston.data,boston.target,test_size=0.3) #random_state:是随机数的种子
print(X_train.shape,y_train.shape)
# 建立模型
LineR = LinearRegression()
LineR.fit(X_train,y_train)
# 检查模型好坏
x_predict = LineR.predict(X_test)
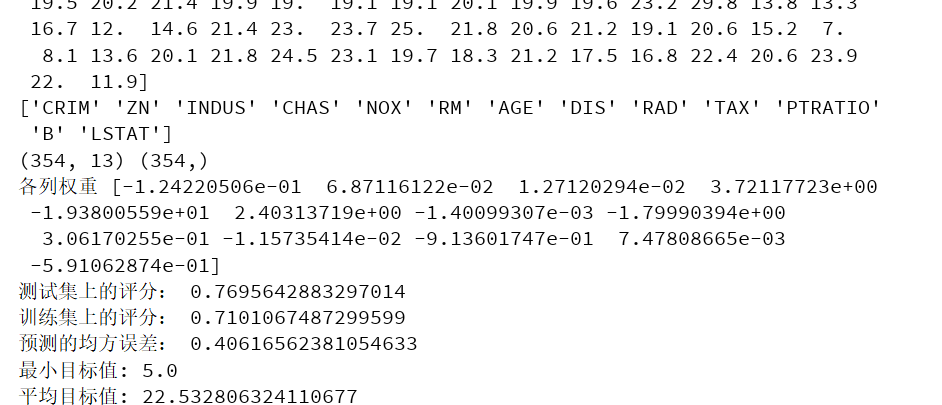
print("各列权重",LineR.coef_)
print("测试集上的评分:",LineR.score(X_test, y_test))
print("训练集上的评分:",LineR.score(X_train, y_train))
print("预测的均方误差:", np.mean(x_predict - y_test)**2)
print("最小目标值:",np.min(boston.target))
print("平均目标值:",np.mean(boston.target))
# 画图
X = boston.data[:,12].reshape(-1,1)
y = boston.target
plt.scatter(X,y)
LineR2 = LinearRegression()
LineR2.fit(X,y)
y_predict = LineR2.predict(X)
plt.plot(X,y_predict,'r')
plt.show()
# 多项式回归模型:建立13个变量与房价之间的预测模型,并检测模型好坏
from sklearn.datasets import load_boston
from sklearn.linear_model import LinearRegression
from sklearn.model_selection import train_test_split
from sklearn.preprocessing import PolynomialFeatures
import matplotlib.pyplot as plt
# 读取数据集
boston = load_boston()
# 划分训练集与测试集
#随机擦痒25%的数据构建测试样本,剩余作为训练样本
x_train,x_test,y_train,y_test = train_test_split(boston.data,boston.target,test_size=0.3) #random_state:是随机数的种子
x = x_train[:,12].reshape(-1,1)
poly= PolynomialFeatures(degree=2)
x_poly = poly.fit_transform(x)
# 建立多项式回归模型
lrp = LinearRegression()
lrp.fit(x_poly,y_train)
lr = LinearRegression()
lr.fit(x,y_train)
w = lr.coef_
b = lr.intercept_
# 预测
x_poly2 = poly.transform(x_test[:, 12].reshape(-1,1))
y_ploy_predict = lrp.predict(x_poly2)
# 画图
plt.scatter(x_test[:,12], y_test)
plt.plot(x, w * x + b, 'g')
plt.scatter(x_test[:,12], y_ploy_predict, c='r')
plt.show()

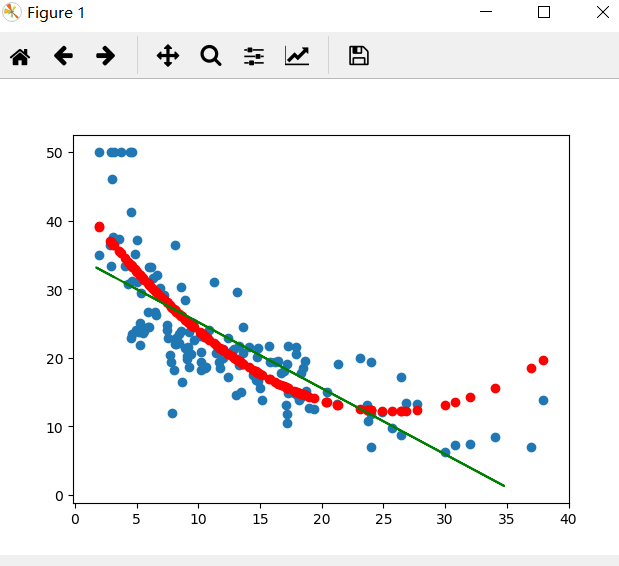
线性模型可以是用曲线拟合样本,但是分类的决策边界一定是直线的。多项式模型是曲线形式,比线性回归模型更加贴近样本点分布的范围,误差值更小。
二、中文文本分类
# 新闻文本分类
import os
import jieba
# 读取文件内容
content = [] # 存放新闻的内容
label = [] # 存放新闻的类别
def read_txt(Z):
folder_list = os.listdir(Z) # 遍历data下的文件名
for file in folder_list:
new_Z = os.path.join(Z, file) # 读取文件夹的名称,生成新的路径
files = os.listdir(new_Z) # 存放文件的内容
# i = 1
#遍历每个txt文件
for Q in files:
# if i > 50:
# break
with open(os.path.join(new_Z, Q), 'r', encoding='UTF-8')as Q: # 打开txt文件
temp_file = Q.read()
content.append(processing(temp_file))
label.append(file)
# i += 1
# print(content)
# print(label)
# 对数据进行预处理
with open(r'stopsCN.txt', encoding='utf-8') as Q:
stopwords = Q.read().split('\n')
def processing(texts):
# 去掉非法的字符
texts = "".join([char for char in texts if char.isalpha()])
# 用jieba分词
texts = [text for text in jieba.cut(texts, cut_all=True) if len(text) >= 2]
# 去掉停用词
texts = " ".join([text for text in texts if text not in stopwords])
return texts
if __name__ == '__main__':
Z = r'D:\0369'
read_txt(Z)
# 划分训练集和测试,用TF-IDF算法进行单词权值的计算
from sklearn.feature_extraction.text import TfidfVectorizer
from sklearn.model_selection import train_test_split
tfidf = TfidfVectorizer()
x_train, x_test, y_train, y_test = train_test_split(content, label, test_size=0.2)
X_train = tfidf.fit_transform(x_train)
X_test = tfidf.transform(x_test)
# 构建贝叶斯模型
from sklearn.naive_bayes import MultinomialNB # 用于离散特征分类,文本分类单词统计,以出现的次数作为特征值
mulp = MultinomialNB()
mulp_NB = mulp.fit(X_train, y_train)
# 对模型进行预测
y_predict = mulp.predict(X_test)
# # 从sklearn.metrics里导入classification_report做分类的性能报告
from sklearn.metrics import classification_report
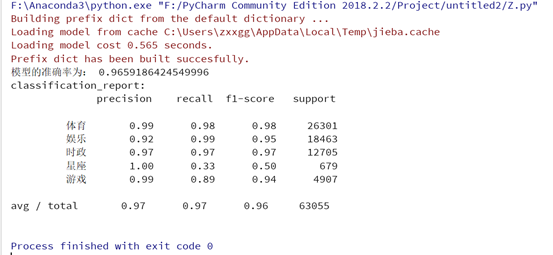
print('模型的准确率为:', mulp.score(X_test, y_test))
print('classification_report:\n', classification_report(y_test, y_predict))


 浙公网安备 33010602011771号