开发自己的Prometheus Exporter、实现自定义指标
Prometheus Exporter基础知识
Prometheus Exporter的概念、工作原理
-
Collector:用于从目标应用程序或系统收集指标并将其转化为Prometheus可识别的格式。收集器可以使用Prometheus客户端库来生成指标,并公开HTTP/metrics以便Prometheus Server进行定期调用和拉取指标。
-
Exporter:它会从Collector获取指标数据,并将其转成为Prometheus可读格式。
Prometheus Server:它是一个用于存储和查询指标数据的中心化实践序列数据库服务器。Prometheus Server使用scrape_configs的YAML配置文件,其中指定了每个Exporter的配置信息,包括URL、抓取间隔等。
Prometheus 指标格式及其应用
Prometheus使用一种简单的文本格式来表示指标数据,即“度量名称{标签名="标签值", ...} 值 时间戳”这样的格式。例如:
http_request_duration_seconds_bucket{le="0.2"} 150
http_request_duration_seconds_bucket{le="0.5"} 200
其中,”http_request_duration_seconds_bucket”是度量名称,”le”是标签名,”0.2”、”0.5”是标签值, 150、200是相应的值,时间戳则通常省略不写。
Prometheus指标格式的应用包括:
1.收集指标数据:在Prometheus Exporter中,我们通过Collector来收集指标数据,并将其转换为合适的指标格式。
2.暴露指标数据:Prometheus Exporter会把采集到的指标数据暴露给Prometheus,使得Prometheus能够对其进行监控和分析。
3.查询指标数据:在Prometheus中,我们可以使用PromQL查询语言对指标数据查询和分析,比如计算指标的平均值、最大值、最小值等等。
4.可视化指标:通过Grafana等可视化工具,我们可以将Prometheus收集到的指标数据进行图表展示和监控报警等操作。
总之,Prometheus指标格式是Prometheus监控系统中非常重要的一个概念,它是实现收集、查询、暴露、查询和可视化数据的基础。
Prometheus四种指标类型
Prometheus定义了四种主要的指标类型:
-
Counter(计数器):用于表示单调递增的指标,例如请求数等。Counter在每次观测时会增加它所代表的值(通常是一个整数),但不会减少或者重置。
-
Gauge(仪表盘):用于表示可变化的度量值,例如CPU利用率、内存用量等。Gauge可以增加、减少或重置,代表着当前的状态。
-
Histogram(直方图):用于表示数据样本的分布情况,例如请求延迟等。Histogram将数据按照桶(bucket)进行划分,并对每个桶内的样本计算出一些统计信息,如样本数量、总和、平均值等。
-
Summary(摘要):类似于Histogram,也用于表示数据样本的分布情况,但同时展示更多的统计信息,如样本数量、总和、平均值、上分位数、下分位数等。
这些指标类型可以组合使用,以便更好的描述系统运行状态和性能指标。例如使用Counter来记录某个API的请求数,使用Gauge来记录内存使用量,使用Histogram来记录请求延迟分布情况。使用Summary来记录响应时间分布情况。在实际应用中应根据需要选择合适的指标类型来表示监控数据。
Exporter Counter 示例
import (
 "net/http"

 "github.com/prometheus/client_golang/prometheus"
 "github.com/prometheus/client_golang/prometheus/promhttp"
)

func main() {
 // 创建一个Counter指标
 counterMetric := prometheus.NewCounter(prometheus.CounterOpts{
  Name: "example_counter", // 指标名称
  Help: "An example counter metric.", // 指标帮助信息
 })

 // 注册指标
 prometheus.MustRegister(counterMetric)

 // 增加指标值
 counterMetric.Inc()

 // 创建一个HTTP处理器来暴露指标
 http.Handle("/metrics", promhttp.Handler())

 // 启动Web服务器
 http.ListenAndServe(":8080", nil)
}
Exporter Gauge示例
import (
 "net/http"

 "github.com/prometheus/client_golang/prometheus"
 "github.com/prometheus/client_golang/prometheus/promhttp"
)

func main() {
 // 创建一个Gauge指标
 guageMetric := prometheus.NewGauge(prometheus.GaugeOpts{
  Name: "example_gauge", // 指标名称
  Help: "An example gauge metric.", // 指标帮助信息
 })

 // 注册指标
 prometheus.MustRegister(guageMetric)

 // 设置指标值
 guageMetric.Set(100)

 // 创建一个HTTP处理器来暴露指标
 http.Handle("/metrics", promhttp.Handler())

 // 启动Web服务器
 http.ListenAndServe(":8080", nil)
}
Exporter Histogram示例
import (
 "math/rand"
 "net/http"
 "time"

 "github.com/prometheus/client_golang/prometheus"
 "github.com/prometheus/client_golang/prometheus/promhttp"
)

func main() {
 // 创建一个Histogram指标
 histogramMetric := prometheus.NewHistogram(prometheus.HistogramOpts{
  Name:    "example_histogram", // 指标名称
  Help:    "An example histogram metric.", // 指标帮助信息
  Buckets: prometheus.LinearBuckets(0, 10, 10), // 设置桶宽度
 })

 // 注册指标
 prometheus.MustRegister(histogramMetric)

 // 定期更新指标值
 go func() {
  for {
   time.Sleep(time.Second)
   histogramMetric.Observe(rand.Float64() * 100)
  }
 }()

 // 创建一个HTTP处理器来暴露指标
 http.Handle("/metrics", promhttp.Handler())

 // 启动Web服务器
 http.ListenAndServe(":8080", nil)
}
Exporter Summary示例
import (
 "math/rand"
 "net/http"
 "time"

 "github.com/prometheus/client_golang/prometheus"
 "github.com/prometheus/client_golang/prometheus/promhttp"
)

func main() {
 // 创建一个Summary指标
 summaryMetric := prometheus.NewSummary(prometheus.SummaryOpts{
  Name:       "example_summary", // 指标名称
  Help:       "An example summary metric.", // 指标帮助信息
  Objectives: map[float64]float64{0.5: 0.05, 0.9: 0.01, 0.99: 0.001}, // 设置分位数和偏差
 })

 // 注册指标
 prometheus.MustRegister(summaryMetric)

 // 定期更新指标值
 go func() {
  for {
   time.Sleep(time.Second)
   summaryMetric.Observe(rand.Float64() * 100)
  }
 }()

 // 创建一个HTTP处理器来暴露指标
 http.Handle("/metrics", promhttp.Handler())

 // 启动Web服务器
 http.ListenAndServe(":8080", nil)
}
配置Exporter 开发环境
在kubernetes中安装Prometheus
-
创建一个prometheus-configmap.yaml文件,用于定义Prometheus配置
apiVersion: v1
kind: ConfigMap
metadata:
  name: prometheus-config
data:
  prometheus.yml: |
    global:
      scrape_interval: 15s
    scrape_configs:
      - job_name: 'pushgateway'
        static_configs:
          - targets: ['pushgateway:9091']
该配置为Prometheus提供了一些基本选项,并定义了pushgateway的作业。pushgateway用于从pushgateway实例中收集指标数据。
-
使用kubectl apply命令创建Prometheus ConfigMap
kubectl apply -f prometheus-configmap.yaml-
创建一个prometheus-deployment.yaml文件,用于定义Prometheus Deployment的配置
apiVersion: apps/v1
kind: Deployment
metadata:
  name: prometheus
spec:
  selector:
    matchLabels:
      app: prometheus
  replicas: 1
  template:
    metadata:
      labels:
        app: prometheus
    spec:
      containers:
      - name: prometheus
        image: prom/prometheus:v2.32.0
        args:
        - "--config.file=/etc/prometheus/prometheus.yml"
        ports:
        - containerPort: 9090
        volumeMounts:  # 挂载ConfigMap中的prometheus.yml配置文件
        - name: config-volume
          mountPath: /etc/prometheus
      volumes:
      - name: config-volume
        configMap:
name: prometheus-config #引用第一步创建的prometheus-config ConfigMap-
创建一个Service对象,在kubernetes集群内部和外部暴露Prometheus服务的访问端点
apiVersion: v1
kind: Service
metadata:
  name: prometheus
spec:
  type: NodePort
  ports:
  - port: 9090
    targetPort: 9090
  selector:
app: prometheus-
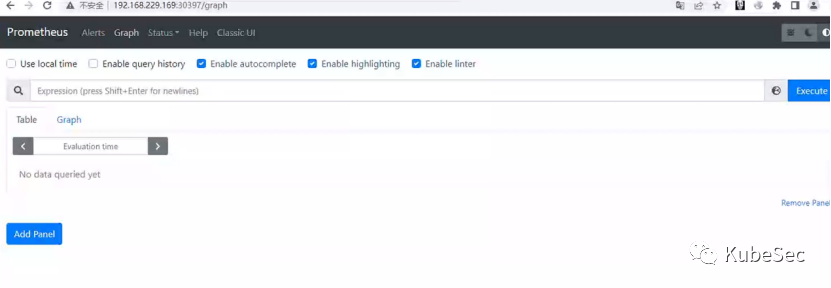
访问Prometheus UI
kubectl apply get svchttp://nodeIP:端口/graph
安装PushGateway
-
创建一个pushgateway-deployment.yaml文件,用于定义PushGateway Deployment的配置
apiVersion: apps/v1
kind: Deployment
metadata:
  name: pushgateway
spec:
  selector:
    matchLabels:
      app: pushgateway
  replicas: 1
  template:
    metadata:
      labels:
        app: pushgateway
    spec:
      containers:
      - name: pushgateway
        image: prom/pushgateway:v1.5.1
        ports:
        - containerPort: 9091
        args:
- "--web.listen-address=:9091"-
使用kubectl apply命令创建PushGateway Deployment
kubectl apply -f pushgateway-deployment.yaml-
创建一个pushgateway-service.yaml文件,用于定义pushgateway service配置
apiVersion: v1
kind: Service
metadata:
  name: pushgateway
spec:
  type: NodePort
  ports:
  - port: 9091
    targetPort: 9091
  selector:
app: pushgateway-
使用kubectl apply命令创建PushGateway Service
kubectl apply -f pushgateway-service.yaml-
在Prometheus配置文件中添加Pushgateway作为目录,以便Promethazine可以获取Pushgateway中的指标数据(在第一步prometheus-configmap.yaml中已加过如下配置、此步跳过)。
scrape_configs:
  - job_name: 'pushgateway'
    static_configs:
- targets: ['pushgateway:9091']-
访问PushGateway
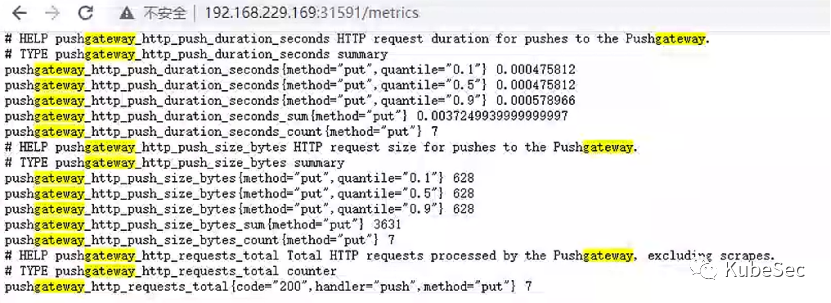
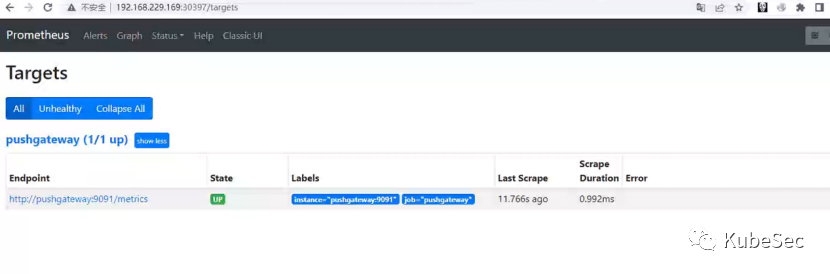
-
Prometheus UI中查看pushgateway
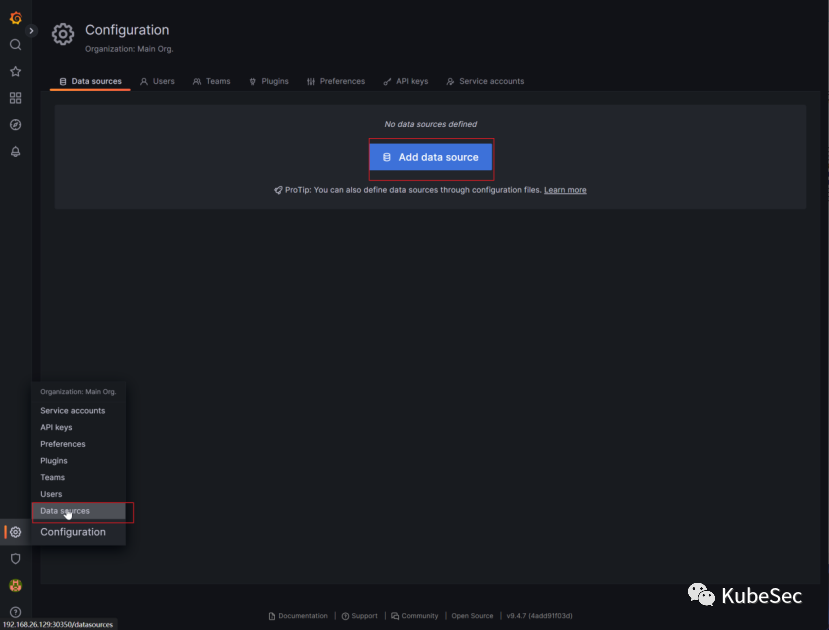
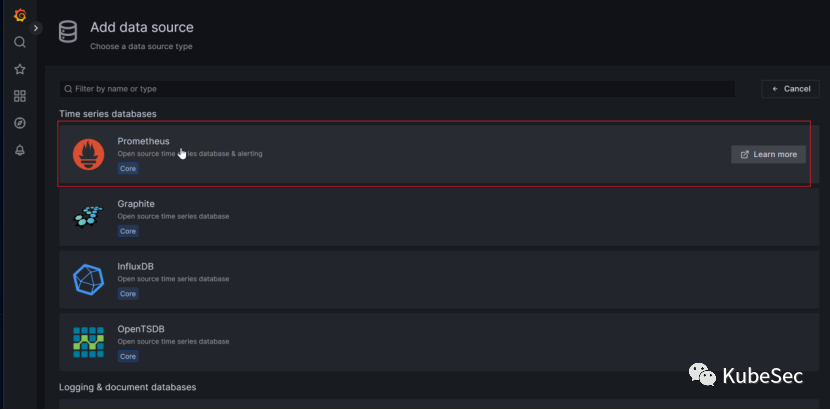
安装Grafana并连接Prometheus
-
创建grafana.yaml用于定于grafana的配置
kind: Deployment
metadata:
  name: grafana-dp
spec:
  selector:
    matchLabels:
      app: grafana-dp
  replicas: 1
  template:
    metadata:
      labels:
        app: grafana-dp
    spec:
      containers:
        - name: grafana
          image: grafana/grafana
          imagePullPolicy: IfNotPresent
          ports:
          - containerPort: 3000

---
apiVersion: v1
kind: Service
metadata:
  name: grafana-svc
spec:
  type: NodePort
  ports:
    - port: 3000
      targetPort: 3000
  selector:
app: grafana-dp-
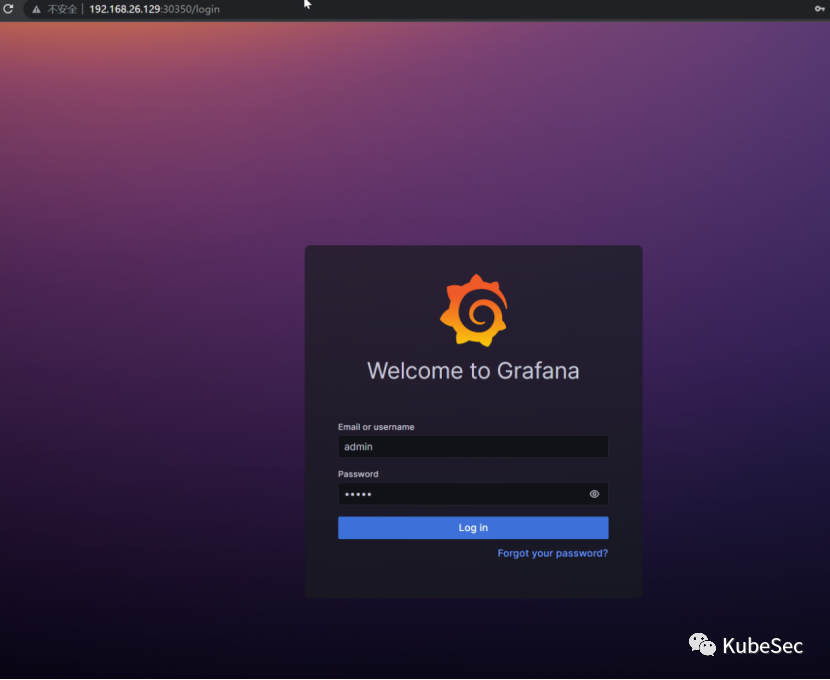
创建grafana deployment和service
kubectl apply -f grafana.yaml
kubectl get svc
用户名admin密码admin
-
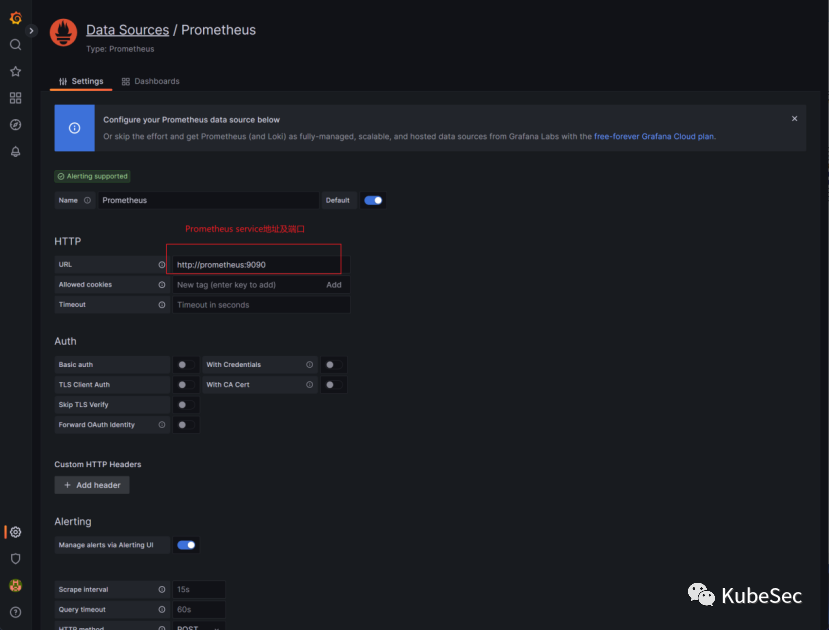
添加Prometheus数据源
监测Go/Python编写的HTTP Server
https://github.com/prometheus/client_golang
https://prometheus.io/docs/instrumenting/clientlibs/
https://prometheus.io/docs/tutorials/instrumenting_http_server_in_go/
使用client_golang库监测HTTP server
package main
import (
"fmt"
"net/http"
"github.com/prometheus/client_golang/prometheus"
"github.com/prometheus/client_golang/prometheus/promhttp"
)
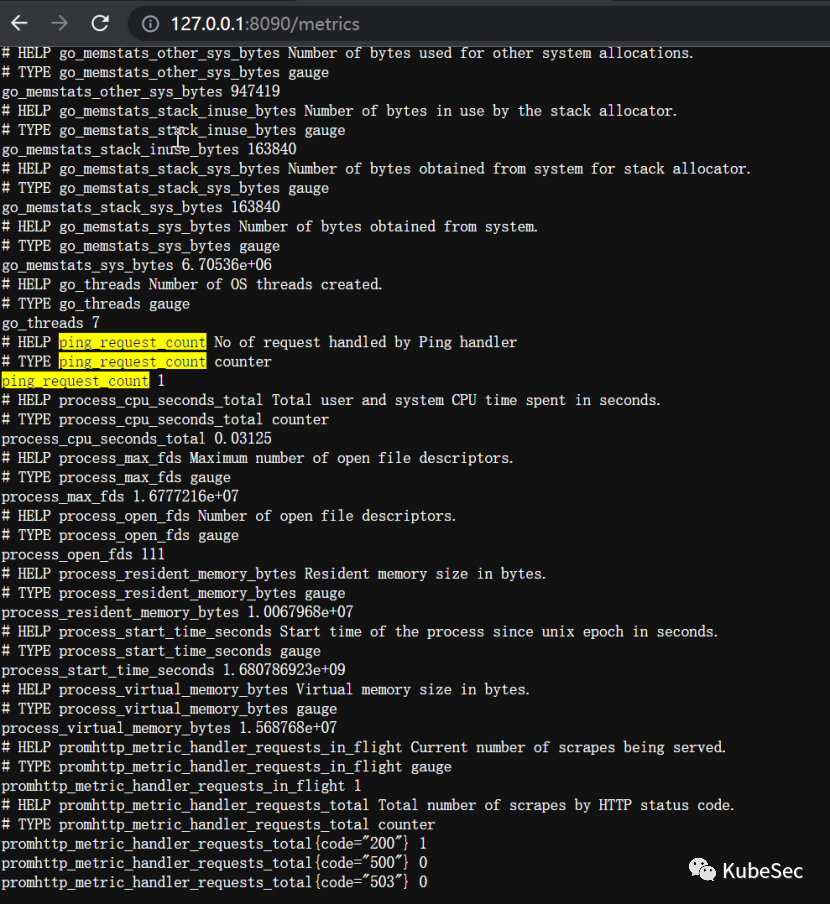
var pingCounter = prometheus.NewCounter(
prometheus.CounterOpts{
Name: "ping_request_count",
Help: "No of request handled by Ping handler",
},
)
func ping(w http.ResponseWriter, req *http.Request) {
pingCounter.Inc()
fmt.Fprintf(w, "pong")
}
func main() {
prometheus.MustRegister(pingCounter)
http.HandleFunc("/ping", ping)
http.Handle("/metrics", promhttp.Handler())
http.ListenAndServe(":8090", nil)
}-
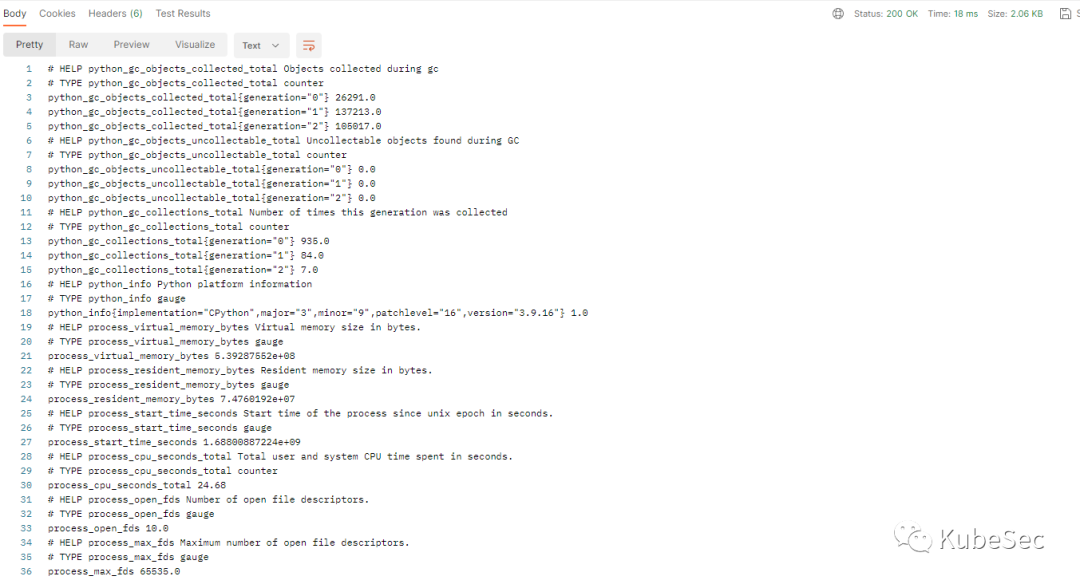
访问metrics接口
使用client_python库监测HTTP server
https://github.com/prometheus/client_python
from flask import Flask
from werkzeug.serving import run_simple
from werkzeug.middleware.dispatcher import DispatcherMiddleware
from prometheus_client import make_wsgi_app

app = Flask(__name__)
app.debug = True
app.wsgi_app = DispatcherMiddleware(app.wsgi_app, {
    '/metrics': make_wsgi_app()
})

@app.route('/')
def hello_world():
    return 'Hello World!'

if __name__ == '__main__':
run_simple('localhost', 5000, app, use_reloader=True, use_debugger=True, use_evalex=True)-
requirements.txt
Flask==2.3.2
uWSGI==2.0.21
prometheus-client==0.17.0-
启动Web应用程序
pip install uwsgi
uwsgi --http 127.0.0.1:8000 --wsgi-file main.py --callable app-
访问metrics接口
Nginx Exporter开发
Nginx status简介
http_stub_status_module时nginx一个模块,它提供了一些简单的指标和状态信息,这些信息可用于监控nginx服务器的监控状态和性能。要启用该模块,需要在nginx配置文件中添加以下内容:
location /nginx_status {
  stub_status on;
  allow 127.0.0.1;
  deny all;
}
此配置将使用nginx在nginx_status上公开stub_status信息。这些信息只允许本地主机(即127.0.0.1)上访问,并拒绝来自其他主机上的访问请求。然后,您可以使用curl等工具向nginx服务器发送HTTP GET请求,以获取当前的状态信息。例如,以下命令将获取位于localhost上的nginx服务器的状态信息:
curl http://localhost/nginx_status此命令将返回像这样的响应:
Active connections: 1
server accepts handled requests
10 10 10
Reading: 0 Writing: 1 Waiting: 0-
Active connectons:当前活跃的连接数。
-
Server Accepts handled requests: 表示从启动到现在一共处理过的连接数,其中accepts表示接收的连接数,handled表示已经处理完成的连接数(可能包括已经关闭的连接数),requests表示已经处理完成的请求数;
-
Reading: 正在读取客户端的请求的连接数;
-
Writing:正在向客户端发送响应的连接数;
-
Waiting:正在等待请求处理的连接数。
除了以上信息,可以通过第三方模块来扩展stub_status模块的功能,例如:ngx_http_substitutions_filter_module、lua-nginx-module。
Nginx Exporter开发
项目源码:https://gitee.com/KubeSec/nginx-exporter
-
/metrics
Exporter部署和测试
cd nginx-exporter
docker build -t nginx-exporter:latest .
kubectl apply -f manifests/install.yaml-
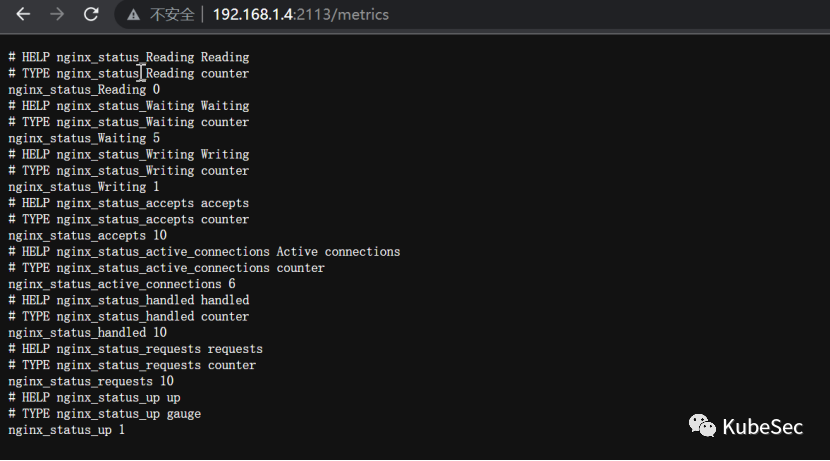
访问/metrics
http://nodeIP:nodePort/metrics
-
在Prometheus中配置我们的nginx-exporter
    scrape_configs:
      - job_name: 'nginx-exporter'
        static_configs:
- targets: ['nginx-exporter-svc:2113']-
在Prometheus UI中查看我的 exporter
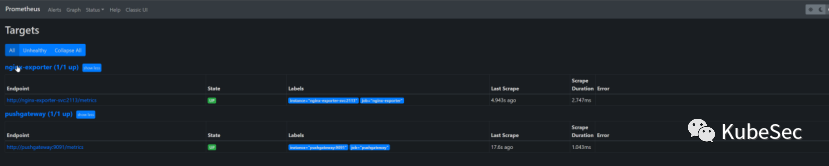
-
补充: memcached_exporter_example项目源码https://gitee.com/KubeSec/memcached_exporter
使用Grafana可视化指标
Grafana图表类型
-
Time Series:时序数据,用于显示时间序列数据。可以使用折线图、面截图、柱状图等形式来呈现。
-
Stat: 可以用于显示数据的统计信息,例如平均值、总和、最大值、最小值等。
-
Table: 用以表格形式显示数据。可以将数据按行或列进行排序,并支持筛选和聚合操作。
PromQL 查询和分析指标数据
PromQL(Prometheus Query Language)是由Prometheus开发的一种灵活的查询语言,用于收集的时间序列中提取、聚合和分析Metric。
up: 返回当前所有Exporter的状态, 1表示健康正在运行,0表示不可访问或异常。sum(nginx_status_requests{job="nginx-exporter", instance="nginx-exporter-svc:2113"})要检索Nginx服务器中当前链接的数量。
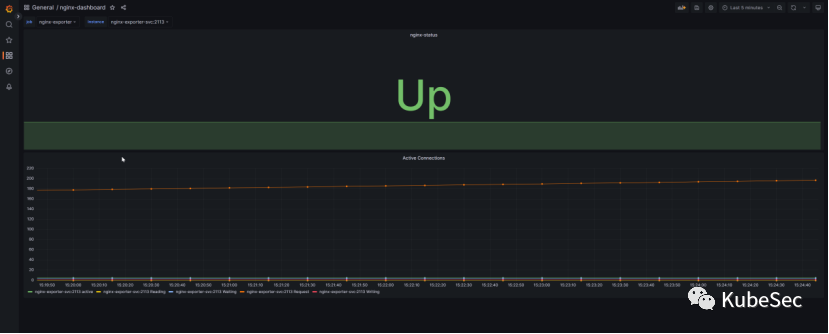
创建Nginx Exporter Dashboard
Grafana导入manifests/nginx-exporter-dashboard.json

 浙公网安备 33010602011771号