ELK学习笔记
ELK
官网:
https://www.elastic.co/cn/elasticsearch/
ElasticSearch
安装JDK
# 查看有哪些版本可安装
yum search java | grep openjdk

# 安装openjdk1.8(推荐安装1.8和openjdk11)
sudo yum install java-1.8.0-openjdk*

#注:暂时不需要配置环境变量
#配置环境变量
打开/etc/profile,添加如下信息,下面 JAVA_HOME,JRE_HOME 为自己JDK的实际路径,自行修改。
#set java environment
JAVA_HOME=/usr/lib/jvm/java-1.8.0-openjdk
JRE_HOME=$JAVA_HOME/jre
CLASS_PATH=.:$JAVA_HOME/lib/dt.jar:$JAVA_HOME/lib/tools.jar:$JRE_HOME/lib/rt.jar
PATH=$PATH:$JAVA_HOME/bin:$JRE_HOME/bin
export JAVA_HOME JRE_HOME CLASS_PATH PATH

#重新加载 /etc/profile 文件,使配置生效
source /etc/profile
#查看版本(安装成功后可查看到对应版本)
java -version
#卸载(批量卸载)
rpm -qa | grep openjdk |xargs rpm -e --nodeps
安装
# 下载并安装公共签名密钥
rpm --import https://artifacts.elastic.co/GPG-KEY-elasticsearch

# 创建 yum 源文件
vim /etc/yum.repos.d/elasticsearch.repo

[elasticsearch-7.x]
name=Elasticsearch repository for 7.x packages
baseurl=https://artifacts.elastic.co/packages/7.x/yum
gpgcheck=1
gpgkey=https://artifacts.elastic.co/GPG-KEY-elasticsearch
enabled=1
autorefresh=1
type=rpm-md

# 安装
yum install -y elasticsearch
# 查看安装位置
whereis elasticsearch
配置
# 配置文件都在 /etc/elasticsearch/ 目录下
vim /etc/elasticsearch/elasticsearch.yml

# 集群名称
cluster.name: ihcc-log
# 节点名称
node.name: node-1
# 数据文件与日志文件存放目录
path.data: /home/esData/es
path.logs: /home/esData/log
# 网络设置
network.host: 0.0.0.0
http.port: 9200
# 集群设置
cluster.initial_master_nodes: ["node-1"]


# 修改配置中目录的用户与用户组,不然无法启动
chown -R elasticsearch:elasticsearch /home/esData/log/
chown -R elasticsearch:elasticsearch /home/esData/es/
启动
# 启动
systemctl start elasticsearch.service

# 开机自启
systemctl enable elasticsearch.service

# 查看状态
systemctl status elasticsearch.service
插件
Elasticsearch-head
#在Elasticsearch配置文件末尾添加如下内容,重新启动elasticsearch服务
http.cors.enabled: true
http.cors.allow-origin: "*"

#安装node
yum install -y npm
#安装git
yum install -y git
#备注:此处安装到/usr/local目录下
git clone git://github.com/mobz/elasticsearch-head.git
cd elasticsearch-head
npm install
#遇到问题则执行
npm config set unsafe-perm true

npm run start
检查端口是否起来
netstat -antp |grep 9100
浏览器访问测试是否正常
http://IP:9100/
Kibana
安装
# 下载并安装公共签名密钥
rpm --import https://artifacts.elastic.co/GPG-KEY-elasticsearch

# 创建 yum 源文件
vim /etc/yum.repos.d/kibana.repo

[kibana-7.x]
name=Kibana repository for 7.x packages
baseurl=https://artifacts.elastic.co/packages/7.x/yum
gpgcheck=1
gpgkey=https://artifacts.elastic.co/GPG-KEY-elasticsearch
enabled=1
autorefresh=1
type=rpm-md

# 安装
yum install -y kibana
配置
# 配置
vim /etc/kibana/kibana.yml

server.host: "0.0.0.0"
# 不要用 127.0.0.1,可能会提示 Kibana server is not ready yet
elasticsearch.hosts: ["http://192.168.8.41:9200"]
i18n.locale: "zh-CN"
启动
# 刷新服务配置
systemctl daemon-reload
# 开机自启
systemctl enable kibana.service
# 启动
systemctl start kibana.service
# 查看状态
systemctl status kibana.service
默认端口为 5601
Logstash
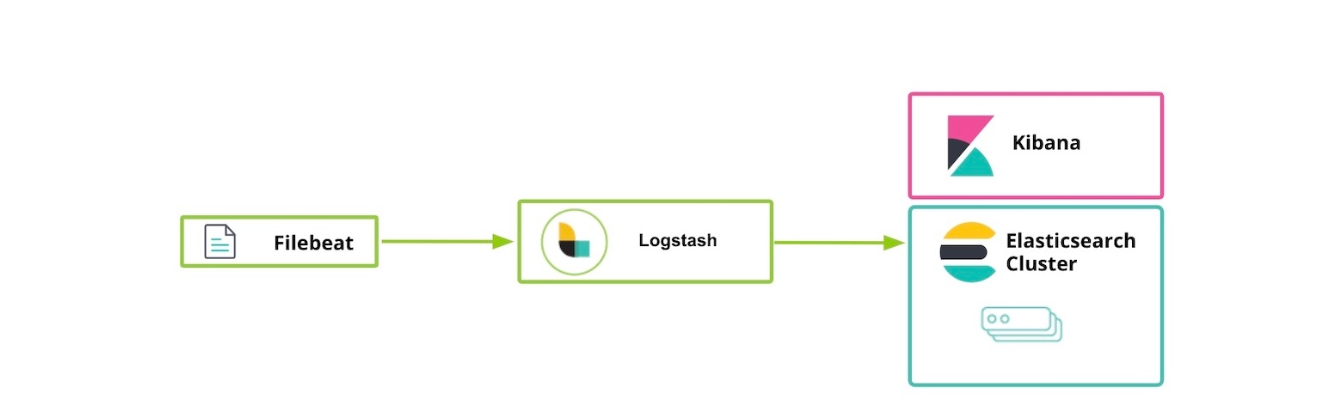
Logstash 是数据管道,可帮助我们处理来自各种来源的日志和其他事件数据。 Logstash 拥有 200 多个插件,可以连接到各种源并将数据流式传输到中央分析系统。 Elastic Stack(Elasticsearch,Logstash和Kibana)是管理和分析日志和事件的最佳解决方案之一。
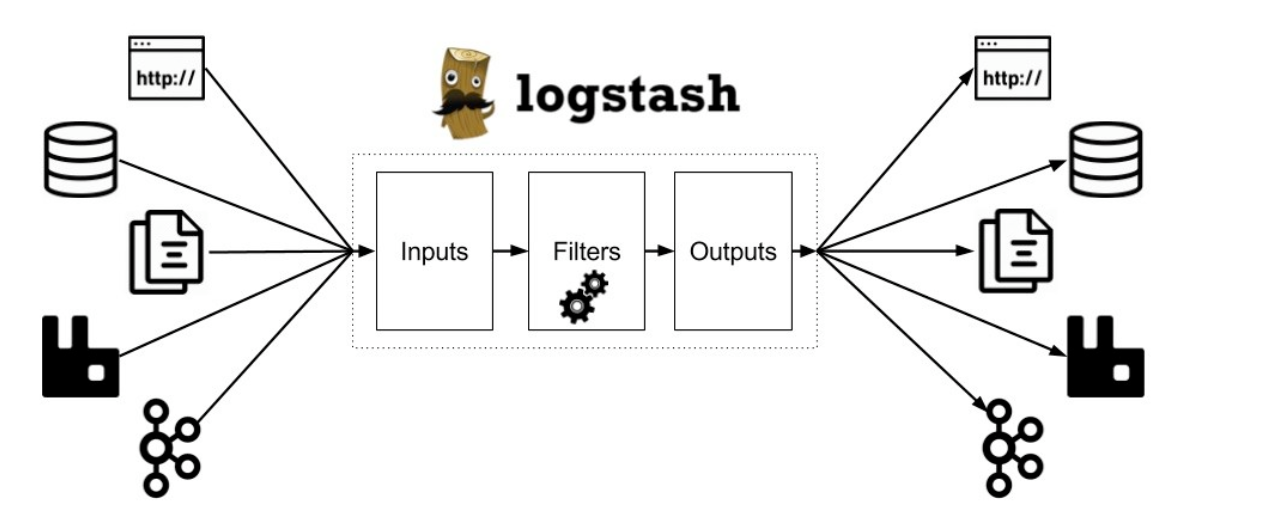
有效分析和查询发送到 Elastic Stack 的数据的能力取决于数据的可读性和质量。 这意味着,如果将非结构化数据(例如纯文本日志)提取到系统中,则必须将其转换为富含有价值字段的结构化形式。 无论数据源是什么,拉动日志并执行一些魔术操作来格式化,转换和丰富它们都是必要的,以确保在将它们发送到 Elasticsearch 之前正确地对其进行了解析。
安装
下载yum源的密钥认证:
# rpm --import https://artifacts.elastic.co/GPG-KEY-elasticsearch

利用yum安装logstash
# yum install -y logstash


查看下logstash的安装目录
# rpm -ql logstash

创建一个软连接,每次执行命令的时候不用在写安装路劲(默认安装在/usr/share下)
ln -s /usr/share/logstash/bin/logstash /bin/

执行logstash的命令
# logstash -e 'input { stdin { } } output { stdout {} }'

运行成功以后输入:
nihao

stdout返回的结果:

#测试,如果标准输出还有elasticsearch中都需要保留
logstash -e 'input { stdin { } } output { elasticsearch { hosts => ["xxx.xx.xxx.xxx:9200"] } stdout { codec => rubydebug }}'
配置
vim /etc/logstash/conf.d/logstash.conf

input {
	file {
		path => "/var/log/"
		type => "system"
		start_position => "beginning"
		}
}
output {
		 elasticsearch {
				hosts => ["xxx.xx.xxx.xxx:9200"]
				index => "system-%{+YYYY.MM.dd}"
			}
}
运行logstash指定logstash.conf配置文件,进行过滤匹配
#logstash -f /etc/logstash/conf.d/logstash.conf
grok
Logstash 中的数据转换和规范化是使用过滤器插件执行的。本文重点介绍最流行和有用的筛选器插件之一 Logstash Grok 过滤器,该插件用于将非结构化数据解析为结构化数据,并准备好在 Elastic Stack 中进行汇总和分析。这使我们能够使用高级功能,例如对值字段进行统计分析,过滤等。如果我们无法将数据分类并分解为单独的字段,则所有搜索都将是全文搜索,这将使我们无法充分利用 Elasticsearch 和 Kibana 搜索。
Grok 过滤器器附带了各种正则表达式和模式
例如:
#我们可以使用 Grok 模式将其表示为 %{NUMBER:duration} 和 %{IP:client},然后在过滤器定义中引用它们。
filter {
  grok {
    match => { "message" => "%{IP:client} %{NUMBER:duration}" }
  }
}
默认情况下,所有语义(例如 DURATION 或 CLIENT)都保存为字符串。 (可选)我们可以向 Grok 模式添加数据类型转换。 例如,%{NUMBER:num:int} 将 num 语义从字符串转换为整数。 当前仅支持 int 和 float 转换。
#默认情况下,被 Grok 匹配的字段是字符串。 可以在模式中声明数字字段(int 和 float ):
filter {
  grok {
    match => [ "message", "%{USERNAME:user:int}" ]
  }
}
定制模式
有时 Logstash 没有我们需要的模式,因此我们需要一些针对这种情况的选项。
#首先,我们可以使用 Oniguruma 语法 进行命名捕获,这将使你匹配一段文本并将其保存为字段:

(?<field_name>the pattern here)
#例如,后缀日志的队列 ID 为10或11个字符的十六进制值。 我们可以像这样轻松捕获:

(?<queue_id>[0-9A-F]{10,11})
你可以创建一个自定义模式文件。
#1.创建一个名为 patterns 的目录,并在其中包含一个名为 extra 的文件。
	#文件名无关紧要,但请取一个自己认有意义的名字来命名,所有此目录下的文件都会加载
#2、在该文件中,将所需的模式写为模式名称,一个空格,然后输入该模式的 regexp
	#文件内容示例:名称 正则表达式
LOG_TIME ^\d{4}-\d{1,2}-\d{1,2}\s\d{1,2}:\d{1,2}:\d{1,2}.\d{3}
LOGT_YPE INFO|ERROR
METHOD_NAME [a-zA-Z0-9._-]+
FUNCTION \[.*?]
ANY_WORD_ONE .*?
MSG .*
SPECIAL_MSG .*?\|\|\|.*
#3、配置logstash的filter,此处除了原来的patterns,就可以使用自定义的模式了
filter {
	grok {
		patterns_dir => ["/etc/logstash/patterns"]
		match => { "message" => '%{LOG_TIME:logtime}[T ]+%{LOGT_YPE:logtype}[T ]+%{NUMBER:theard}[T ]+\-\-\-[T ]+\[%{CLASS_NAME:function}\][T ]+%{CLASS_NAME:class}[T ]+'}
	}
}
#4、grok的测试可以在kibana中进行
启动
#创建一个软连接,每次执行命令的时候不用在写安装路劲(默认安装在/usr/share下)
ln -s /usr/share/logstash/bin/logstash /bin/
#执行
logstash -f /etc/logstash/conf.d/logstash.conf
#后台启动
nohup logstash -f /etc/logstash/conf.d/logstash.conf
-l /usr/share/logstash/logs/logstash.log &
#日志输出在nohub.out
可参考:完整配置
#logstash的配置
input {
  beats {
	port => 5044
  }
}

filter {
	#不同的日志不同的处理方式
	if "springboot1-logs" in [tags]{
		grok {
			patterns_dir => ["/etc/logstash/patterns"]
			match => { "message" => '%{LOG_TIME:logtime}[T ]+%{LOGT_YPE:logtype}[T ]+%{NUMBER:theard}[T ]+\-\-\-[T ]+\[%{CLASS_NAME:function}\][T ]+%{CLASS_NAME:class}[T ]+'}
		}
		#将日志的日期logtime存到@timestamp 然后删除logtime
		date{
		   match => ["logtime","YYYY-MM-dd HH:mm:ss.SSS"]
		   remove_field =>["logtime"]
		}
		date {
		  match => ["timestamp","dd/MMM/YYYY:HH:mm:ss Z"]
		}
	}
}

output {
	#不同的日志存放在不同的索引中
	if "springboot1-logs" in [tags]{
		elasticsearch {
		  hosts => "xxx.xx.xxx.xxx:9200"
		  index => "springboot1-logs" #索引的名称根据日志的源类型,此处为filebeats中定义
		  #template_name => "mprobelog"
		  #document_id => "%{id}"
		}
	}
	if "springboot2-logs" in [tags]{
		elasticsearch {
		  hosts => "xxx.xx.xxx.xxx:9200"
		  index => "springboot2-logs" #索引的名称根据日志的源类型,此处为filebeats中定义
		  #template_name => "mprobelog"
		  #document_id => "%{id}"
		}
	}
 stdout { codec => json_lines }
}
Filebeats
日志采集器有很多,比如Logstash,功能虽然强大,但是它依赖java、在数据量大的时候,Logstash进程会消耗过多的系统资源,这将严重影响业务系统的性能,而filebeat就是一个完美的替代者,它基于Go语言没有任何依赖,配置文件简单,格式明了,同时,filebeat比logstash更加轻量级,所以占用系统资源极少,非常适合安装在生产机器上。这就是推荐使用filebeat来作为日志收集软件的原因。Filebeat可以直接(或者通过Logstash)将数据发送到Elasticsearch、Kafka或者Redis,在那里可以进一步处理和增强数据,然后在Kibana中将其可视化,目前来说Filebeat是 ELK 日志系统在Agent上的第一选择。
相比 Logstash,Beats 所占系统的 CPU 和内存几乎可以忽略不计。另外,Beats 和 Logstash 之间支持 SSL/TLS 加密传输,客户端和服务器双向认证,保证了通信安全
Filebeat 能做什么
简单来说Filebeat就是数据的搬运工,只不过除了搬运还可以对数据作一些深加工,为业务增加一些附加值。
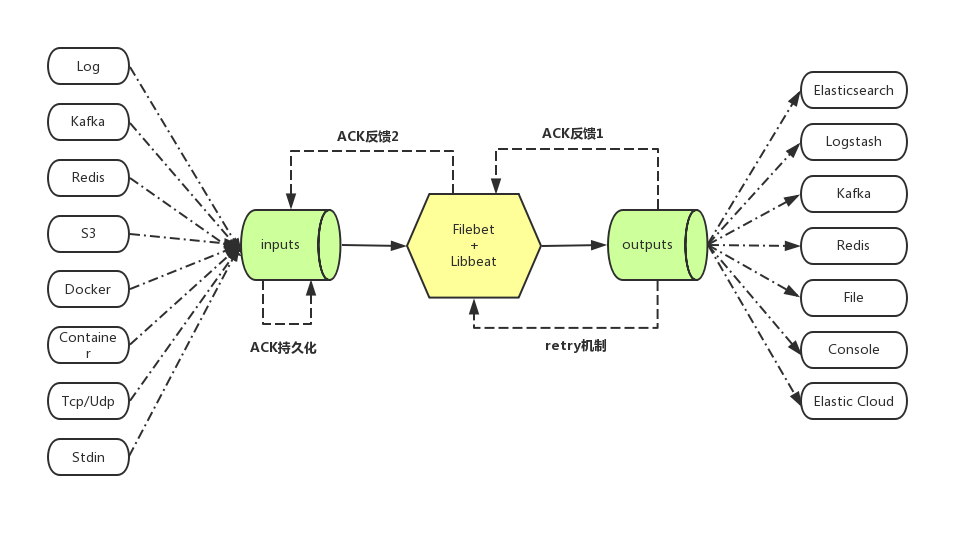
- Filebeat可以从多种不同的上游input 中接受需要收集的数据,其中我们最常用的就是 log input,即从日志中收集数据;
- Filebeat对收集来的数据进行加工,比如:多行合并,增加业务自定义字段,json等格式的encode;
- Filebeat将加工好的数据发送到被称为output的下游,其中我们最常用的就是 Elasticsearch 和 Kafka;
- Filebeat具有ACK反馈确认机制,即成功发送到output后,会将当前进度反馈给input, 这样在进程重启后可以断点续传;
- Filebeat在发送output失败后,会启动retry机制,和上一次ACK反馈确认机制一起,保证了每次消息至少发送一次的语义;
- Filebeat在发送output时,由于网络等原因发生阻塞,则在input上游端会减慢收集,自适应匹配下游output的状态。
安装配置启动
#安装方式解压缩
#配置文件,参考完整配置
	#多行合并
    multiline.pattern: '^\d{4}-\d{2}-\d{2}'
    multiline.negate: true
    multiline.match: after
#linux
./filebeat -e -c filebeat_linux.yml

#后台执行
nohup ./filebeat -e -c filebeat_linux.yml &
#windows
.\filebeat -e -c filebeat.yml

#windows下安装filebeats
1.PowerShell安装 Filebeat
此处只介绍 Windows 下面的安装,至于其他系统, 请参考: 官方文档

下载并解压后,有两种方式运行,一种是注册为 Windows 服务,另一种是直接通过命令行运行;下面分别介绍两种方式。

1.1 注册为 Windows 服务
前提:系统必须有 PowerShell,因为官方安装包中提供的脚本只能在 PowerShell 中运行,若是 win10 系统,可忽略,因为它已经自带了 PowerShell, 否则请下载 PowerShell 并安装。

下载安装包 点我下载.
解压到以下目录: C:\Program Files 。
重命名 filebeat-<version>-windows 为 Filebeat 。
以 管理员 身份运行 PowerShell 。
在 PowerShell 中运行以下命令:
cd 'C:\Program Files\Filebeat'
C:\Program Files\Filebeat> .\install-service-filebeat.ps1
注:
如果此处提示你没有权限,请运行以下的命令注册 Filebeat 服务 :
PowerShell.exe -ExecutionPolicy UnRestricted -File .\install-service-filebeat.ps1
1
2
3
到这,已经将 Filebeat 成功注册为系统服务,当下一次开机时它会自动启动,当然你也可以手动通过服务控制面板启动它。

2. 通过命令行运行 Filebeat
解压安装包,不需要安装,就可以用了
通过命令行运行 Filebeat 非常简单,只需将 Filebeat 文件解压到某个目录后,通过以下命令运行:

.\filebeat -e -c filebeat.yml
可参考:完整配置
###################### Filebeat Configuration Example #########################

# This file is an example configuration file highlighting only the most common
# options. The filebeat.reference.yml file from the same directory contains all the
# supported options with more comments. You can use it as a reference.
#
# You can find the full configuration reference here:
# https://www.elastic.co/guide/en/beats/filebeat/index.html

# For more available modules and options, please see the filebeat.reference.yml sample
# configuration file.

# ============================== Filebeat inputs ===============================

filebeat.inputs:

# Each - is an input. Most options can be set at the input level, so
# you can use different inputs for various configurations.
# Below are the input specific configurations.

- type: log

  # Change to true to enable this input configuration.
  enabled: true

  # Paths that should be crawled and fetched. Glob based paths.
  paths:
     - /usr/local/filebeat/filebeat_test_logs/*.log
     #- E:\Tools\ELK\logs\*.log
  # 日志多行合并采集
  #multiline.pattern: '^[[:space:]]+(at|\.{3})[[:space:]]+\b|^Caused by:'
  #multiline.negate: false
  #multiline.match: after
  multiline.pattern: '^\d{4}-\d{2}-\d{2}'
  multiline.negate: true
  multiline.match: after
  fields:
    logsource: SpingBoot1
  # 为每个项目标识,或者分组,可区分不同格式的日志
  tags: ["springboot1-logs"]
- type: log

  # Change to true to enable this input configuration.
  enabled: true

  # Paths that should be crawled and fetched. Glob based paths.
  paths:
    - /usr/local/filebeat/filebeat_test_logs/*.log
    #- E:\Tools\ELK\logs\*.log
  # 日志多行合并采集
  multiline.pattern: '^\d{4}-\d{2}-\d{2}'
  multiline.negate: true
  multiline.match: after
  fields:
    logsource: SpingBoot2
  # 为每个项目标识,或者分组,可区分不同格式的日志
  tags: ["springboot2-logs"]

  # Exclude lines. A list of regular expressions to match. It drops the lines that are
  # matching any regular expression from the list.
  #exclude_lines: ['^DBG']

  # Include lines. A list of regular expressions to match. It exports the lines that are
  # matching any regular expression from the list.
  #include_lines: ['^ERR', '^WARN']

  # Exclude files. A list of regular expressions to match. Filebeat drops the files that
  # are matching any regular expression from the list. By default, no files are dropped.
  #exclude_files: ['.gz$']

  # Optional additional fields. These fields can be freely picked
  # to add additional information to the crawled log files for filtering
  #fields:
  #  level: debug
  #  review: 1

  ### Multiline options

  # Multiline can be used for log messages spanning multiple lines. This is common
  # for Java Stack Traces or C-Line Continuation

  # The regexp Pattern that has to be matched. The example pattern matches all lines starting with [
  #multiline.pattern: ^\[

  # Defines if the pattern set under pattern should be negated or not. Default is false.
  #multiline.negate: false

  # Match can be set to "after" or "before". It is used to define if lines should be append to a pattern
  # that was (not) matched before or after or as long as a pattern is not matched based on negate.
  # Note: After is the equivalent to previous and before is the equivalent to to next in Logstash
  #multiline.match: after

# filestream is an experimental input. It is going to replace log input in the future.
#- type: filestream

 # Change to true to enable this input configuration.
 # enabled: false

 # Paths that should be crawled and fetched. Glob based paths.
 #paths:
 #   - /var/log/*.log
    #- c:\programdata\elasticsearch\logs\*

  # Exclude lines. A list of regular expressions to match. It drops the lines that are
  # matching any regular expression from the list.
  #exclude_lines: ['^DBG']

  # Include lines. A list of regular expressions to match. It exports the lines that are
  # matching any regular expression from the list.
  #include_lines: ['^ERR', '^WARN']

  # Exclude files. A list of regular expressions to match. Filebeat drops the files that
  # are matching any regular expression from the list. By default, no files are dropped.
  #prospector.scanner.exclude_files: ['.gz$']

  # Optional additional fields. These fields can be freely picked
  # to add additional information to the crawled log files for filtering
  #fields:
  #  level: debug
  #  review: 1

# ============================== Filebeat modules ==============================

filebeat.config.modules:
  # Glob pattern for configuration loading
  path: ${path.config}/modules.d/*.yml

  # Set to true to enable config reloading
  reload.enabled: false

  # Period on which files under path should be checked for changes
  #reload.period: 10s

# ======================= Elasticsearch template setting =======================

setup.template.settings:
  index.number_of_shards: 1
  #index.codec: best_compression
  #_source.enabled: false


# ================================== General ===================================

# The name of the shipper that publishes the network data. It can be used to group
# all the transactions sent by a single shipper in the web interface.
#name:

# The tags of the shipper are included in their own field with each
# transaction published.
#tags: ["service-X", "web-tier"]

# Optional fields that you can specify to add additional information to the
# output.
#fields:
#  env: staging

# ================================= Dashboards =================================
# These settings control loading the sample dashboards to the Kibana index. Loading
# the dashboards is disabled by default and can be enabled either by setting the
# options here or by using the `setup` command.
#setup.dashboards.enabled: false

# The URL from where to download the dashboards archive. By default this URL
# has a value which is computed based on the Beat name and version. For released
# versions, this URL points to the dashboard archive on the artifacts.elastic.co
# website.
#setup.dashboards.url:

# =================================== Kibana ===================================

# Starting with Beats version 6.0.0, the dashboards are loaded via the Kibana API.
# This requires a Kibana endpoint configuration.
#setup.kibana:

  # Kibana Host
  # Scheme and port can be left out and will be set to the default (http and 5601)
  # In case you specify and additional path, the scheme is required: http://localhost:5601/path
  # IPv6 addresses should always be defined as: https://[2001:db8::1]:5601
  #host: "localhost:5601"

  # Kibana Space ID
  # ID of the Kibana Space into which the dashboards should be loaded. By default,
  # the Default Space will be used.
  #space.id:

# =============================== Elastic Cloud ================================

# These settings simplify using Filebeat with the Elastic Cloud (https://cloud.elastic.co/).

# The cloud.id setting overwrites the `output.elasticsearch.hosts` and
# `setup.kibana.host` options.
# You can find the `cloud.id` in the Elastic Cloud web UI.
#cloud.id:

# The cloud.auth setting overwrites the `output.elasticsearch.username` and
# `output.elasticsearch.password` settings. The format is `<user>:<pass>`.
#cloud.auth:

# ================================== Outputs ===================================

# Configure what output to use when sending the data collected by the beat.

# ---------------------------- Elasticsearch Output ----------------------------
#output.elasticsearch:
  # Array of hosts to connect to.
#  hosts: ["localhost:9200"]

  # Protocol - either `http` (default) or `https`.
  #protocol: "https"

  # Authentication credentials - either API key or username/password.
  #api_key: "id:api_key"
  #username: "elastic"
  #password: "changeme"

# ------------------------------ Logstash Output -------------------------------
output.logstash:
  # The Logstash hosts
  hosts: ["xxx.xx.xxx.xxx:5044"]

  # Optional SSL. By default is off.
  # List of root certificates for HTTPS server verifications
  #ssl.certificate_authorities: ["/etc/pki/root/ca.pem"]

  # Certificate for SSL client authentication
  #ssl.certificate: "/etc/pki/client/cert.pem"

  # Client Certificate Key
  #ssl.key: "/etc/pki/client/cert.key"

# ================================= Processors =================================
processors:
  - add_host_metadata:
      when.not.contains.tags: forwarded
  - add_cloud_metadata: ~
  - add_docker_metadata: ~
  - add_kubernetes_metadata: ~

# ================================== Logging ===================================

# Sets log level. The default log level is info.
# Available log levels are: error, warning, info, debug
#logging.level: debug

# At debug level, you can selectively enable logging only for some components.
# To enable all selectors use ["*"]. Examples of other selectors are "beat",
# "publish", "service".
#logging.selectors: ["*"]

# ============================= X-Pack Monitoring ==============================
# Filebeat can export internal metrics to a central Elasticsearch monitoring
# cluster.  This requires xpack monitoring to be enabled in Elasticsearch.  The
# reporting is disabled by default.

# Set to true to enable the monitoring reporter.
#monitoring.enabled: false

# Sets the UUID of the Elasticsearch cluster under which monitoring data for this
# Filebeat instance will appear in the Stack Monitoring UI. If output.elasticsearch
# is enabled, the UUID is derived from the Elasticsearch cluster referenced by output.elasticsearch.
#monitoring.cluster_uuid:

# Uncomment to send the metrics to Elasticsearch. Most settings from the
# Elasticsearch output are accepted here as well.
# Note that the settings should point to your Elasticsearch *monitoring* cluster.
# Any setting that is not set is automatically inherited from the Elasticsearch
# output configuration, so if you have the Elasticsearch output configured such
# that it is pointing to your Elasticsearch monitoring cluster, you can simply
# uncomment the following line.
#monitoring.elasticsearch:

# ============================== Instrumentation ===============================

# Instrumentation support for the filebeat.
#instrumentation:
    # Set to true to enable instrumentation of filebeat.
    #enabled: false

    # Environment in which filebeat is running on (eg: staging, production, etc.)
    #environment: ""

    # APM Server hosts to report instrumentation results to.
    #hosts:
    #  - http://localhost:8200

    # API Key for the APM Server(s).
    # If api_key is set then secret_token will be ignored.
    #api_key:

    # Secret token for the APM Server(s).
    #secret_token:


# ================================= Migration ==================================

# This allows to enable 6.7 migration aliases
#migration.6_to_7.enabled: true
SSL加密通信
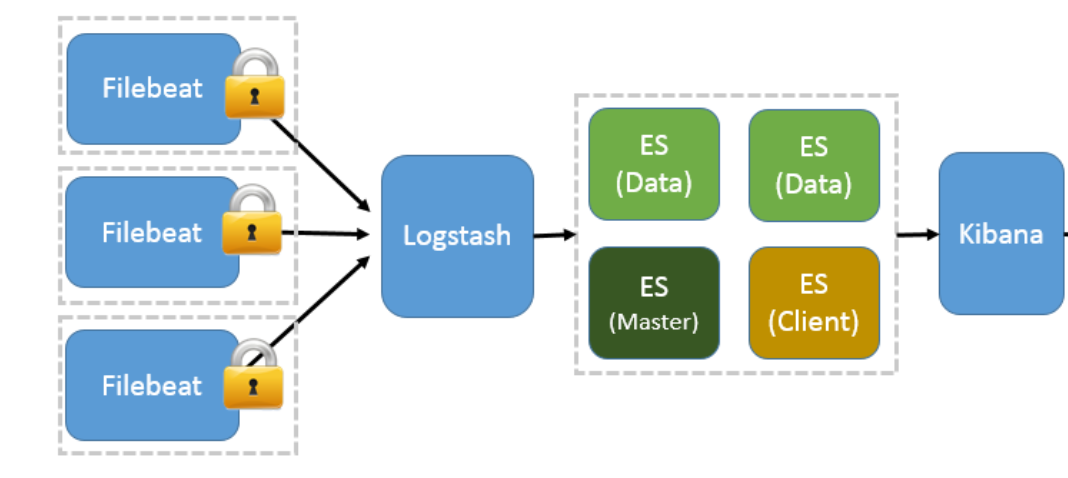
Filebeat与Logstash配置
1 制作自签的CA证书
#在Linux下,进入到Elasticsearch程序的部署家目录中,执行以下命令可以生成一份自签的CA证书:
cd /usr/share/elasticsearch/
./bin/elasticsearch-certutil ca
#使用默认输出文件名elastic-stack-ca.p12,并为证书设置访问口令。
xxxxxx
2 根据证书文件导出一份CA公钥文件,用于后续各应用配置文件中引用CA公钥时使用:
openssl pkcs12 -clcerts -nokeys -in elastic-stack-ca.p12 -out ca.pem
3制作Logstash Server证书
# --name为制作的证书名称,--dns为hosts文件解析后的地址,--ip为logstash程序所在主机ip
./bin/elasticsearch-certutil cert --ca elastic-stack-ca.p12 --name logstash --dns logstash --ip xxx.xx.xxx.xxx --pem --out logstash.zip
unzip logstash.zip # 解压后会各有一个.key和.crt后缀的文件
4 使用openssl转换出一份PKCS#8格式的密钥文件,即logstash.p8
cd logstash
openssl pkcs8 -in logstash.key -topk8 -nocrypt -out logstash.p8
#对于制作的logstash.crt的证书,可以使用以下命令查看证书中的信息:
openssl x509 -in logstash.crt -text
5 将证书文件部署到Logstash配置目录下
#假定我们部署Logstash的路径为/etc/logstash ,我们创建下面这样的证书存放目录certs,并把包括logstash证书和ca证书在内的文件部署于此。
mkdir -p /etc/logstash/certs
# 把ca.pem  logstash.crt  logstash.key  logstash.p8这四个文件拷贝到该目录下
ll /etc/logstash/certs
ca.pem  logstash.crt  logstash.key  logstash.p8
chmod 600 * # 安全起见,将以上文件权限调整为600
6 为Filebeat服务制作和配置数字证书
#回到刚才制作CA证书的地方,继续为Filebeat生成一份数字证书
./bin/elasticsearch-certutil cert --ca elastic-stack-ca.p12 --name filebeat  --dns filebeat --ip xxx.xx.xxx.xxx --pem --out filebeat.zip
unzip filebeat.zip

# 将得到的数字证书和密钥文件,以及ca证书文件,复制到Filebeat存储证书的路径下:
mkdir -p /etc/filebeat/certs
ll /etc/filebeat/certs
filebeat.crt  filebeat.key  ca.pem
chmod 600 * # 安全起见,将以上文件权限调整为600
7 配置Filebeat使用SSL
# 注意logstash的ip地址
output.logstash:
  hosts: ["192.168.75.21:5044"]
  ssl.certificate_authorities: ["/etc/filebeat/certs/ca.pem"]
  ssl.certificate: "/etc/filebeat/certs/filebeat.crt"
  ssl.key: "/etc/filebeat/certs/filebeat.key"

#Windows的配置
output.logstash:
  # The Logstash hosts
  hosts: ["xxx.xx.xxx.xxx:5044"]
  ssl.certificate_authorities: ["C:/Program Files/filebeat/certs/ca.pem"]
  ssl.certificate: "C:/Program Files/filebeat/certs/filebeat.crt"
  ssl.key: "C:/Program Files/filebeat/certs/filebeat.key"
8 配置Logstash在通过beats接收日志数据时使用SSL
input {
  beats {
    port => 5044
    codec => plain {
      charset => "UTF-8"
    }
    ssl => true
    ssl_certificate_authorities => ["/etc/logstash/certs/ca.pem"]
    ssl_certificate => "/etc/logstash/certs/logstash.crt"
    ssl_key => "/etc/logstash/certs/logstash.p8"
    ssl_verify_mode => "force_peer"
  }
}
配置 SSL、TLS 以及 HTTPS
来确保 Elasticsearch、Kibana、Beats 和 Logstash 的安全
官方宣布从6.8和7.1开始,免费提供多项安全功能。其中包括tls加密通信,基于角色访问控制等功能。
可以使用企业CA证书来完成这一步骤,但是一般情况下,我们可以通过elasticsearch自带的elasticsearch-certutil的命令生成证书。然后各节点通过该证书可以进行安全通信。
为节点创建证书
TLS:TLS协议要求Trusted Certificate Authority(CA)签发的X.509的证书
证书认证的不同级别
- Certificate:节点加入集群需要使用想用CA签发的证书
- Full Verfication:节点加入集群需要使用想用CA签发的证书,还需要验证Hostname或IP地址
- No Verfication:任何节点都可以加入,开发环境用于诊断目的
先签发CA证书,然后基于这个CA证书,签发每一个节点的证书
搭建好了es集群,先拿第一个节点来操作,进入elasticsearch目录,然后执行以下命令。
1 为Elasticsearch服务制作和配置数字证书
#文件根目录下执行
bin/elasticsearch-certutil ca
#依次输入回车(文件使用默认名),密码(xxxxxx)之后执行
bin/elasticsearch-certutil cert --ca elastic-stack-ca.p12
#依次输入上一个步骤的密码。回车(文件使用默认名),密码(建议与上一步密码相同)执行
bin/elasticsearch-keystore add xpack.security.transport.ssl.keystore.secure_password
#并输入第一步输入的密码执行
bin/elasticsearch-keystore add xpack.security.transport.ssl.truststore.secure_password
并输入第一步输入的密码将生成的
elastic-certificates.p12、elastic-stack-ca.p12文件mv到config目录下,
并连同elasticsearch.keystore 文件 scp到其他节点的config目录中。
注意:在本机生成的证书需要更改证书权限:chmod 644 elastic-certificates.p12 (若是使用运行es程序的用户创建证书,则不用更改证书权限)
默认证书权限是600,运行elasticsearch程序的用户没有权限读取,会造成elasticsearch启动失败
编辑配置文件,开启证书访问(此处配置是将证书文件复制到指定的certs目录下)
xpack.security.enabled: true
xpack.security.transport.ssl.enabled: true
xpack.security.transport.ssl.verification_mode: certificate # 证书认证级别
xpack.security.transport.ssl.keystore.path: /etc/elasticsearch/certs/elastic-certificates.p12
xpack.security.transport.ssl.truststore.path: /etc/elasticsearch/certs/elastic-certificates.p12
将上面步骤生成的elastic-certificates.p12证书复制到另外两个es节点上对应的config文件夹中,同时将配置选项也都复制到对应节点的elasticsearch.yml文件里
设置密码
启动三个节点,待节点启动完毕之后,进入第一个节点elasticsearch目录,执行以下命令,进行密码设置:
bin/elasticsearch-setup-passwords interactive
# 输出结果
Initiating the setup of passwords for reserved users elastic,apm_system,kibana,logstash_system,beats_system,remote_monitoring_user.
You will be prompted to enter passwords as the process progresses.
Please confirm that you would like to continue [y/N]y # 输入y

# 直接输入密码,然后再重复一遍密码,中括号里是账号
Enter password for [elastic]:
Reenter password for [elastic]:
Enter password for [apm_system]:
Reenter password for [apm_system]:
Enter password for [kibana]:
Reenter password for [kibana]:
Enter password for [logstash_system]:
Reenter password for [logstash_system]:
Enter password for [beats_system]:
Reenter password for [beats_system]:
Enter password for [remote_monitoring_user]:
Reenter password for [remote_monitoring_user]:
Changed password for user [apm_system]
Changed password for user [kibana]
Changed password for user [logstash_system]
Changed password for user [beats_system]
Changed password for user [remote_monitoring_user]
Changed password for user [elastic]
为了方便后续使用,这里可以都设置成一样
password: xxxxxxxx
验证集群设置的账号和密码
打开浏览器访问这个地址,出现需要输入账号密码的界面证明设置成功,集群的一个节点
http://xxx.xx.xxx.xxx:9200/_security/_authenticate?pretty
在kibana设置登录Elasticsearch账户
#在kibana.yml中配置
elasticsearch.username: "elastic"
elasticsearch.password: "xxxxxx"
kibana用户权限管理中可以配置新的用户及权限来管理logstash发送数据等到ElasticSearch
特定的用户所在角色可以设置操作不同索引的权限
#此处不新建用户及角色,使用默认的es用户密码,配置logstash的output
if [fields][logtype] ==  "ihcc-datamaker-logs" {
    elasticsearch {
    hosts => "xxx.xx.xxx.xxx:9200"
    index => "ihcc-datamaker-logs" #索引的名称根据日志的源类型,此处为filebeats中定义
    user => "elastic"
    password => "xxxxxx"
    }
 }
Packetbeat
网络数据包分析器Packetbeat是第一个引入的beat。 Packetbeat捕获服务器之间的网络流量,因此可用于应用程序和性能监视。
Packetbeat可以安装在受监视的服务器上,也可以安装在其专用服务器上。 Packetbeat跟踪网络流量,解码协议并记录每笔交易的数据。 Packetbeat支持的协议包括:DNS,HTTP,ICMP,Redis,MySQL,MongoDB,Cassandra等。理解像Packetbeat这样的网络数据包分析系统的价值的最佳方法是根据自己的流量进行尝试。更多信息,请参阅Elastic的官方网站 https://www.elastic.co/beats/packetbeat 。
安装配置启动
deb:
sudo apt-get install libpcap0.8
curl -L -O https://artifacts.elastic.co/downloads/beats/packetbeat/packetbeat-7.10.1-amd64.deb
sudo dpkg -i packetbeat-7.10.1-amd64.deb
rpm:
sudo yum install libpcap
sudo curl -L -O https://artifacts.elastic.co/downloads/beats/packetbeat/packetbeat-7.10.1-x86_64.rpm
sudo rpm -vi packetbeat-7.10.1-x86_64.rpm
mac
curl -L -O https://artifacts.elastic.co/downloads/beats/packetbeat/packetbeat-7.10.1-darwin-x86_64.tar.gz
tar xzvf packetbeat-7.10.1-darwin-x86_64.tar.gz
brew
brew tap elastic/tap
brew install elastic/tap/packetbeat-full
这将安装最新发行的Packetbeat默认发行版。 要安装OSS发行版,请指定elastic/tap/packetbeat-oss。
linux:
curl -L -O https://artifacts.elastic.co/downloads/beats/packetbeat/packetbeat-7.10.1-linux-x86_64.tar.gz
tar xzvf packetbeat-7.10.1-linux-x86_64.tar.gz
win
下载并安装实现libpcap接口的数据sniffing库,例如Npcap。
如果使用Npcap,请确保以WinPcap API兼容模式安装它。 如果您打算从loopback设备捕获流量(127.0.0.1流量),则还选择支持loopback流量的选项。
- 从下载页面下载Packetbeat Windows zip文件
- 将zip文件的内容提取到C:\Program Files
- 将packetbeat- <版本> -windows目录重命名为Packetbeat
- 以管理员身份打开PowerShell提示符(右键单击PowerShell图标,然后选择“以管理员身份运行”)。
在PowerShell提示符下,运行以下命令以将Packetbeat安装为Windows服务:
PS > cd 'C:\Program Files\Packetbeat'
PS C:\Program Files\Packetbeat> .\install-service-packetbeat.ps1
请注意:如果在系统上禁用了脚本执行,则需要为当前会话设置执行策略以允许脚本运行。 例如:
PowerShell.exe -ExecutionPolicy UnRestricted -File .\install-service-packetbeat.ps1
在使用Packetbeat之前,我们必须配置Packetbeat才可以使它正常工作。在Packetbeat的安装目录下,有一个叫做packetbeat.yml的配置文件(针对Linux的情况,它位于/etc/packetbeat/目录下)。在最简单的情况下,我们必须修改
output.elasticsearch:
  hosts: ["xxx.xx.xxx.xxx:9200"]
setup.kibana:
  host: "xxx.xx.xxx.xxx:5601"
我们需要把Elasticsearch及Kibana的地址填入到上面的位置。这样我们我们就可以把数据传入到Elasticsearch中,并在Kibana中的Dashboard中进行展示。更多的配置请参阅Elastic的官方文档“Configure Packetbeat”。
等修改完我们的packetbeat.yml文件后,我们可以使用如下的命令来检查修改后的文件是否正确:
sudo packetbeat test config -e
等配置完我们的Packetbeat,并配置完后我们运行如下的命令进行setup (Linux):
sudo packetbeat setup
接下来我们使用如下的命令来启动这个packetbeat的服务 (Linux):
sudo service packetbeat start
我们可以在Linux下查看这个服务:
systemctl status packetbeat
上面显示我们的packetbeat正在运行正常。
这个时候打开我们的Kibana,并选择Dashboard查看
ElasticSearch进阶配置
未完待续......

 浙公网安备 33010602011771号