
ELK 之二:ElasticSearch 和Logstash高级使用
一:文档
官方文档地址:1.x版本和2.x版本
https://www.elastic.co/guide/en/elasticsearch/guide/index.html
硬件要求:
1、内存,官方推荐64G,但是自己使用32G或16G也可以
2、CPU,核心越多越好
3、硬盘,越快越好,不建议使用NAS网络存储,官方建议使用RAID 0
4、网络,千兆或以上
5、JVM,建议使用比较新的版本,可以是openJDK或oracle的Java JDK
6、文件描述符,即可以打开的最大文件数,一定要改大
7、cluster 同一个集群要一样,集群被的各node name不能相同
8、组播和单播设置
9、JDK 内存设置不要超过32G,可以关闭Swap分区
10、锁住内存设置
动态改变配置:
PUT /_cluster/settings
{
    "persistent" : {
        "discovery.zen.minimum_master_nodes" : 2
    },
    "transient" : {
        "indices.store.throttle.max_bytes_per_sec" : "50mb"
    }
}
滚动升级或维护:
1、尽量不写新的数据,就不产生新的索引
2、关闭自动分片:
PUT /_cluster/settings
{
    "transient" : {
        "cluster.routing.allocation.enable" : "none"
    }
}
3、关闭当前节点:
停止后会在集群当中找其他的几点并提升为主节点,并将被停止的节点的分片分配给其他节点,并将数据同步到其他节点。
POST /_cluster/nodes/_local/_shutdown
4、执行升级或维护操作
5、重启节点,会自动加入到集群
6、开启当前节点的分片功能
注意:即分片同步需要一段时间,需要等待集群状态转换为绿色即集群可用状态。
Shard rebalancing may take some time. Wait until the cluster has returned to status green before continuing.
7、对集群当中的其他节点做2-6步骤的操作
数据备份--->快照备份:curl
1、创建备份目录,节点之间需要共享一个目录,共享的文件系统需要每个节点都可以访问,并且每个节点可挂载的路径要一致
支持的共享系统:
Shared filesystem, such as a NAS
Amazon S3
HDFS (Hadoop Distributed File System)
Azure Cloud
执行挂载目录的命令:
PUT _snapshot/my_backup
{
    "type": "fs",
    "settings": {
        "location": "/mount/backups/my_backup"
    }
}
2、创建快照:
POST _snapshot/my_backup/
{
    "type": "fs",
    "settings": {
        "location": "/mount/backups/my_backup",
        "max_snapshot_bytes_per_sec" : "50mb",
        "max_restore_bytes_per_sec" : "50mb"
    }
}
ELK的工作原理:
使用多播进行机器发现同一个集群内的节点,并汇总各个节点的返回组成一个集群,主节点要读取各个节点的状态,在关键的时候进行数据的恢复,主节点会坚持各个节点的状态,并决定每个分片的位置,通过ping的request检测各失效的节点
三:安装logstash:
官网下载地址:
https://www.elastic.co/downloads/logstash
1、安装:
tar xvf logstash-1.5.3.zip
mv logstash-1.5.3 /usr/local/logstash
2、测试:
[root@node6 ~]# /usr/local/logstash/bin/logstash -e 'input { stdin{} }  output { stdout{} }'
test
Logstash startup completed
2016-04-09T18:14:47.891Z node6.a.com test
3、使用ruby进行更详细的输出:
需要主机能解析自己的主机名,可以在hosts文件解析:
[root@node6 ~]# /usr/local/logstash/bin/logstash -e 'input { stdin{} }  output { stdout{codec => rubydebug}}'
asd
Logstash startup completed
{
       "message" => "asd",
      "@version" => "1",
    "@timestamp" => "2016-04-09T18:13:51.250Z",
          "host" => "node6.a.com"
}
4、通过logstas将输出交给elasticsearch:
启动:
[root@node6 ~]# /usr/local/logstash/bin/logstash -e 'input { stdin{} }  output {  elasticsearch { host => "192.168.10.206" protocol => "http"}  }'
'[DEPRECATED] use `require 'concurrent'` instead of `require 'concurrent_ruby'`
Logstash startup completed
5、通过logstash直接输出到屏幕:
#配置文件如下:
input {
        stdin{

        }
}

output {
  stdout { codec => rubydebug }
}
测试标准输出:
[root@elk-server2 conf.d]# /opt/logstash/bin/logstash -f /etc/logstash/conf.d/03.conf
       "message" => "{\"@timestamp\":\"2016-05-14T11:24:45+08:00\",\"host\":\"192.168.0.22\",\"clientip\":\"36.104.21.88\",\"size\":650,\"responsetime\":0.000,\"upstreamtime\":\"-\",\"upstreamhost\":\"-\",\"http_host\":\"webapi.weather.com.cn\",\"url\":\"/data/\",\"domain\":\"webapi.weather.com.cn\",\"xff\":\"-\",\"referer\":\"-\",\"status\":\"200\"}",
      "@version" => "1",
    "@timestamp" => "2016-05-14T03:25:04.068Z",
          "host" => "elk-server2"
6、输入一个hello word! 以进行测试:
[root@node6 ~]# /usr/local/logstash/bin/logstash -e 'input { stdin{} }  output {  elasticsearch { host => "192.168.10.206" protocol => "http"}  }'
'[DEPRECATED] use `require 'concurrent'` instead of `require 'concurrent_ruby'`
Logstash startup completed
hello word!
7、查看集群管理软件head的状态:
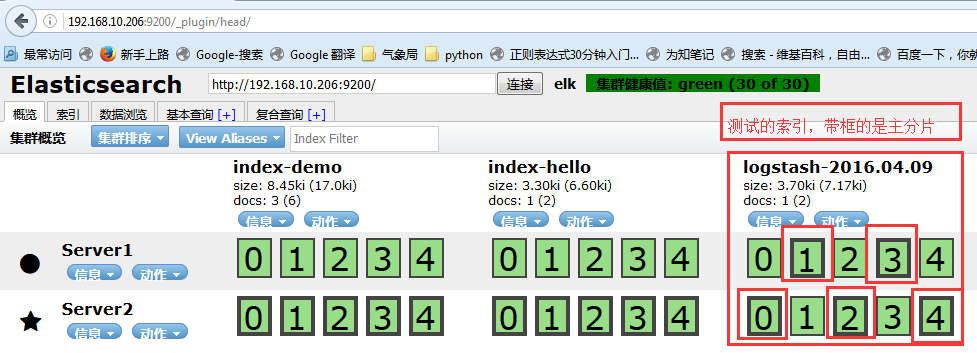
8、进行基本查询:

9、配置文件格式:
input {
  file {
    path => "/var/log/messages"
    type => "syslog"
  }

  file {
    path => "/var/log/apache/access.log"
    type => "apache"
  }
}
10、数组类型--->多个文件:
  path => [ "/var/log/messages", "/var/log/*.log" ] #通过*匹配多个文件
  path => "/data/mysql/mysql.log"
11、bool类型:
ssl_enable => true
12、字节设置:
  my_bytes => "1113"   # 1113 bytes
  my_bytes => "10MiB"  # 10485760 bytes
  my_bytes => "100kib" # 102400 bytes
  my_bytes => "180 mb" # 180000000 bytes
13、codec:
codec => "json"
14、Hash:
match => {
  "field1" => "value1"
  "field2" => "value2"
  ...
}
15、Number--->数字:
port => 33
16、Path--->密码:
my_password => "password"
17、Path---->路径:
my_path => "/tmp/logstash"
18、string-->字符串:
name => "Hello world"
四:logstash的input使用语法:
1、input,默认不支持目录的递归,即目录中还有文件是不支持直接读取的,但是可以使用*/*进行匹配。
2、exclude--->排除文件,
exclude => "*.gz"
3、sincedb_path,记录读取的时候位置,默认是一个隐藏文件
4、sincedb_write_interval,记录sincedb_path文件的写间隔,默认是15秒
5、start_position,从这个文件的什么位置开始读,默认是end,可以改成beginning
6、stat_interval,多久检测一次此文件的更新状态
五:logstash的output使用及插件:
1、可以输出到文件、rendis等
2、gzip,是否压缩,默认为false,压缩是安装数据流一点点增量压缩的
3、message_format,消息的格式
六:logstash --> file -->elasticsearch:
通过logstash输出到文件在输入到elasticsearch:
1、启动脚本:
vim /etc/init.d/logstash
[root@node6 tmp]# cat /etc/init.d/logstash
#!/bin/sh
# Init script for logstash
# Maintained by Elasticsearch
# Generated by pleaserun.
# Implemented based on LSB Core 3.1:
#   * Sections: 20.2, 20.3
#
### BEGIN INIT INFO
# Provides:          logstash
# Required-Start:    $remote_fs $syslog
# Required-Stop:     $remote_fs $syslog
# Default-Start:     2 3 4 5
# Default-Stop:      0 1 6
# Short-Description:
# Description:        Starts Logstash as a daemon.
### END INIT INFO

PATH=/sbin:/usr/sbin:/bin:/usr/bin:/usr/local/logstash/bin/
export PATH

if [ `id -u` -ne 0 ]; then
   echo "You need root privileges to run this script"
   exit 1
fi

name=logstash
pidfile="/var/run/$name.pid"

export JAVA_HOME=/opt/jdk1.8.0_45
export JRE_HOME=/opt/jdk1.8.0_45/jre
export CLASSPATH=.:$JAVA_HOME/lib/dt.jar:$JAVA_HOME/lib/tools.jar:$JRE_HOME/lib:$CLASSPATH
export PATH=$JAVA_HOME/bin:$PATH


LS_USER=root
LS_GROUP=root
LS_HOME=/usr/local/logstash
LS_HEAP_SIZE="512m"
LS_LOG_DIR=/usr/local/logstash
LS_LOG_FILE="${LS_LOG_DIR}/$name.log"
LS_CONF_DIR=/etc/logstash.conf
LS_OPEN_FILES=16384
LS_NICE=19
LS_OPTS=""


[ -r /etc/default/$name ] && . /etc/default/$name
[ -r /etc/sysconfig/$name ] && . /etc/sysconfig/$name

program=/usr/local/logstash/bin/logstash
args="agent -f ${LS_CONF_DIR} -l ${LS_LOG_FILE} ${LS_OPTS}"

quiet() {
  "$@" > /dev/null 2>&1
  return $?
}

start() {

  LS_JAVA_OPTS="${LS_JAVA_OPTS} -Djava.io.tmpdir=${LS_HOME}"
  HOME=${LS_HOME}
  export PATH HOME LS_HEAP_SIZE LS_JAVA_OPTS LS_USE_GC_LOGGING

  # chown doesn't grab the suplimental groups when setting the user:group - so we have to do it for it.
  # Boy, I hope we're root here.
  SGROUPS=$(id -Gn "$LS_USER" | tr " " "," | sed 's/,$//'; echo '')

  if [ ! -z $SGROUPS ]
  then
    EXTRA_GROUPS="--groups $SGROUPS"
  fi

  # set ulimit as (root, presumably) first, before we drop privileges
  ulimit -n ${LS_OPEN_FILES}

  # Run the program!
  nice -n ${LS_NICE} chroot --userspec $LS_USER:$LS_GROUP $EXTRA_GROUPS / sh -c "
    cd $LS_HOME
    ulimit -n ${LS_OPEN_FILES}
    exec \"$program\" $args
  " > "${LS_LOG_DIR}/$name.stdout" 2> "${LS_LOG_DIR}/$name.err" &

  # Generate the pidfile from here. If we instead made the forked process
  # generate it there will be a race condition between the pidfile writing
  # and a process possibly asking for status.
  echo $! > $pidfile

  echo "$name started."
  return 0
}

stop() {
  # Try a few times to kill TERM the program
  if status ; then
    pid=`cat "$pidfile"`
    echo "Killing $name (pid $pid) with SIGTERM"
    kill -TERM $pid
    # Wait for it to exit.
    for i in 1 2 3 4 5 ; do
      echo "Waiting $name (pid $pid) to die..."
      status || break
      sleep 1
    done
    if status ; then
      if [ "$KILL_ON_STOP_TIMEOUT" -eq 1 ] ; then
        echo "Timeout reached. Killing $name (pid $pid) with SIGKILL. This may result in data loss."
        kill -KILL $pid
        echo "$name killed with SIGKILL."
      else
        echo "$name stop failed; still running."
      fi
    else
      echo "$name stopped."
    fi
  fi
}

status() {
  if [ -f "$pidfile" ] ; then
    pid=`cat "$pidfile"`
    if kill -0 $pid > /dev/null 2> /dev/null ; then
      # process by this pid is running.
      # It may not be our pid, but that's what you get with just pidfiles.
      # TODO(sissel): Check if this process seems to be the same as the one we
      # expect. It'd be nice to use flock here, but flock uses fork, not exec,
      # so it makes it quite awkward to use in this case.
      return 0
    else
      return 2 # program is dead but pid file exists
    fi
  else
    return 3 # program is not running
  fi
}

force_stop() {
  if status ; then
    stop
    status && kill -KILL `cat "$pidfile"`
  fi
}

configtest() {
  # Check if a config file exists
  if [ ! "$(ls -A ${LS_CONF_DIR}/* 2> /dev/null)" ]; then
    echo "There aren't any configuration files in ${LS_CONF_DIR}"
    return 1
  fi

  HOME=${LS_HOME}
  export PATH HOME JAVA_OPTS LS_HEAP_SIZE LS_JAVA_OPTS LS_USE_GC_LOGGING

  test_args="-f ${LS_CONF_DIR} --configtest ${LS_OPTS}"
  $program ${test_args}
  [ $? -eq 0 ] && return 0
  # Program not configured
  return 6
}

case "$1" in
  start)
    status
    code=$?
    if [ $code -eq 0 ]; then
      echo "$name is already running"
    else
      start
      code=$?
    fi
    exit $code
    ;;
  stop) stop ;;
  force-stop) force_stop ;;
  status)
    status
    code=$?
    if [ $code -eq 0 ] ; then
      echo "$name is running"
    else
      echo "$name is not running"
    fi
    exit $code
    ;;
  restart)
    quiet configtest
    RET=$?
    if [ ${RET} -ne 0 ]; then
      echo "Configuration error. Not restarting. Re-run with configtest parameter for details"
      exit ${RET}
    fi
    stop && start
    ;;
  configtest)
    configtest
    exit $?
    ;;
  *)
    echo "Usage: $SCRIPTNAME {start|stop|force-stop|status|restart|configtest}" >&2
    exit 3
  ;;
esac

exit $?
2、设置开机启动:
chmod  a+x /etc/init.d/logstash
chkconfig  --add logstash
3、编辑配置文件:
[root@node6 tmp]# vim /etc/logstash.conf
input {
        file {
                path =>  "/var/log/messages"
        }
}


output {
        file {
                path => "/tmp/log-%{+YYYY-MM-dd}messages.gz"
                gzip => true
        }
}
4、测试:
[root@node6 tmp]# echo "Apr 12 14:03:53 HTC-Server2 snmpd[1573]: Connection from UDP: [60.195.252.107]:31001->[192.168.0.116]" >> /var/log/messages
测试结果:
[root@node6 tmp]# ls  /tmp/
hsperfdata_root  log-2016-04-09.messages.gz
5、把输出直接传输到elasticsearch:
[root@node6 ~]# vim /etc/logstash.conf
input {
        file {
                path =>  "/var/log/messages"
        }
}


output {
        file {
                path => "/tmp/log-%{+YYYY-MM-dd}.messages.gz"
                gzip => true
        }

        elasticsearch {
                host => ["192.168.10.206"]
                protocol => "http"
                index => "system-message-%{+YYYY.MM.dd}"
        }
}
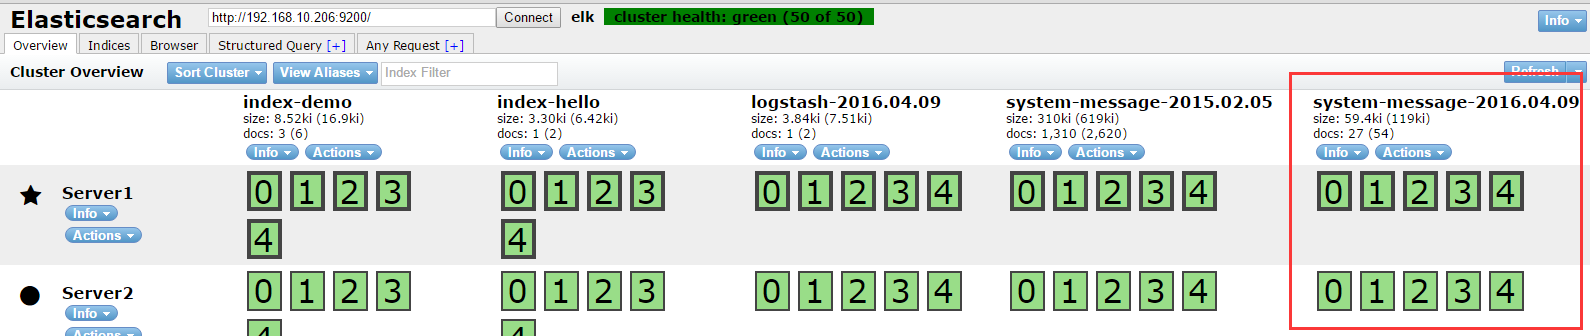
6、在集群管理平台查看结果:
七:将logstash输出给redis:
1、基本语法:
db:使用的数据库,默认为0,也可以使用其他的,但是redis主从不支持其他数据库同步。
host: redis服务器的地址
key:key的名称
password:redis服务器的redis连接密码
port:redis端口,默认6379
data_type:数据类型,支持string和list,我们使用list
2、重启logstash
3、向logstash监控的文件写入数据
[root@node6 yum.repos.d]# echo "Apr 12 14:03:53 HTC-Server2 snmpd[1573]: Connection from UDP: [60.195.252.107]:31001->[192.168.0.116]" >>  /var/log/messages
[root@node6 yum.repos.d]# echo "Apr 12 14:03:53 HTC-Server2 snmpd[1573]: Connection from UDP: [60.195.252.107]:31001->[192.168.0.116]" >>  /var/log/messages
[root@node6 yum.repos.d]# echo "Apr 12 14:03:53 HTC-Server2 snmpd[1573]: Connection from UDP: [60.195.252.107]:31001->[192.168.0.116]" >>  /var/log/messages
[root@node6 yum.repos.d]# echo "Apr 12 14:03:53 HTC-Server2 snmpd[1573]: Connection from UDP: [60.195.252.107]:31001->[192.168.0.116]" >>  /var/log/messages
[root@node6 yum.repos.d]# echo "Apr 12 14:03:53 HTC-Server2 snmpd[1573]: Connection from UDP: [60.195.252.107]:31001->[192.168.0.116]" >>  /var/log/messages
[root@node6 yum.repos.d]# echo "Apr 12 14:03:53 HTC-Server2 snmpd[1573]: Connection from UDP: [60.195.252.107]:31001->[192.168.0.116]" >>  /var/log/messages
4、到redis查看结果:
[root@node5 ~]# redis-cli
127.0.0.1:6379> KEYS *
1) "system-message-jack" #已经生成数据
127.0.0.1:6379> LLEN  system-message-jack #查看key的长度
(integer) 681
127.0.0.1:6379> LINDEX system-message-jack -1  #查看最后一行数据
"{\"message\":\"Apr 12 14:03:53 HTC-Server2 snmpd[1573]: Connection from UDP: [60.195.252.107]:31001->[192.168.0.116]\",\"@version\":\"1\",\"@timestamp\":\"2016-04-12T08:37:51.025Z\",\"host\":\"node6.a.com\",\"path\":\"/var/log/messages\"}"
5、在重新找一台机器安装logstash,步骤参考之前的步骤:
6、另外一台logstash的配置文件:
input {   #读取redis的数据
    redis {
        data_type => "list"
        key => "system-message-jack"
        host => "192.168.10.205"
        port => "6379"
        db => "0"
    }
}


output {  #将读取到的reids的数据写入到elasticsearch
    elasticsearch {
        host => ["192.168.10.206"]
        protocol => "http"
        index => "redis-message-%{+YYYY.MM.dd}"
    }
}
7、向message文件写入数据,写入的数据会读取到redis,reids的数据则会被传输给
[root@node6 yum.repos.d]# echo "Apr 12 14:03:53 HTC-Server2 snmpd[1573]: Connection from UDP: [60.195.252.107]:31001->[192.168.0.116]" >>  /var/log/messages
[root@node6 yum.repos.d]# echo "Apr 12 14:03:53 HTC-Server2 snmpd[1573]: Connection from UDP: [60.195.252.107]:31001->[192.168.0.116]" >>  /var/log/messages
[root@node6 yum.repos.d]# echo "Apr 12 14:03:53 HTC-Server2 snmpd[1573]: Connection from UDP: [60.195.252.107]:31001->[192.168.0.116]" >>  /var/log/messages
[root@node6 yum.repos.d]# echo "Apr 12 14:03:53 HTC-Server2 snmpd[1573]: Connection from UDP: [60.195.252.107]:31001->[192.168.0.116]" >>  /var/log/messages
8、在集群管理平台查看:

9、 查看索引:

八:分析的日志类型:
1、系统日志:/var/log下的所有的内容,google每一个文件的内容
2、通过ELS分析某一个访问记录
3、错误日志,收集后反馈给开发
4、系统运行日志
5、其他类型的日志
九:日志的字段划分:
1、grok模块:通过正则表达式,比较复杂,而且当数据大的时候会占用CPU
2、json,简单易用
3、将nginx的日志设置为json模式:
安装nginx:可以编译或yum安装,省略
4、日志配置部分:
http {
    include       /etc/nginx/mime.types;
    default_type  application/octet-stream;

   # log_format  main  '$remote_addr - $remote_user [$time_local] "$request" '
   #                   '$status $body_bytes_sent "$http_referer" '
   #                   '"$http_user_agent" "$http_x_forwarded_for"';

    #access_log  /var/log/nginx/access.log  main;

    log_format logstash_json '{"@timestamp":"$time_iso8601",' #定义日志格式logstash_json
        '"host":"$server_addr",'
        '"clientip":"$remote_addr",'
        '"size":$body_bytes_sent,'
        '"responsetime":$request_time,'
        '"upstreamtime":"$upstream_response_time",'
        '"upstreamhost":"$upstream_addr",'
        '"http_host":"$host",'
        '"url":"$uri",'
        '"domain":"$host",'
        '"xff":"$http_x_forwarded_for",'
        '"referer":"$http_referer",'
        '"agent":"$http_user_agent",'
        '"status":"$status"}';


    sendfile        on;

serevr配置:
#
server {
    listen       9009;
    server_name  localhost;

    #charset koi8-r;

    access_log  /var/log/nginx/json.access.log  logstash_json;  #日志文件保存路径及使用上面定义的日志格式logstash_json
    # Load configuration files for the default server block.
    include /etc/nginx/default.d/*.conf;

    location / {
        root   /usr/share/nginx/html;
        index  index.html index.htm;
    }

    error_page  404              /404.html;
    location = /404.html {
        root   /usr/share/nginx/html;
    }

    # redirect server error pages to the static page /50x.html
    #
    error_page   500 502 503 504  /50x.html;
    location = /50x.html {
        root   /usr/share/nginx/html;
    }
5、使用ab访问nginx测试日志:
[root@node5 nginx]# ab -n1000 -c10 http://192.168.10.205:9009/ #一共1000个请求,每次并发10个,即100次请求完成
6、查看日志是否有内容:
[root@node5 nginx]# tail /var/log/nginx/json.access.log
{"@timestamp":"2016-04-12T18:21:31+08:00","host":"192.168.10.205","clientip":"192.168.10.205","size":3698,"responsetime":0.000,"upstreamtime":"-","upstreamhost":"-","http_host":"192.168.10.205","url":"/index.html","domain":"192.168.10.205","xff":"-","referer":"-","agent":"ApacheBench/2.3","status":"200"}
{"@timestamp":"2016-04-12T18:21:31+08:00","host":"192.168.10.205","clientip":"192.168.10.205","size":3698,"responsetime":0.000,"upstreamtime":"-","upstreamhost":"-","http_host":"192.168.10.205","url":"/index.html","domain":"192.168.10.205","xff":"-","referer":"-","agent":"ApacheBench/2.3","status":"200"}
{"@timestamp":"2016-04-12T18:21:31+08:00","host":"192.168.10.205","clientip":"192.168.10.205","size":3698,"responsetime":0.000,"upstreamtime":"-","upstreamhost":"-","http_host":"192.168.10.205","url":"/index.html","domain":"192.168.10.205","xff":"-","referer":"-","agent":"ApacheBench/2.3","status":"200"}
{"@timestamp":"2016-04-12T18:21:31+08:00","host":"192.168.10.205","clientip":"192.168.10.205","size":3698,"responsetime":0.000,"upstreamtime":"-","upstreamhost":"-","http_host":"192.168.10.205","url":"/index.html","domain":"192.168.10.205","xff":"-","referer":"-","agent":"ApacheBench/2.3","status":"200"}
{"@timestamp":"2016-04-12T18:21:31+08:00","host":"192.168.10.205","clientip":"192.168.10.205","size":3698,"responsetime":0.001,"upstreamtime":"-","upstreamhost":"-","http_host":"192.168.10.205","url":"/index.html","domain":"192.168.10.205","xff":"-","referer":"-","agent":"ApacheBench/2.3","status":"200"}
{"@timestamp":"2016-04-12T18:21:31+08:00","host":"192.168.10.205","clientip":"192.168.10.205","size":3698,"responsetime":0.000,"upstreamtime":"-","upstreamhost":"-","http_host":"192.168.10.205","url":"/index.html","domain":"192.168.10.205","xff":"-","referer":"-","agent":"ApacheBench/2.3","status":"200"}
{"@timestamp":"2016-04-12T18:21:31+08:00","host":"192.168.10.205","clientip":"192.168.10.205","size":3698,"responsetime":0.000,"upstreamtime":"-","upstreamhost":"-","http_host":"192.168.10.205","url":"/index.html","domain":"192.168.10.205","xff":"-","referer":"-","agent":"ApacheBench/2.3","status":"200"}
{"@timestamp":"2016-04-12T18:21:31+08:00","host":"192.168.10.205","clientip":"192.168.10.205","size":3698,"responsetime":0.000,"upstreamtime":"-","upstreamhost":"-","http_host":"192.168.10.205","url":"/index.html","domain":"192.168.10.205","xff":"-","referer":"-","agent":"ApacheBench/2.3","status":"200"}
{"@timestamp":"2016-04-12T18:21:31+08:00","host":"192.168.10.205","clientip":"192.168.10.205","size":3698,"responsetime":0.000,"upstreamtime":"-","upstreamhost":"-","http_host":"192.168.10.205","url":"/index.html","domain":"192.168.10.205","xff":"-","referer":"-","agent":"ApacheBench/2.3","status":"200"}
{"@timestamp":"2016-04-12T18:21:31+08:00","host":"192.168.10.205","clientip":"192.168.10.205","size":3698,"responsetime":0.000,"upstreamtime":"-","upstreamhost":"-","http_host":"192.168.10.205","url":"/index.html","domain":"192.168.10.205","xff":"-","referer":"-","agent":"ApacheBench/2.3","status":"200"}
7、配置logstash手机nginx的json日志并写入到redis:
[root@node5 logstash]# cat /etc/logstash.conf
input {
#    redis {
#        data_type => "list"
#        key => "system-message-jack"
#        host => "192.168.10.205"
#        port => "6379"
#        db => "0"
#    }

    file {
        path => "/var/log/nginx/json.access.log" #读取指定的json格式的日志
        codec => "json" #指定json格式
    }

}


output {
#    elasticsearch {
#        host => ["192.168.10.206"]
#        protocol => "http"
#        index => "redis-message-%{+YYYY.MM.dd}"
#    }
    redis {
        data_type => "list"
        key => "nginx-json-log" #nginx的json格式日志的key名称
        host => "192.168.10.205" #写入到redis服务器
        port => "6379"
        db => "1" #使用redis的数据库1
    }
}
8、重启logstash服务,并使用ab重新访问web地址,以产生新的日志写入redis:
[root@node5 nginx]# ab -n1000 -c10 http://192.168.10.205:9009/
9、在redis查询是否有当前key的日志:
[root@node5 nginx]# redis-cli
127.0.0.1:6379> SELECT 1
OK
127.0.0.1:6379[1]> KEYS *
1) "nginx-json-log"  #已有日志
127.0.0.1:6379[1]> LLEN nginx-json-log  #日志长度
(integer) 1000
10、配置logstash当前redis日志并输出至elasticsearch:
[root@node5 nginx]# grep "#" -v  /etc/logstash.conf
input {
    redis {
        data_type => "list"
        key => "nginx-json-log"
        host => "192.168.10.205"
        port => "6379"
        db => "1"
    }
}

output {
    elasticsearch {
        host => ["192.168.10.206"]
        protocol => "http"
        index => "nginx-json-log-%{+YYYY.MM.dd}"
    }
}
11、重启logstash并使用ab批量访问web,再查看elasticsearch集群管理界面是否有nginx的json定义的nginx-json-log的key出现:


 浙公网安备 33010602011771号