ELK日志套件安装与使用
1、ELK介绍
ELK不是一款软件,而是elasticsearch+Logstash+kibana三款开源软件组合而成的日志收集处理套件,堪称神器。其中Logstash负责日志收集,elasticsearch负责日志的搜索、统计,而kibana则是ES的展示神器,前端炫丽,点几下鼠标简单配置,就可以完成搜索、聚合功能,生成华丽的报表。
目前我们的日志方案:
- flume负责收集,服务写日志到文件,flume收集日志文件
- flume汇总到数据通道kafka,供其他服务消费
- 日志搜索:从kafka读取日志写入到solr cloud提供搜索
- 日志统计:将kafka的日志写到hdfs,使用spark、hive来做统计
- 日志展示:开发的java-web,读取数据库生成统计报表
当前日志方案问题分析:
- 需要预先编程才能使用,开发工作量大
- 不够灵活,新需求需要改代码
- 离线统计,实时性不高
- 未提供基于搜索结果的统计功能
- 系统方案较为复杂,需要了解多项技术,学习维护成本高
- ……
- 新增需求都是泪,开发出来后变动很少
通过调研ELK,发现真是解救目前问题的一个神器,大部分问题都可以迎刃而解。
2、ELK安装
默认需要先安装jdk1.8,自行安装即可
2.1、安装ES
2.1.1 下载ES
下载地址:https://www.elastic.co/downloads/elasticsearch
最新版本是2.28发布的5.2.2版本

windows选择ZIP,linux选择tar,ubuntu选择DEB
测试服务器是ubuntu,直接下载deb包,然后安装即可
wget https://artifacts.elastic.co/downloads/elasticsearch/elasticsearch-5.2.2.deb
sudo dpkg -i elasticsearch-5.2.2.deb
2.1.2 配置
如果使用deb包安装的,配置文件路径如下:
|
类型 |
描述 |
默认路经 |
Setting |
|
home |
Elasticsearch home directory or $ES_HOME |
/usr/share/elasticsearch |
|
|
bin |
Binary scripts including elasticsearch to start a node and elasticsearch-plugin to install plugins |
/usr/share/elasticsearch/bin |
|
|
conf |
Configuration files including elasticsearch.yml |
/etc/elasticsearch |
path.conf |
|
conf |
Environment variables including heap size, file descriptors. |
/etc/default/elasticsearch |
|
|
data |
The location of the data files of each index / shard allocated on the node. Can hold multiple locations. |
/var/lib/elasticsearch |
path.data |
|
logs |
Log files location. |
/var/log/elasticsearch |
path.logs |
|
plugins |
Plugin files location. Each plugin will be contained in a subdirectory. |
/usr/share/elasticsearch/plugins |
|
|
repo |
Shared file system repository locations. Can hold multiple locations. A file system repository can be placed in to any subdirectory of any directory specified here. |
Not configured |
path.repo |
|
script |
Location of script files. |
/etc/elasticsearch/scripts |
path.scripts |
修改/etc/elasticsearch/elasticsearch.yml即可
测试使用,主要设置网络:
network.host: 192.168.86.108

http.port: 9200
ES的集群配置比较方便,设置cluster.name就可以:
cluster.name: es-log
2.1.3 启动ES
由于我们使用的deb安装的,因此可以用服务方式启动:
service elasticsearch start
如果使用的压缩包,执行 bin/elasticsearch (or bin\elasticsearch.bat on Windows)即可
然后,打开 curl http://192.168.86.108:9200/ 测试(ip换成配置的ip)
2.2 安装 Logstash
现在收集处理框架非常多,像 facebook 出品的scribe ,apache 基金会的亲儿子flume,Logstash也是一个非常出名的日志框架,使用jruby开发,可以运行在jvm之上实现跨平台,具体的介绍可以到官网http://logstash.net查看。
Logstash安装比较简单,下载压缩包、解压、配置,启动即可。
2.2.1 下载安装
wget https://artifacts.elastic.co/downloads/logstash/logstash-5.2.2.tar.gz

tar zxvf logstash-5.2.2.tar.gz

ln -s logstash-5.2.2 logstash
2.2.2 配置
Logstash 和flume比较类似,有input和output的概念。不过logstash社区通常习惯用 shipper,broker 和 indexer 来描述数据流中不同进程各自的角色。

我们来看怎么配置logstash。
创建一个配置文件nginxlog2es.conf,读取nginx日志,输出到elasticsearch 。具体的配置格式参见官方文档。
input {
    file {
        path => "/var/log/nginx/access.log_json"
        codec => "json"
    }
}
filter {
    mutate {
        split => [ "upstreamtime", "," ]
    }
    mutate {
        convert => [ "upstreamtime", "float" ]
    }
}
output {
  stdout { codec => rubydebug }
  elasticsearch {
        hosts => ["192.168.86.108:9200"]
        index => "logstash-%{type}-%{+YYYY.MM.dd}"
        document_type => "%{type}"
        flush_size => 20000
        idle_flush_time => 10
        sniffing => true
        template_overwrite => true
    }
}
这里简单说明下,input是file类型,/var/log/nginx/access.log_json每行是一个json数据,codec => "json"指定按json解析。
output 配置了两个,stdout 是控制台输出,elasticsearch 则是输出到前面配置的es服务器,index 索引名称为logstash-nginx-日期,这样每天为一个索引。
Nginx 直接生成json日志可以通过指定logformat,拼接为json:
配置logformat:
log_format json '{"@timestamp":"$time_iso8601",'

'"host":"$server_addr",'

'"clientip":"$remote_addr",'

'"size":$body_bytes_sent,'

'"responsetime":$request_time,'

'"upstreamtime":"$upstream_response_time",'

'"upstreamhost":"$upstream_addr",'

'"http_host":"$host",'

'"url":"$uri",'

'"xff":"$http_x_forwarded_for",'

'"referer":"$http_referer",'

'"agent":"$http_user_agent",'

'"status":"$status"}';
然后使用:
access_log /var/log/nginx/access.log_json json;
这样nginx的日志就变为:

2.2.3 启动logstash
使用-f指定配置文件
bin/logstash -f nginxlog2es.conf
启动成功后就能看到收集到的日志:

2.3 kibana
2.3.1 安装
kibana安装也比较简单,下载,解压,配置即可
wget https://artifacts.elastic.co/downloads/kibana/kibana-5.2.2-linux-x86_64.tar.gz
解压后建立软连接
ln -s kibana-5.2.2-linux-x86_64 kibana
cd kibana
修改配置文件
vim config/kibana.yml
修改
server.host: "192.168.86.108"
elasticsearch.url: "http://192.168.86.108:9200"
然后启动:
bin/kibana

2.3.2 配置报表
启动后打开http://192.168.86.108:5601,就能看到日志了,在输入框里还可以输入关键词进行搜索,并且自带流量统计。

下面来看如何生成报表,比如搞个响应时间折线图,进入visualize,选择折线图

分别配置X和y轴,Y为平均响应时间,X为时间,最后保存即可。

再来配置一个表格报表,通产各个url的访问量
Metrics 配置使用count作为聚合函数

buckets增加rows,字段选url
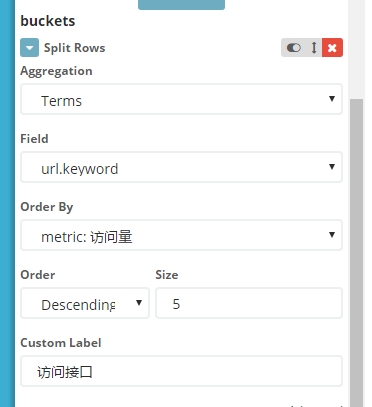
再增加一个状态码:

这样就完成了一个漂亮的表格

2.3.3 将报表添加到dashboard
在dashboard点add,将两个报表加入即可

3、总结
简单的介绍就到这里为止了,更多的功能后面继续挖掘。
总结下,借助ELK可以快速搭建日志收集、日志搜索和统计分析平台,可以不写一行代码完成漂亮的统计报表,简直是开发和运维的福音,是不是心动了?如果是,快行动起来吧!

 浙公网安备 33010602011771号