web计时机制——performance对象
前面的话
页面性能一直都是Web开发人员比较关注的领域。但在实际应用中,度量页面性能的指标,是javascript的Date对象。Web Timing API改变了这个局面,让开发人员通过javascript就能使用浏览器内部的度量结果,给出了页面加载和渲染过程的很多信息,对性能优化非常有价值。本文将详细介绍web Timing API——performance对象
简述
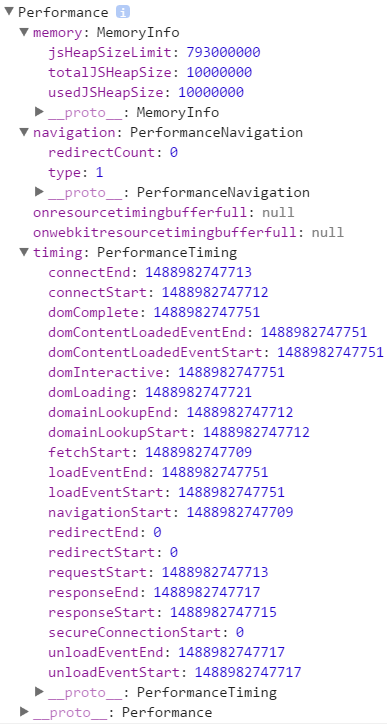
Web计时机制的核心是window.performance对象。对页面的所有度量信息,包括那些规范中已经定义的和将来才能确定的,都包含在这个对象里面。performance对象包括navigation和timing对象,以及chrome扩展的memory对象,还包括getEntries()和now()两个方法
值得高兴的是,低版本IE也支持performance对象
memory
memory属性是chrome扩展的对象,只有chrome浏览器支持,包含以下三个属性:
jsHeapSizeLimit表示内存大小限制
totalJSHeapSize表示可使用的内存
usedJSHeapSize表示javascript对象占用的内存
/*
jsHeapSizeLimit: 793000000
totalJSHeapSize: 10000000
usedJSHeapSize: 10000000
 */
console.log(performance.memory);
navigation
performance.navigation属性是一个对象,包含着与页面导航有关的redirectCount和type这两个属性
其中redirectCount表示页面加载前的重定向次数;而type是一个数值常量,表示刚刚发生的导航类型,type有以下取值
performance.navigation.TYPE_NAVTGATE(0):页面第一次加载
performance.navigation.TYPE_RELOAD(1):页面重载过
performance.navigation.TYPE_BACK_FORWARD(2):页面是通过“后退”或“前进”按钮打开的
console.log(window.performance.navigation.redirectCount);//0
console.log(window.performance.navigation.type);//1
timing
performance.timing属性也是一个对象,但这个对象的属性都是时间戳,不同的事件会产生不同的时间值
下图显示了一个请求发出的整个过程中,各种环节的时间顺序
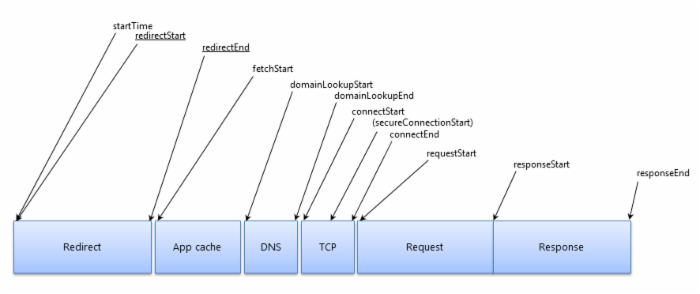
下面按照时间顺序对timing对象的各个属性进行说明
navigationStart:开始导航到当前页面的时间,即在地址栏输入地址后按下回车时的时间
var navigationStart = performance.timing.navigationStart;
//1488984540668
console.log(navigationStart);

//Wed Mar 08 2017 22:49:44 GMT+0800 (中国标准时间)
console.log(new Date(new Date(navigationStart)));
redirectStart:到当前页面的重定向开始的时间。但只有在重定向的页面来自同一个域时这个属性才会有值;否则,值为0
redirectEnd:到当前页面的重定向结束的时间。但只有在重定向的页面来自同一个域时这个属性才会有值;否则,值为0
console.log(performance.timing.redirectStart);//0
console.log(performance.timing.redirectEnd);//0
fetchStart:开始通过HTTP GET取得页面的时间
console.log(performance.timing.fetchStart);//1488984540668
domainLookupStart:开始査询当前页面DNS的时间,如果使用了本地缓存或持久连接,则与fetchStart值相等
domainLookupEnd:査询当前页面DNS结束的时间,如果使用了本地缓存或持久连接,则与fetchStart值相等
console.log(performance.timing.domainLookupStart);//1488984540670
console.log(performance.timing.domainLookupEnd);//1488984540671
connectStart:浏览器尝试连接服务器的时间
secureConnectionStart:浏览器尝试以SSL方式连接服务器的时间。不使用SSL方式连接时,这个属性的值为0
connectEnd:浏览器成功连接到服务器的时间
console.log(performance.timing.connectStart);//1488984540671
console.log(performance.timing.secureConnectionStart);//0
console.log(performance.timing.connectEnd);//1488984540719
requestStart:浏览器开始请求页面的时间
responseStart:浏览器接收到页面第一字节的时间
responseEnd:浏览器接收到页面所有内容的时间
console.log(performance.timing.requestStart);//1488984540720
console.log(performance.timing.responseStart);//1488984540901
console.log(performance.timing.responseEnd);//1488984540902
unloadEventStart:前一个页面的unload事件开始的时间。但只有在前一个页面与当前页面来自同一个域时这个属性才会有值;否则,值为0
unloadEventEnd:前一个页面的unload事件结束的时间。但只有在前一个页面与当前页面来自同一个域时这个属性才会有值;否则,值为0
console.log(performance.timing.unloadEventStart);//1488984540902
console.log(performance.timing.unloadEventEnd);//1488984540903
domLoading:document.readyState变为"loading"的时间,即开始解析DOM树的时间
domInteractive:document.readyState变为"interactive"的时间,即完成完成解析DOM树的时间
domContentLoadedEventStart:发生DOMContentloaded事件的时间,即开始加载网页内资源的时间
domContentLoadedEventEnd:DOMContentLoaded事件已经发生且执行完所有事件处理程序的时间,网页内资源加载完成的时间
domComplete:document.readyState变为"complete"的时间,即DOM树解析完成、网页内资源准备就绪的时间
console.log(performance.timing.domLoading);//1488984540905
console.log(performance.timing.domInteractive);//1488984540932
console.log(performance.timing.domContentLoadedEventStart);//1488984540932
console.log(performance.timing.domContentLoadedEventEnd);//1488984540932
console.log(performance.timing.domComplete);//1488984540932
loadEventStart:发生load事件的时间,也就是load回调函数开始执行的时间
loadEventEnd:load事件已经发生且执行完所有事件处理程序的时间
console.log(performance.timing.loadEventStart);//1488984540933
console.log(performance.timing.loadEventEnd);//1488984540933
[注意]在实际情况下,通过performance.timing属性可以找到domInteractive、domContentLoadedEventStart、domContentLoadedEventEnd、domComplete、loadEventStart和loadEventEnd这6个值。但是在单独获取的情况下,这6个值都为0
/*
connectEnd:1488989686331
connectStart:1488989686330
domComplete:1488989686395
domContentLoadedEventEnd:1488989686395
domContentLoadedEventStart:1488989686393
domInteractive:1488989686393
domLoading:1488989686336
domainLookupEnd:1488989686330
domainLookupStart:1488989686330
fetchStart:1488989686328
loadEventEnd:1488989686395
loadEventStart:1488989686395
navigationStart:1488989686328
redirectEnd:0
redirectStart:0
requestStart:1488989686331
responseEnd:1488989686333
responseStart:1488989686332
secureConnectionStart:0
unloadEventEnd:1488989686333
unloadEventStart:1488989686333
*/
console.log(performance.timing);
/*
navigationStart:1488989686328
unloadEventStart:1488989686333
unloadEventEnd:1488989686333
redirectStart:0
redirectEnd:0
fetchStart:1488989686328
domainLookupStart:1488989686330
domainLookupEnd:1488989686330
connectStart:1488989686330
connectEnd:1488989686331
secureConnectionStart:0
requestStart:1488989686331
responseStart:1488989686332
responseEnd:1488989686333
domLoading:1488989686336
domInteractive:0
domContentLoadedEventStart:0
domContentLoadedEventEnd:0
domComplete:0
loadEventStart:0
loadEventEnd:0
 */
var timing = performance.timing;
for(var value in timing){
    console.log(value + ':'+timing[value]);
}
getEntries()
getEntries()方法将返回一个数组,包含了页面中所有的HTTP资源请求
[注意]IE8-浏览器不支持
以下面的页面为例,可知页面有jquery一个资源的请求
<!DOCTYPE html>
<html lang="en">
<head>
    <meta charset="UTF-8">
    <title>Document</title>
</head>
<body>
<script src="http://cdn.bootcss.com/jquery/1.11.2/jquery.min.js"></script>
<script>
console.log(performance.getEntries());
</script>
</body>
</html>
结果如下图所示,由于只有一个资源,所以该资源处于performance.getEntries()[0]中
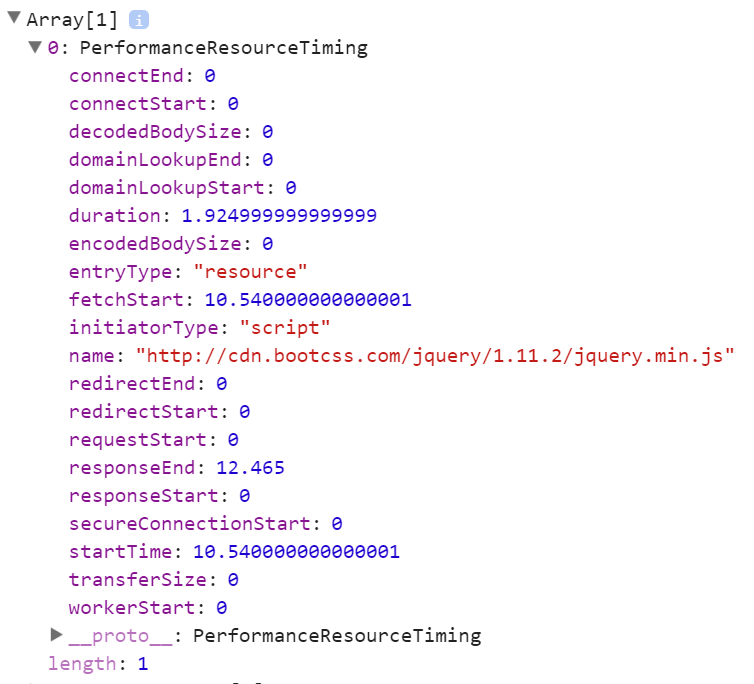
其中,duration表示加载时间;name表示资源的绝对路径;entryType表示资源类型;initiatorType表示发起请求的标签
now()
now()方法返回从页面初始化到调用该方法时的毫秒数
[注意]IE9-浏览器不支持
performance.now()与Date.now()不同的是,返回了以微秒为单位的时间,更加精准
并且与Date.now()会受系统程序执行阻塞的影响不同,performance.now()的时间是以恒定速率递增的,不受系统时间的影响(系统时间可被人为或软件调整)
Date.now()输出的是UNIX时间,即距离1970年1月1日0点的时间,而performance.now()输出的是相对于performance.timing.navigationStart(页面初始化)的时间
var t0 = window.performance.now();
doSomething();
var t1 = window.performance.now();
console.log("doSomething函数执行了" + (t1 - t0) + "毫秒.")
性能指标
通过timing属性的这些时间值,就可以全面了解页面在被加载到浏览器的过程中都经历了哪些阶段,而哪些阶段可能是影响性能的瓶颈
【重定向时间】
times.redirect = timing.redirectEnd - timing.redirectStart;
console.log(times.redirect);//0
【DNS查询时间】
times.lookupDomain = timing.domainLookupEnd - timing.domainLookupStart;
console.log(times.lookupDomain);//1
【TCP握手时间】
times.connect = timing.connectEnd - timing.connectStart;
console.log(times.connect);//48
【HTTP响应时间】
通过浏览器发出HTTP请求,到浏览器接受完HTTP响应的时间
times.request = timing.responseEnd - timing.requestStart;
console.log(times.request);//182
最终,性能指标对象times表示如下
var timing = performance.timing;
var times = {
    redirect:timing.redirectEnd - timing.redirectStart,
    lookupDomain:timing.domainLookupEnd - timing.domainLookupStart,
    connect:timing.connectEnd - timing.connectStart,
    request:timing.responseEnd - timing.requestStart
};
好的代码像粥一样,都是用时间熬出来的


 浙公网安备 33010602011771号