

JS前端三维地球渲染——中国各城市航空路线展示
前言
我还从来没有写过有关纯JS的文章(上次的矢量瓦片展示除外,相对较简单。),自己也学习过JS、CSS等前端知识,了解JQuery、React等框架,但是自己艺术天分实在不过关,不太喜欢前端设计,比较喜欢后台的逻辑处理。
昨天整理自己收藏的东西,无意中看到一个3维地球展示的开源框架,非常漂亮,怎么自己当时仅是收藏并未研究呢?于是喜欢技术无法自拔的我不分三七二十一,立马开始研究。
框架介绍
框架名称为PhiloGL,从名字就能看出这是一个用来显示3维物体的WebGL框架。其官网介绍为:
PhiloGL is a WebGL Framework for Data Visualization, Creative Coding and Game Development
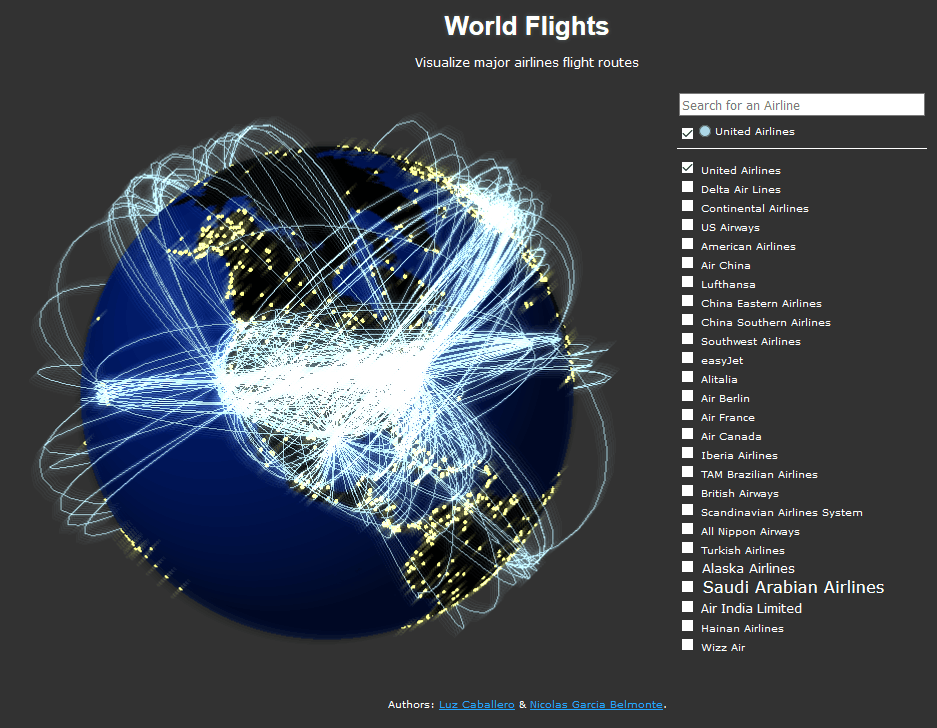
大意是一个数据可视化、创意编码和游戏开发的WebGL框架。官网中提供了很多酷炫的3维实例,各位可以在其中找到自己感兴趣的东西。这段时间我一直在做GIS方向,于是看到3维地球就无法自拔,DEMO位置http://www.senchalabs.org/philogl/PhiloGL/examples/worldFlights/。这是一个全球航空路线的3维展示,用户可以选择不同的航空公司进行展示。截图如下:
我的工作
看到这么酷炫的东西当然想要变成自己的,这是一个老程序员对技术不懈执着追求的内发原因。我本来想做一个中国春运期间迁徙图,奈何搜了半天居然找不到数据,没有数据一切岂不是白扯。航空路线是一个非常好的展示,但是人家DEMO都已经给出了,我总不能拿来就说是我做的吧?那么只能稍微改点东西,一来假装东西是自己做的,二来也算是对整个框架的一个学习。本身以为是个很轻松的事情,没想到却比想象中复杂的多。我实现的功能是根据中国的城市显示对应的航空路线,即当列表中选择某城市时,在3维中画出进出此城市的所有航线。效果如下:

示例演示页面:http://wsf1990.gitee.io/airline_china/airline_china.html,oschina地址:https://gitee.com/wsf1990/airline_china
原理浅析
本文不做过深的技术探讨(因为我也还没吃透😊),此文的用意为一来大家介绍一款优秀的WebGL框架,二来抛砖引玉,为大家提供一点小小的方向。可以在https://github.com/senchalabs/philogl中找到框架源码及示例源码。
1. 创建三维场景
首先创建一个画布canvas,所以必须是支持HTML5的浏览器才能正常访问。代码如下:
<canvas id="map-canvas" width="1024" height="1024"></canvas>
简单的添加一个canvas。
然后在js中使用如下代码创建三维场景:
PhiloGL('map-canvas', {
	program: [{
		//to render cities and routes
		id: 'airline_layer',
		from: 'uris',
		path: 'shaders/',
		vs: 'airline_layer.vs.glsl',
		fs: 'airline_layer.fs.glsl',
		noCache: true
	}, {
		//to render cities and routes
		id: 'layer',
		from: 'uris',
		path: 'shaders/',
		vs: 'layer.vs.glsl',
		fs: 'layer.fs.glsl',
		noCache: true
	},{
		//to render the globe
		id: 'earth',
		from: 'uris',
		path: 'shaders/',
		vs: 'earth.vs.glsl',
		fs: 'earth.fs.glsl',
		noCache: true
	}, {
		//for glow post-processing
		id: 'glow',
		from: 'uris',
		path: 'shaders/',
		vs: 'glow.vs.glsl',
		fs: 'glow.fs.glsl',
		noCache: true
	}],
	camera: {
		position: {
			x: 0, y: 0, z: -5.125
		}
	},
	scene: {
		lights: {
			enable: true,
			ambient: {
				r: 0.4,
				g: 0.4,
				b: 0.4
			},
			points: {
				diffuse: {
					r: 0.8,
					g: 0.8,
					b: 0.8
				},
				specular: {
					r: 0.9,
					g: 0.9,
					b: 0.9
				},
				position: {
					x: 2,
					y: 2,
					z: -4
				}
			}
		}
	},
	events: {
		picking: true,
		centerOrigin: false,
		onDragStart: function(e) {
			pos = pos || {};
			pos.x = e.x;
			pos.y = e.y;
			pos.started = true;

			geom.matEarth = models.earth.matrix.clone();
			geom.matCities = models.cities.matrix.clone();
		},
		onDragMove: function(e) {
			var phi = geom.phi,
				theta = geom.theta,
				clamp = function(val, min, max) {
					return Math.max(Math.min(val, max), min);
				},
				y = -(e.y - pos.y) / 100,
				x = (e.x - pos.x) / 100;

			rotateXY(y, x);

		},
		onDragEnd: function(e) {
			var y = -(e.y - pos.y) / 100,
				x = (e.x - pos.x) / 100,
				newPhi = (geom.phi + y) % Math.PI,
				newTheta = (geom.theta + x) % (Math.PI * 2);

			newPhi = newPhi < 0 ? (Math.PI + newPhi) : newPhi;
			newTheta = newTheta < 0 ? (Math.PI * 2 + newTheta) : newTheta;

			geom.phi = newPhi;
			geom.theta = newTheta;

			pos.started = false;

			this.scene.resetPicking();
		},
		onMouseWheel: function(e) {
			var camera = this.camera,
				from = -5.125,
				to = -2.95,
				pos = camera.position,
				pz = pos.z,
				speed = (1 - Math.abs((pz - from) / (to - from) * 2 - 1)) / 6 + 0.001;

			pos.z += e.wheel * speed;

			if (pos.z > to) {
				pos.z = to;
			} else if (pos.z < from) {
				pos.z = from;
			}

			clearTimeout(this.resetTimer);
			this.resetTimer = setTimeout(function(me) {
				me.scene.resetPicking();
			}, 500, this);

			camera.update();
		},
		onMouseEnter: function(e, model) {
			if (model) {
				clearTimeout(this.timer);
				var style = tooltip.style,
					name = data.citiesIndex[model.$pickingIndex].split('^'),
					textName = name[1][0].toUpperCase() + name[1].slice(1) + ', ' + name[0][0].toUpperCase() + name[0].slice(1),
					bbox = this.canvas.getBoundingClientRect();

				style.top = (e.y + 10 + bbox.top) + 'px';
				style.left = (e.x + 5 + bbox.left) + 'px';
				this.tooltip.className = 'tooltip show';

				this.tooltip.innerHTML = textName;
			}
		},
		onMouseLeave: function(e, model) {
			this.timer = setTimeout(function(me) {
				me.tooltip.className = 'tooltip hide';
			}, 500, this);
		}
	},
	textures: {
		src: ['img/lala.jpg']
	},
	onError: function() {
		Log.write("There was an error creating the app.", true);
	},
	onLoad: function(app) {
		Log.write('Done.', true);

		//Unpack app properties
		var gl = app.gl,
			scene = app.scene,
			camera = app.camera,
			canvas = app.canvas,
			width = canvas.width,
			height = canvas.height,
			program = app.program,
			clearOpt = gl.COLOR_BUFFER_BIT | gl.DEPTH_BUFFER_BIT;

		app.tooltip = $('tooltip');
		//nasty
		centerAirline.app = app;
		cityMgr.app = app;

		gl.clearColor(0.1, 0.1, 0.1, 1);
		gl.clearDepth(1);
		gl.enable(gl.DEPTH_TEST);
		gl.depthFunc(gl.LEQUAL);

		//create shadow, glow and image framebuffers
		app.setFrameBuffer('world', {
			width: 1024,
			height: 1024,
			bindToTexture: {
				parameters : [ {
					name : 'TEXTURE_MAG_FILTER',
					value : 'LINEAR'
				}, {
					name : 'TEXTURE_MIN_FILTER',
					value : 'LINEAR',
					generateMipmap : false
				} ]
			},
			bindToRenderBuffer: true
		}).setFrameBuffer('world2', {
			width: 1024,
			height: 1024,
			bindToTexture: {
				parameters : [ {
					name : 'TEXTURE_MAG_FILTER',
					value : 'LINEAR'
				}, {
					name : 'TEXTURE_MIN_FILTER',
					value : 'LINEAR',
					generateMipmap : false
				} ]
			},
			bindToRenderBuffer: true
		});

		//picking scene
		scene.add(models.earth, models.cities);

		draw();

		//Draw to screen
		function draw() {
			// render to a texture
			gl.viewport(0, 0, 1024, 1024);

			program.earth.use();
			program.earth.setUniform('renderType',  0);
			app.setFrameBuffer('world', true);
			gl.clear(clearOpt);
			scene.renderToTexture('world');
			app.setFrameBuffer('world', false);

			program.earth.use();
			program.earth.setUniform('renderType',  -1);
			app.setFrameBuffer('world2', true);
			gl.clear(clearOpt);
			scene.renderToTexture('world2');
			app.setFrameBuffer('world2', false);

			Media.Image.postProcess({
				fromTexture: ['world-texture', 'world2-texture'],
				toScreen: true,
				program: 'glow',
				width: 1024,
				height: 1024
			});

			Fx.requestAnimationFrame(draw);
		}
	}
});
我之前很少接触3D,只接触过一点Unity3D,还是对.NET技术栈疯狂喜爱的时候,当然我现在也很喜欢C#语言,但是会更加理性的对待每一种语言,用适合的语言做适合的事情。所以上面这段代码不是看的非常明白,大意是设置贴图、镜头(从哪个角度观看此三维场景)、提示(tooltip)及拖拽等事件等。
其中maodels.earth定义如下:
models.earth = new O3D.Sphere({
    nlat: 150,
    nlong: 150,
    radius: 1,
    uniforms: {
        shininess: 32
    },
    textures: ['img/lala.jpg'],
    program: 'earth'
});
这里创建了一个三维球,当然也可以创建立方图等基础三维模型。
2. 请求数据
可以直接采用框架原生的ajax请求方式,不需要使用JQuery。格式如下:
new IO.XHR({
    url: 'data/cities.json',
    onSuccess: function(json) {
        data.cities = JSON.parse(json);
        citiesWorker.postMessage(data.cities);
        Log.write('Building models...');
    },
    onProgress: function(e) {
        Log.write('Loading airports data, please wait...' +
            (e.total ? Math.round(e.loaded / e.total * 1000) / 10 : ''));
    },
    onError: function() {
        Log.write('There was an error while fetching cities data.', true);
    }
}).send();
直接使用IO.XHR请求文本数据,数据可以是任意格式的,自己解析即可。也可以请求其他种类数据,封装的有:
IO.XHR = XHR;
IO.JSONP = JSONP;
IO.Images = Images;
IO.Textures = Textures;
JSONP为跨域请求,Images请求图片数据,Textures请求贴图数据,Images与Textures基本相同,后者是对前者的封装。具体用法可以参见源码。
请求数据函数清晰明了,onSuccess表示请求成功之后的回调函数。onProgress表示请求过程的回调函数,onError更不必说。
3. 加载线路
获取到城市数据、航线数据等之后,通过每条航线的起点和终点在三维地球中绘制出三维航线。代码如下:
var CityManager = function(data, models) {

    var cityIdColor = {};

    var availableColors = {
        '171, 217, 233': 0,
        '253, 174, 97': 0,
        '244, 109, 67': 0,
        '255, 115, 136': 0,
        '186, 247, 86': 0,
        '220, 50, 50': 0
    };

    var getAvailableColor = function() {
        var min = Infinity,
            res = false;
        for (var color in availableColors) {
            var count = availableColors[color];
            if (count < min) {
                min = count;
                res = color;
            }
        }
        return res;
    };

    return {

        cityIds: [],

        getColor: function(cityId) {
            return cityIdColor[cityId];
        },

        getAvailableColor: getAvailableColor,

        add: function(city) {
            var cityIds = this.cityIds,
                color = getAvailableColor(),
                routes = data.airlinesRoutes[city],
                airlines = models.airlines,
                model = airlines['10'],
                samplings = 10,
                vertices = [],
                indices = [],
                fromTo = [],
                sample = [],
                parsedColor;

            parsedColor = color.split(',');
            parsedColor = [parsedColor[0] / (255 * 1.3),
                parsedColor[1] / (255 * 1.3),
                parsedColor[2] / (255 * 1.3)];

            if (model) {
                model.uniforms.color = parsedColor;
            } else {

                for (var i = 0, l = routes.length; i < l; i++) {
                    var ans = this.createRoute(routes[i], vertices.length / 3);
                    vertices.push.apply(vertices, ans.vertices);
                    fromTo.push.apply(fromTo, ans.fromTo);
                    sample.push.apply(sample, ans.sample);
                    indices.push.apply(indices, ans.indices);
                }

                airlines[city] = model = new O3D.Model({
                    vertices: vertices,
                    indices: indices,
                    program: 'airline_layer',
                    uniforms: {
                        color: parsedColor
                    },
                    render: function(gl, program, camera) {
                        gl.lineWidth(this.lineWidth || 1);
                        gl.drawElements(gl.LINES, this.$indicesLength, gl.UNSIGNED_SHORT, 0);
                    },
                    attributes: {
                        fromTo: {
                            size: 4,
                            value: new Float32Array(fromTo)
                        },
                        sample: {
                            size: 1,
                            value: new Float32Array(sample)
                        }
                    }
                });

                model.fx = new Fx({
                    transition: Fx.Transition.Quart.easeOut
                });
            }

            this.show(model);

            cityIds.push(city);
            availableColors[color]++;
            cityIdColor[city] = color;
        },

        remove: function(airline) {
            var airlines = models.airlines,
                model = airlines[airline],
                color = cityIdColor[airline];

            this.hide(model);

            //unset color for airline Id.
            availableColors[color]--;
            delete cityIdColor[airline];
        },

        show: function(model) {
            model.uniforms.animate = true;
            this.app.scene.add(model);
            model.fx.start({
                delay: 0,
                duration: 1800,
                onCompute: function(delta) {
                    model.uniforms.delta = delta;
                },
                onComplete: function() {
                    model.uniforms.animate = false;
                }
            });
        },

        hide: function(model) {
            var me = this;
            model.uniforms.animate = true;
            model.fx.start({
                delay: 0,
                duration: 900,
                onCompute: function(delta) {
                    model.uniforms.delta = (1 - delta);
                },
                onComplete: function() {
                    model.uniforms.animate = false;
                    me.app.scene.remove(model);
                }
            });
        },

        getCoordinates: function(from, to) {
            var pi = Math.PI,
                pi2 = pi * 2,
                sin = Math.sin,
                cos = Math.cos,
                theta = pi2 - (+to + 180) / 360 * pi2,
                phi = pi - (+from + 90) / 180 * pi,
                sinTheta = sin(theta),
                cosTheta = cos(theta),
                sinPhi = sin(phi),
                cosPhi = cos(phi),
                p = new Vec3(cosTheta * sinPhi, cosPhi, sinTheta * sinPhi);

            return {
                theta: theta,
                phi: phi,
                p: p
            };
        },

        //creates a quadratic bezier curve as a route
        createRoute: function(route, offset) {
            var key1 = route[2] + '^' + route[1],
                city1 = data.cities[key1],
                key2 = route[4] + '^' + route[3],
                city2 = data.cities[key2];

            if (!city1 || !city2) {
                return {
                    vertices: [],
                    from: [],
                    to: [],
                    indices: []
                };
            }

            var c1 = this.getCoordinates(city1[2], city1[3]),
                c2 = this.getCoordinates(city2[2], city2[3]),
                p1 = c1.p,
                p2 = c2.p,
                p3 = p2.add(p1).$scale(0.5).$unit().$scale(p1.distTo(p2) / 3 + 1.2),
                theta1 = c1.theta,
                theta2 = c2.theta,
                phi1 = c1.phi,
                phi2 = c2.phi,
                pArray = [],
                pIndices = [],
                fromTo = [],
                sample = [],
                t = 0,
                count = 0,
                samplings = 10,
                deltat = 1 / samplings;

            for (var i = 0; i <= samplings; i++) {
                pArray.push(p3[0], p3[1], p3[2]);
                fromTo.push(theta1, phi1, theta2, phi2);
                sample.push(i);

                if (i !== 0) {
                    pIndices.push(i -1, i);
                }
            }

            return {
                vertices: pArray,
                fromTo: fromTo,
                sample: sample,
                indices: pIndices.map(function(i) { return i + offset; }),
                p1: p1,
                p2: p2
            };
        }
    };

};
此段代码完成航线的颜色选择和起点、终点角度计算,根据此便可绘制出三维效果的航线。
4. 按城市选择
思路也很清晰,在列表中选择城市之后,请求所有航线,然后只取出那些起点或终点为此城市的航线并采用上述方式进行加载。
总结
本文介绍了PhiloGL框架,并粗略介绍了如何使用其绘制中国城市航空路线。本文的目的不在于介绍其如何使用,因为关于3维方面我还欠缺太多知识,只是为大家提供一种思路,个人认为一个程序员思路才是最重要的。后续如果对此框架有新的理解会重新撰文说明。

 浙公网安备 33010602011771号