使用百度地图api可视化聚类结果
1.写在前面
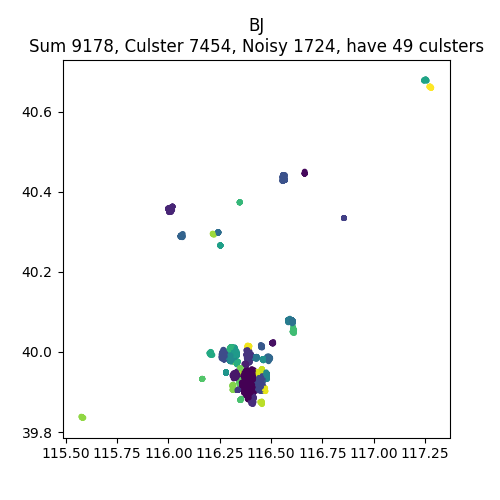
上接YFCC 100M数据集分析笔记,在对聚类出的照片GEO集聚类后,为了方便检测聚类结果,我们显示直接采用了 python 的 matplotlib 库以经纬度为坐标画出聚类结果,但发现这种方式对于聚类结果的显示并不是很直观,如下图,无法发现聚类结果和实际地形的关联:
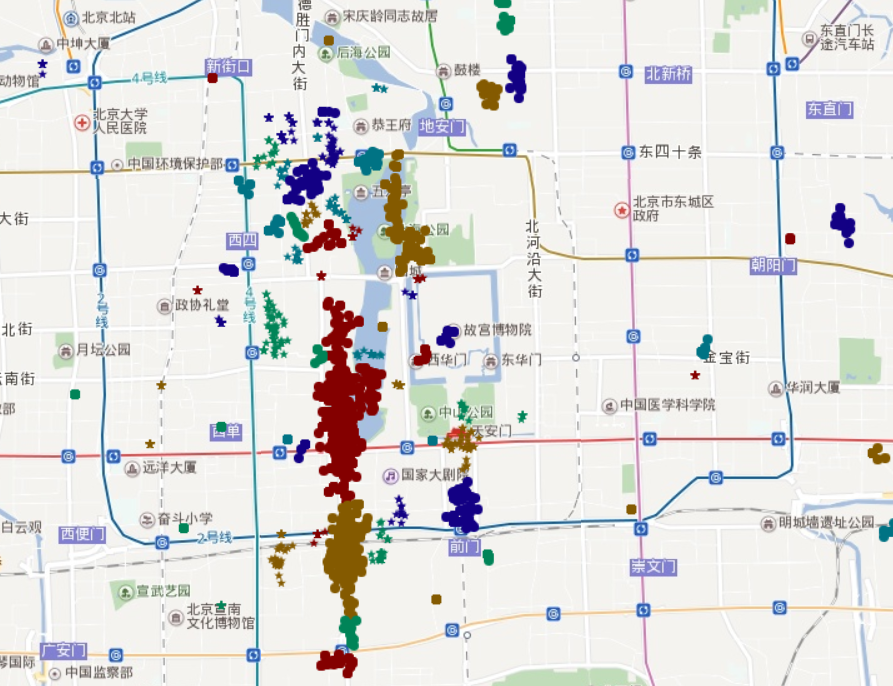
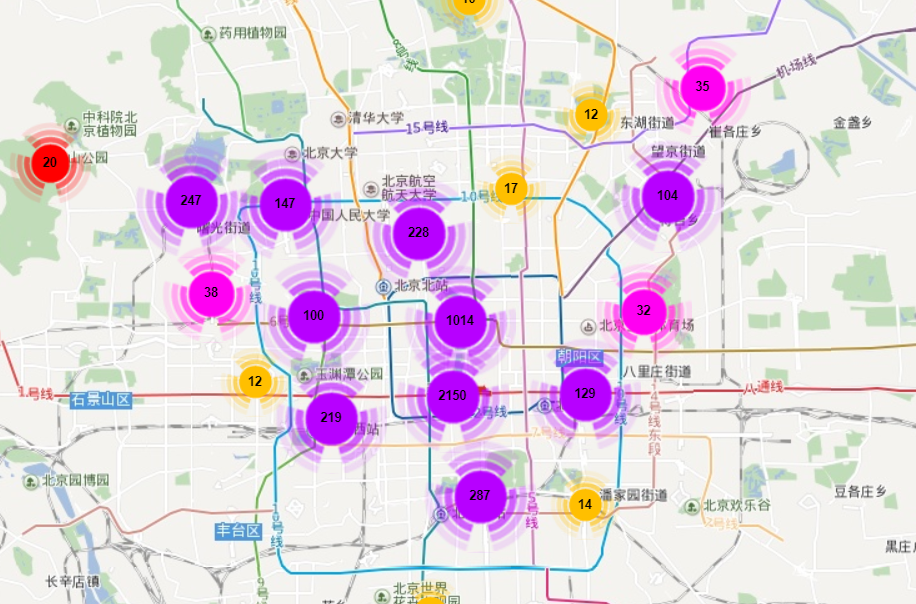
于是想到使用百度地图的API,希望可以将聚类结果直接在实际的地图上投影,在参阅了百度地图官方API实例 之后,发现其提供的 海量点,点聚合 可以实现我们的需求。如下图。
海量点显示结果
点聚合显示结果
2.数据结构
在 data.js 文件中写入数据文件,分别表示[经度,维度,聚类id],如下:
var data = {"data":[
	[116.391213,39.912766,0],
	[116.391220,39.924350,0],
	[116.391155,39.913297,0],
	[116.390233,39.916517,0],
	[116.390404,39.923420,0],
	[116.390416,39.920463,0],
	[116.390275,39.915332,0],
	[116.391811,39.913633,0],
	[116.392593,39.924877,0],

        .....

	[116.380920,39.835959,139],
	[116.380920,39.835959,139],
	[116.380920,39.835959,139],
	[116.380920,39.835959,139],
],
"pointCount":5102,
"culsterCount":140}
3.实现代码
需要首先注册秘钥并将其添加到你的页面中。
<!DOCTYPE HTML>
<html>
<head>
  <title>加载海量点</title>
  <meta http-equiv="Content-Type" content="text/html; charset=utf-8"/>
  <meta name="viewport" content="width=device-width, initial-scale=1.0, maximum-scale=1.0, minimum-scale=1.0, user-scalable=no">
  <style type="text/css">
    html,body{
        margin:0;
        width:100%;
        height:100%;
        background:#ffffff;
    }
    #map{
        width:100%;
        height:100%;
    }
    #panel {
        position: absolute;
        top:30px;
        left:10px;
        z-index: 999;
        color: #fff;
    }
    #login{
        position:absolute;
        width:300px;
        height:40px;
        left:50%;
        top:50%;
        margin:-40px 0 0 -150px;
    }
    #login input[type=password]{
        width:200px;
        height:30px;
        padding:3px;
        line-height:30px;
        border:1px solid #000;
    }
    #login input[type=submit]{
        width:80px;
        height:38px;
        display:inline-block;
        line-height:38px;
    }
  </style>
  <script type="text/javascript" src="http://api.map.baidu.com/api?v=2.0&ak=秘钥"></script>
  <script type="text/javascript" src="http://api.map.baidu.com/library/TextIconOverlay/1.2/src/TextIconOverlay_min.js"></script>
  <script type="text/javascript" src="http://api.map.baidu.com/library/MarkerClusterer/1.2/src/MarkerClusterer_min.js"></script>
  <script type="text/javascript" src="./data.js"></script>
</head>
<body>
    <div id="map"></div>
    <script type="text/javascript">

    // 创建Map实例
    var map = new BMap.Map("map", {});
    // 初始化地图,设置中心点坐标和地图级别
    map.centerAndZoom(new BMap.Point(105.000, 38.000), 5);
    //启用滚轮放大缩小
    map.enableScrollWheelZoom();
    // 设置不显示高速路网
    map.setMapStyle({
        styleJson: [{
            "featureType": "highway",
             "elementType": "all",
             "stylers": {
                  "visibility": "off"
            }
        }]
    });

    var culsters = loadDate();
    // 二选一,绘制海量点或点聚合
    piontCluster(culsters);
    //massivePoint(culsters);

    //点聚合实现代码
    function piontCluster(culsters) {
        var markers = [];

        for(var i=0; i<culsters.length; i++){
            for(var j=0; j<culsters[i].length; j++){
                markers.push(new BMap.Marker(culsters[i][j]));
            }
        }

        //最简单的用法,生成一个marker数组,然后调用markerClusterer类即可。
        var markerClusterer = new BMapLib.MarkerClusterer(map, {markers:markers});
    }

    //海量点显示代码
    function massivePoint(culsters) {
        // 判断当前浏览器是否支持绘制海量点
        if (document.createElement('canvas').getContext) {
            // 设置颜色数组
            var colors = ['#840000', '#008458', '#130084', '#845a00','#007384'];
            // 设置形状数组
            var shapes = [BMAP_POINT_SHAPE_CIRCLE, BMAP_POINT_SHAPE_STAR];

            for(var i=0; i<culsters.length; i++){
                var options = {
                    size: BMAP_POINT_SIZE_SMALL,
                    shape: shapes[i % shapes.length],
                    color: colors[i % colors.length],
                }
                var pointCollection = new BMap.PointCollection(culsters[i], options);
                map.addOverlay(pointCollection);
            }

            //最简单的用法,生成一个marker数组,然后调用markerClusterer类即可。
            var markerClusterer = new BMapLib.MarkerClusterer(map, {markers:markers});
        }
        else {
            alert('请在chrome、safari、IE8+以上浏览器查看本示例');
        }
    }

    // 从data.js中加载数据
    function loadDate() {
        var curPoint = 0;
        var curCulster = 0;
        // 二维数组,保存所有聚类的点的信息
        var culsters = [];
        // 遍历每个聚类,将同个聚类的点至于points
        var points = [];

        while (curPoint < data.pointCount) {
            if(curCulster == data.data[curPoint][2]) {
                points.push(new BMap.Point(data.data[curPoint][0], data.data[curPoint][1]));
                curPoint = curPoint + 1;
            }
            else{
                culsters.push(points);
                points = [];
                curCulster = curCulster + 1;
            }
        }
        culsters.push(points);
        points = [];
        curCulster = curCulster + 1;

        return culsters;
    }
  </script>
</body>
</html>
4.存在的问题
由于在 海量点 中对每个聚类做了特殊处理,使其在展示的时候能显示不同的颜色和形状,所以多次进行了 addOverlay ,会导致加载点太多时的卡顿现象。

 浙公网安备 33010602011771号