
Zabbix概念、安装以及快速入门
Zabbix是一个企业级的、开源的、分布式监控解决方案。[1]
- Zabbix可以监控网络和服务的监控状况.
- Zabbix利用灵活的告警机制,允许用户对事件发送基于Email的告警. 这样可以保证快速的对问题作出相应.
- Zabbix是零成本的. 因为Zabbix编写和发布基于GPL V2协议. 意味着源代码是免费发布的.
Zabbix特性如下[2]:
- 数据收集
- 灵活的阀值定义
- 高级告警配置
- 实时绘图
- 扩展的图形化显示
- 历史数据存储
- 配置简单
- 模板使用
- 网络自动发现
- 快速的web接口
- Zabbix API
- 权限系统
- 全特性、agent易扩展
- 二进制守护进程
- 具备应对复杂环境情况
可以总结为如下三个特点
1)灵活的通知机制:allows users to configure e-mail based alerts for virtually any event;
2)数据可视化;
3)所有报告、统计、参数配置都可通过web端完成;
所以zabbix很适合服务器集群管理员进行功能规划(capacity planning)
1 概览
- 架构
- Server
- database storage
- web interface
- proxy
- agent
- 数据流(data flow)
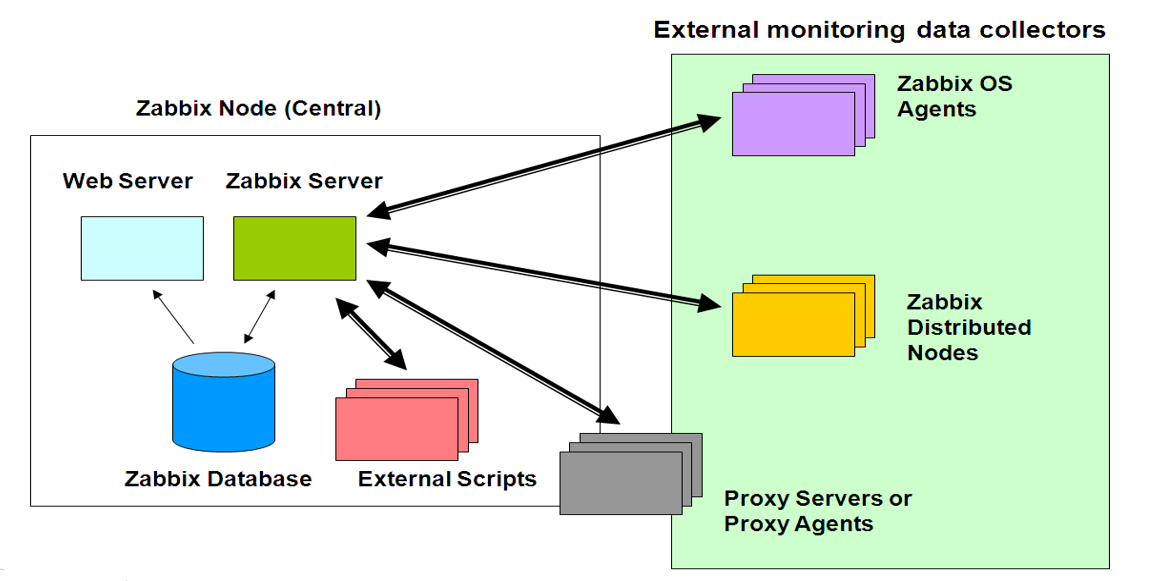
其中,Zabbix Server为中心组件,用来获取agent存活状况及监控数据和统计. 所有的配置、统计、操作数据均通过Server进行存取.
Zabbix agent部署在被监控机器上用来监控本地资源和应用(如硬盘、内存、处理器统计等)
2 术语概念
2.1 server / client / proxy
Zabbix server的功能可以分为三部分:server、web前端和database。
Server执行polling和trapping来采集数据,评估是否触发触发器,发送报警给用户
agent向其报告有效数据和统计。
database存储所有configuration, statistical and operational data。
server和web前端都与database进行交互。
Zabbix server以守护(daemon)进程方式运行
2.2 命令行工具
Sender / Get
3 zabbix进程构成 [3]
默认情况下zabbix包含5个程序:
zabbix_agentd、zabbix_get、zabbix_proxy、zabbix_sender、zabbix_server,另外一个zabbix_java_gateway是可选

zabbix_agentd
客户端守护进程,此进程收集客户端数据,例如cpu负载、内存、硬盘使用情况等

zabbix_get
zabbix工具,单独使用的命令,通常在server或者proxy端执行获取远程客户端信息的命令。
通常用户排错。例如在server端获取不到客户端的内存数据,我们可以使用zabbix_get获取客户端的内容的方式来做故障排查。

zabbix_sender
zabbix工具,用于发送数据给server或者proxy,通常用于耗时比较长的检查。
很多检查非常耗时间,导致zabbix超时。于是我们在脚本执行完毕之后,使用sender主动提交数据。

zabbix_server
zabbix服务端守护进程。
zabbix_agentd、zabbix_get、zabbix_sender、zabbix_proxy、zabbix_java_gateway的数据最终都是提交到server
备注:当然不是数据都是主动提交给zabbix_server,也有的是server主动去取数据。

zabbix_proxy
zabbix代理守护进程。功能类似server,
唯一不同的是它只是一个中转站,它需要把收集到的数据提交/被提交到server里。

zabbix_java_gateway
zabbix2.0之后引入的一个功能。顾名思义:Java网关,类似agentd,但是只用于Java方面。
需要特别注意的是,它只能主动去获取数据,而不能被动获取数据。它的数据最终会给到server或者proxy。
4 安装zabbix
首先安装MariaDB数据库。Linux发行版,使用repository configuration tool,选择自己合适的安装步骤。
- 卸载mysql
如果已经安装了mysql,需要先卸载mysql,否则安装过程中会出现冲突。
- 本机选择10.1stable for centos7 x86_64
//添加源
shell> cat /etc/yum.repos.d/mariaDB.repo
[mariadb]
name = MariaDB
baseurl = http://yum.mariadb.org/10.1/centos7-amd64
gpgkey=https://yum.mariadb.org/RPM-GPG-KEY-MariaDB
gpgcheck=1

shell> yum install MariaDB-server MariaDB-client mariadb

//服务管理,使用如下命令start/stop MariaDB:
shell> sudo systemctl start mariadb.service #直接用mariadb也行
shell> sudo systemctl stop mariadb.service
shell> sudo systemctl enable mariadb.service #开机自启动
从10.1起,Galera Cluster(同步MariaDB数据库的多master集群的工具)默认包含在MariaDB中。
see also Installing MariaDB with yum.
4.1 zabbix sever [4]
安装
shell> rpm -ivh http://repo.zabbix.com/zabbix/2.2/rhel/7/x86_64/zabbix-release-2.2-1.el7.noarch.rpm
//for Zabbix server and web frontend with mysql database
shell> yum install zabbix-server-mysql zabbix-web-mysql
//可以将server与agent安装在同一台机器
shell> yum install zabbix-agent
创建zabbix数据库以及远程用户
[user@host ~]# mysql -uroot -p

MariaDB [(none)]> create database zabbix character set utf8 collate utf8_bin;
MariaDB [(none)]> grant all privileges on zabbix.* to zabbix@localhost identified by 'your_password';
MariaDB [(none)]> grant all privileges on zabbix.* to zabbix@'172.16.%.%' identified by 'your_password';
MariaDB [(none)]> flush privileges;
MariaDB [(none)]> select host,user from mysql.user;
+-----------------------+--------+
| host                  | user   |
+-----------------------+--------+
| 127.0.0.1             | root   |
| 172.16.%.%            | zabbix |
| ::1                   | root   |
| localhost             |        |
| localhost             | fsj    |
| localhost             | root   |
| localhost             | zabbix |
| localhost.localdomain |        |
+-----------------------+--------+
- 导入初始化schema和data
shell> cd /usr/share/doc/zabbix-server-mysql-2.2.15/create
shell> mysql -uroot -p  zabbix < schema.sql
shell> mysql -uroot -p  zabbix < images.sql
shell> mysql -uroot -p  zabbix < data.sql
- Edit database configuration in zabbix_server.conf
shell> vi /etc/zabbix/zabbix_server.conf
DBHost=localhost
DBName=zabbix
DBUser=zabbix
DBPassword=zabbix
-
开启zabbix-server服务:systemctl start zabbix-server
-
Editing PHP configuration for Zabbix frontend
- 修改timezone:
php_value date.timezone Asia/Shanghai - 重启httpd服务:service httpd restart
- 修改timezone:
或者通过sed调整php配置[6]
shell> sed -i 's/^.*date.timezone =.*$/date.timezone = Asia\/Shanghai/g' /etc/php.ini
shell> sed -i 's/^.*post_max_size =.*$/post_max_size = 16M/g' /etc/php.ini
shell> sed -i 's/^.*max_execution_time =.*$/max_execution_time = 300/g' /etc/php.ini
shell> sed -i 's/^.*max_input_time =.*$/max_input_time = 300/g' /etc/php.ini
shell> sed -i 's/^.* memory_limit =.*$/memory_limit = 128M/g'  /etc/php.ini
shell> service httpd restart
- 配置服务开机启动
shell> chkconfig zabbix-server on
shell> chkconfig zabbix-agent on
shell> chkconfig httpd on
访问 http://your-zabbix-server-ip/zabbix
默认username/password 是Admin/zabbix.
- 如果出现错误:zabbix server is not running
解决办法:设置SELinux 成为permissive模式 shell> setenforce 0
- 如果出现防火墙相关问题,打开agent的端口
查看zabbix监听端口:
shell> netstat -nlop | grep zabbix
tcp        0      0 0.0.0.0:10051           0.0.0.0:*               LISTEN      23904/zabbix_server  off (0.00/0/0)
tcp6       0      0 :::10051                :::*                    LISTEN      23904/zabbix_server  off (0.00/0/0)
打开防火墙该端口:
shell> iptables -I INPUT -p tcp --dport 10051 -m state --state NEW,ESTABLISHED -j ACCEPT
shell> iptables -I OUTPUT -p tcp --sport 10051 -m state --state ESTABLISHED -j ACCEPT
也可以批量修改其他端口:
shell> iptables-save > firewalls.txt
shell> vim firewalls.txt
shell> iptables-restore <firewalls.txt
或者直接关闭防火墙:# systemctl stop firewalld
see also Linux防火墙配置(iptables, firewalld)
4.2 zabbix agent
shell> sudo rpm -ivh http://repo.zabbix.com/zabbix/2.2/rhel/7/x86_64/zabbix-release-2.2-1.el7.noarch.rpm
shell> sudo yum install zabbix-agent zabbix-sender -y
shell> grep -Ev '(^$|^#)' /etc/zabbix/zabbix_agentd.conf  #修改server地址
PidFile=/var/run/zabbix/zabbix_agentd.pid
LogFile=/var/log/zabbix/zabbix_agentd.log
LogFileSize=0
Server=172.16.44.5
Hostname=Zabbix server fsj
Include=/etc/zabbix/zabbix_agentd.d/

shell> sudo service zabbix-agent start
shell> sudo systemctl enable zabbix-agent
5 用户管理


权限管理并不是直接设置一个user对应于一个host的什么权限,而是设置user groups对应与host groups的权限。

切换到permissions选项卡

6 开始监控
6.1 添加Zabbix agent(局域网其他机器)以及其item
新建host

其中,最好有一个Host name项和/etc/zabbix/zabbix_agentd.conf中Hostname保持一致。
如果不存在host与配置文件中的Hostname相同,那么运行之后log文件会报错host xxx(Hostname值) not found,但是前端host条目依然可以获取到数据。
修改conf文件后要重启服务才能生效
新建item

其中key表示要监测的的信息。
- 详细:https://www.zabbix.com/documentation/2.2/manual/config/items/itemtypes/zabbix_agent
- Items supported by platform
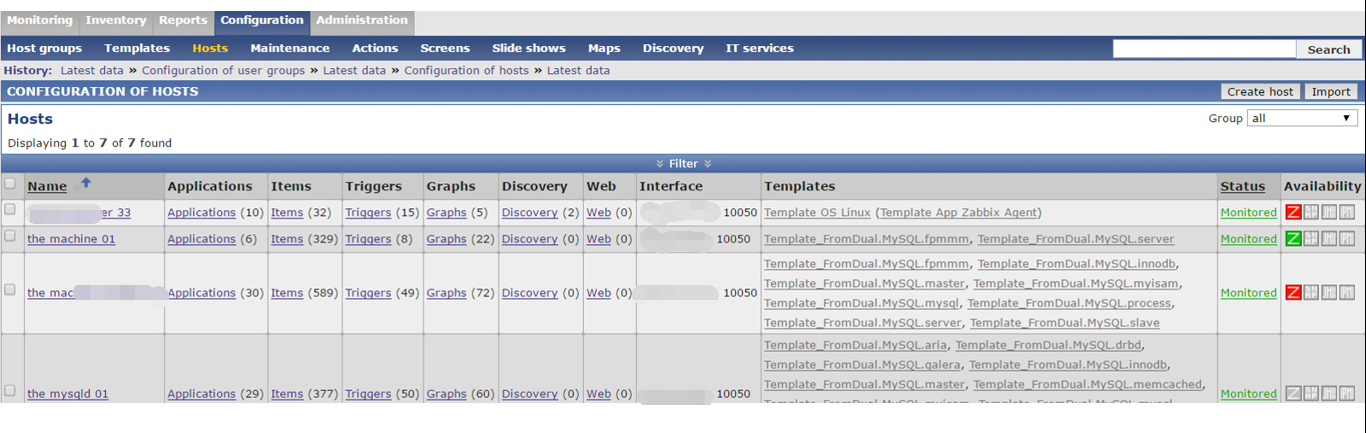
在configuration->hosts页面可看到刚刚添加的host,如果available项为绿色Z表示一切正常。
有可能出现如下错误
Received empty response from Zabbix Agent at [x.x.x.x]. Assuming that agent dropped connection because of access permission
到Monitoring -> Latest data页面查看监控到的实时数据
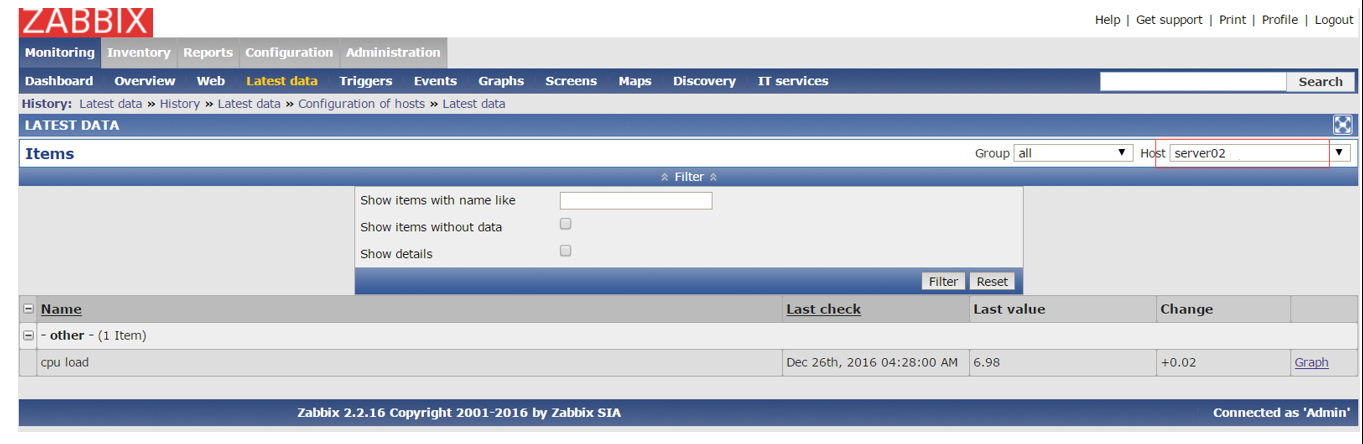
点击graph可以查看cpu load的折线图。
6.2 触发器
一个触发器包括一个定义了数据阈值的表达式。
格式为{<server>:<key>.<function>(<parameter>)}<operator><constant>。
其中:
- key: 该server定义的item
- function: https://www.zabbix.com/documentation/2.2/manual/appendix/triggers/functions
- parameter: 数字n表示n秒,#n表示最近n个值,n[m|h|d]表示n[分钟|小时|天]
输入数据如果高于该阈值,触发器就会报警。
6.2.1 创建触发器

激活触发器 shell> cat /dev/urandom | md5sum


更多触发器示例:
{www.zabbix.com:system.cpu.load[all,avg1].last()}>5{www.zabbix.com:system.cpu.load[all,avg1].last()}>5|{www.zabbix.com:system.cpu.load[all,avg1].min(10m)}>2{www.zabbix.com:vfs.file.cksum[/etc/passwd].diff()}=1
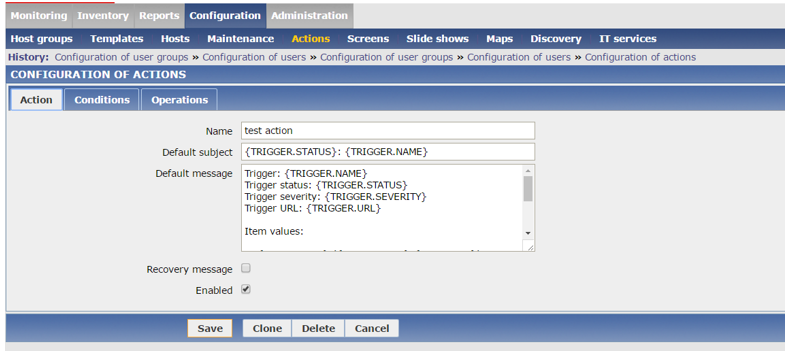
6.2.2 通知
Administration -> Media type 设置 email(需要有email软件支持)

新建action
查看发送情况
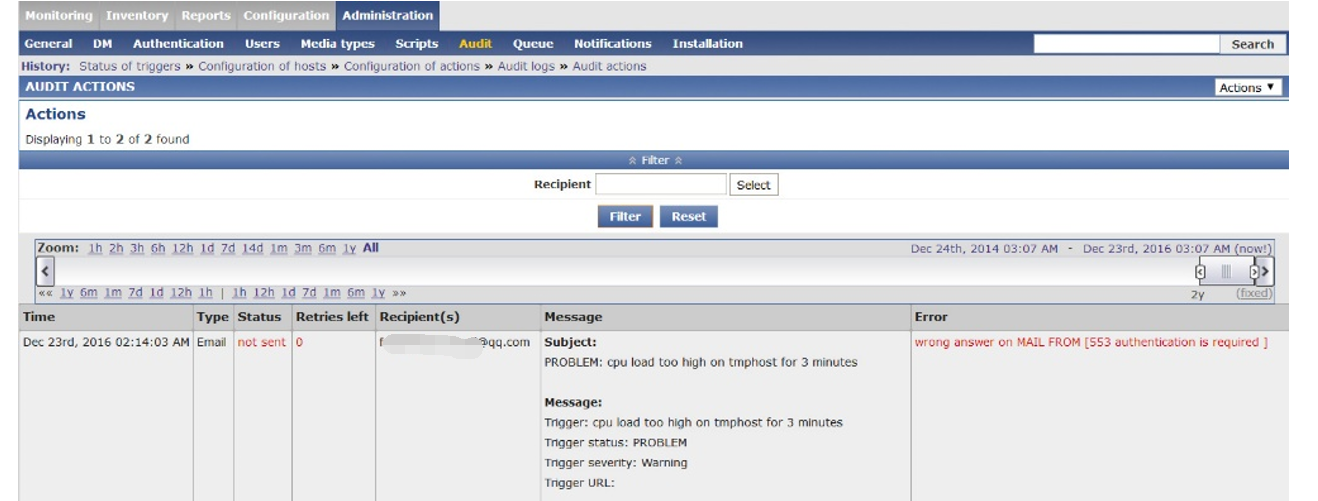
这里没有设email相关,所以发送失败
7 使用模版
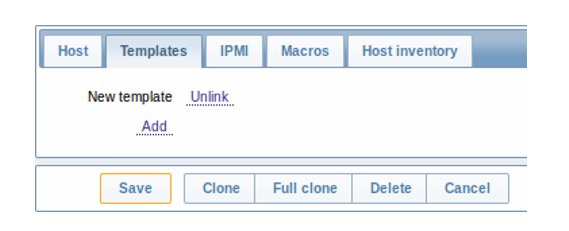
点击host,切换到templates选项卡可以关联想要的模版。
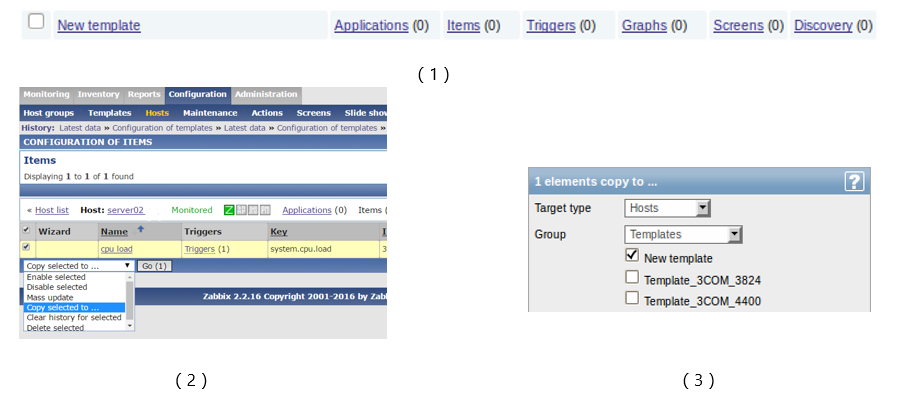
我们也可以通过 Configuration → Templates 可以创建空模版。然后把现有的item、trigger等拷贝到该模版,方便以后批量应用。
References
作者:kakashis
联系方式:fengshenjiev[AT]gmail.com
本文版权归作者所有,欢迎转载,演绎或用于商业目的,但是必须说明本文出处(包含链接)。

 浙公网安备 33010602011771号