


分布式监控系统Zabbix--完整安装记录 -添加apache监控
前面介绍了zabbix3.0.3环境及相关监控项的添加,下面介绍下针对apache的监控配置:
1)在apache配置文件中打开server-status状态访问功能(自带的)
[root@IDC-Admin-01 ~]# /data/apache/bin/httpd -v
Server version: Apache/2.4.25 (Unix)
Server built: Jun 19 2017 19:18:00
[root@IDC-Admin-01 ~]# cat /data/apache/conf/httpd.conf|grep status //确保apache支持status查询功能
LoadModule status_module modules/mod_status.so
[root@IDC-Admin-01 ~]# cat /data/apache/conf/httpd.conf|grep httpd-info.conf
Include conf/extra/httpd-info.conf //打开这一行的注释
[root@IDC-Admin-01 ~]# cat /data/apache/conf/extra/httpd-info.conf
.........
<Location /server-status>
SetHandler server-status
Order deny,allow
Allow from all
</Location>
#
# ExtendedStatus controls whether Apache will generate "full" status
# information (ExtendedStatus On) or just basic information (ExtendedStatus
# Off) when the "server-status" handler is called. The default is Off.
#
ExtendedStatus On
[root@IDC-Admin-01 ~]# /data/apache/bin/httpd -k restart //重启apache服务
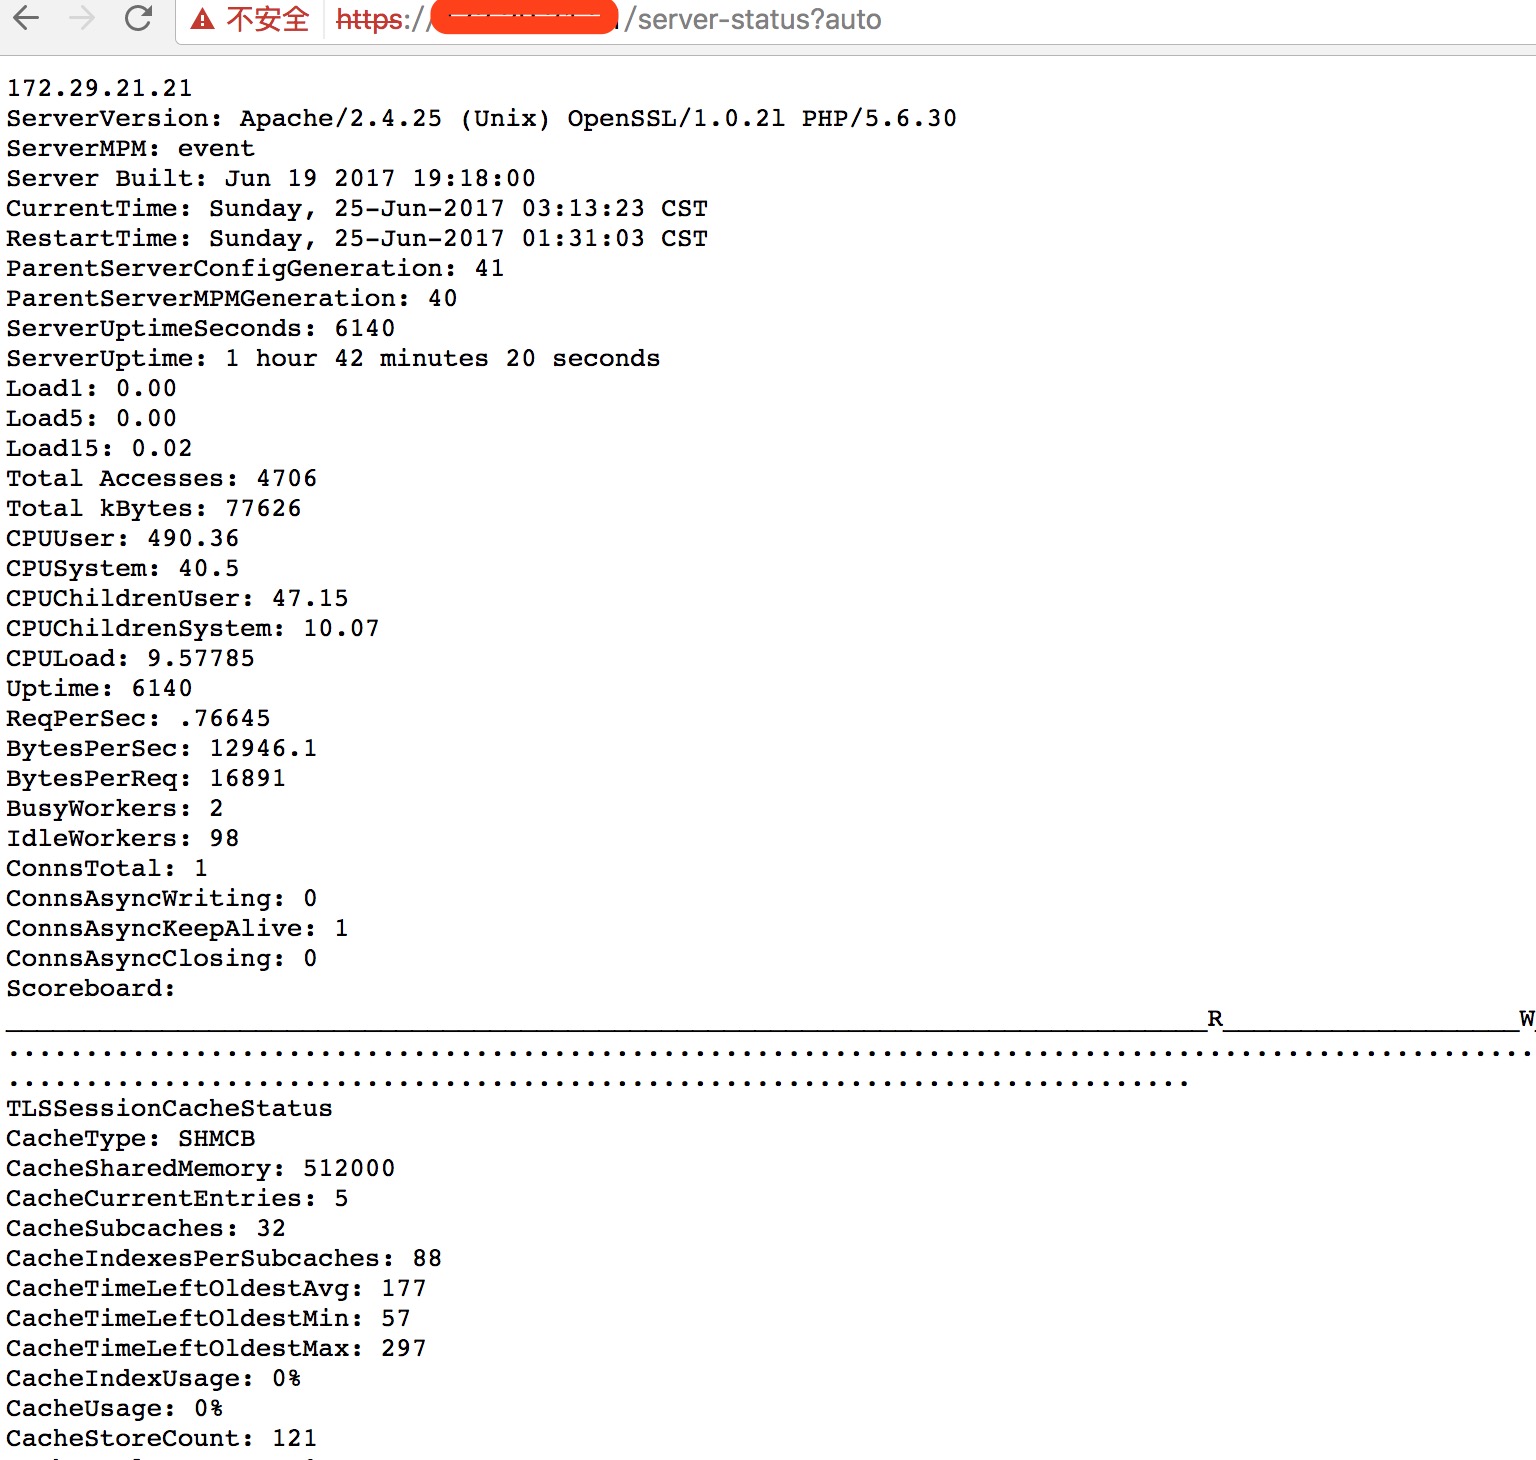
然后就可以访问apache的状态页面了
[root@IDC-Admin-01 ~]# curl http://localhost/server-status
[root@IDC-Admin-01 ~]# curl http://localhost/server-status?auto
localhost
ServerVersion: Apache/2.4.25 (Unix) OpenSSL/1.0.2l PHP/5.6.30
ServerMPM: event
...........
ConnsTotal: 2
ConnsAsyncWriting: 0
ConnsAsyncKeepAlive: 1
ConnsAsyncClosing: 1
Scoreboard: ___________________________________________________________________________________________W________............................................................................................................................................................................................................................................................................................................
TLSSessionCacheStatus
CacheType: SHMCB
CacheSharedMemory: 512000
CacheCurrentEntries: 6
.......
2)编写apache状态监控脚本
[root@IDC-Admin-01 ~]# ll /data/zabbix/monitor_scripts/zapache.sh
-rwxr-xr-x 1 zabbix zabbix 6.0K 6月  25 01:47 /data/zabbix/monitor_scripts/zapache.sh

[root@IDC-Admin-01 ~]# cat /data/zabbix/etc/zabbix_agentd.conf|grep Include
### Option: Include
Include=/data/zabbix/etc/zabbix_agentd.conf.d/

[root@IDC-Admin-01 ~]# cat /data/zabbix/etc/zabbix_agentd.conf.d/userparameter_zapache.conf
#
# This is a sample zabbix_agentd config file.
# Put it to /etc/zabbix_agentd.conf.d or otherwise integrate into agent config.
# Edit to your needs.
#
UserParameter=zapache[*],/data/zabbix/monitor_scripts/zapache.sh \$1

[root@IDC-Admin-01 ~]# /etc/init.d/zabbix_agentd restart
apache脚本和监控模块下载地址:https://pan.baidu.com/s/1eRBKEcE (提取密码:nxs5)
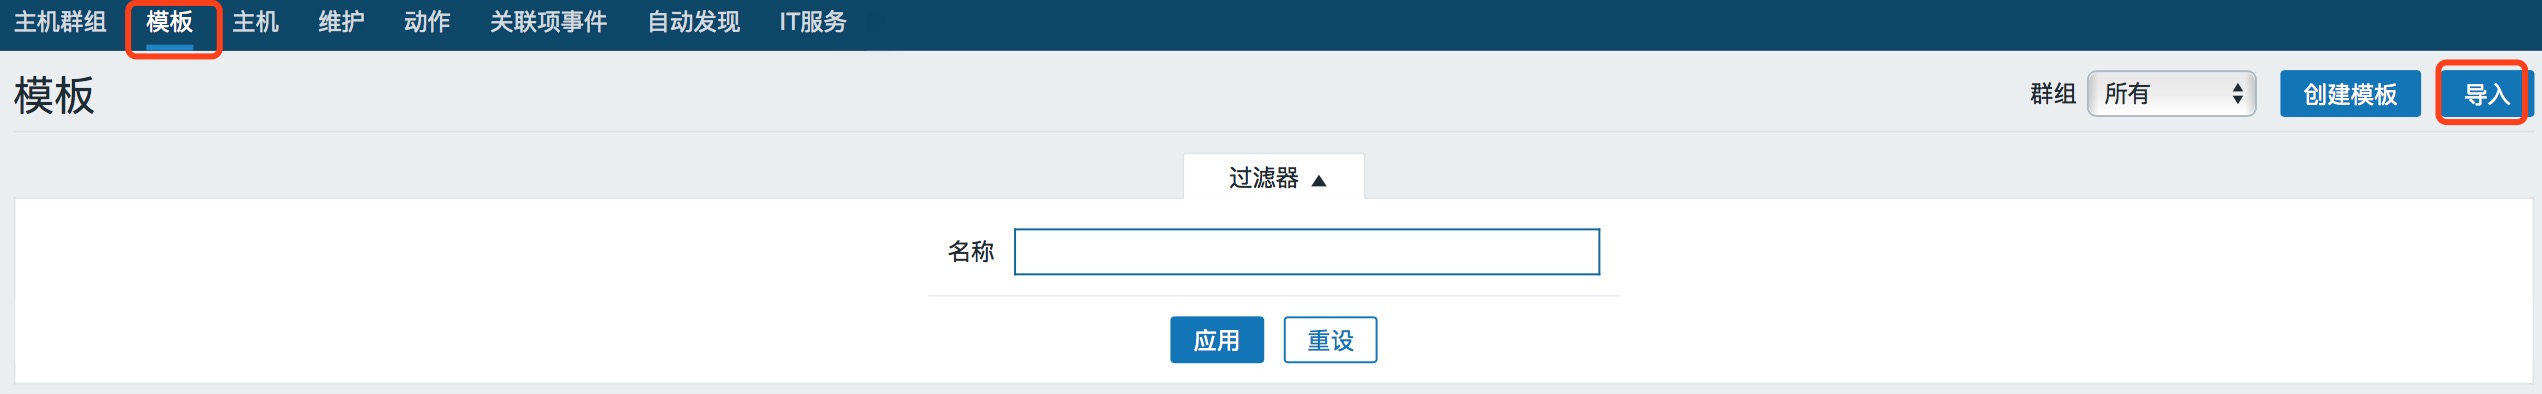
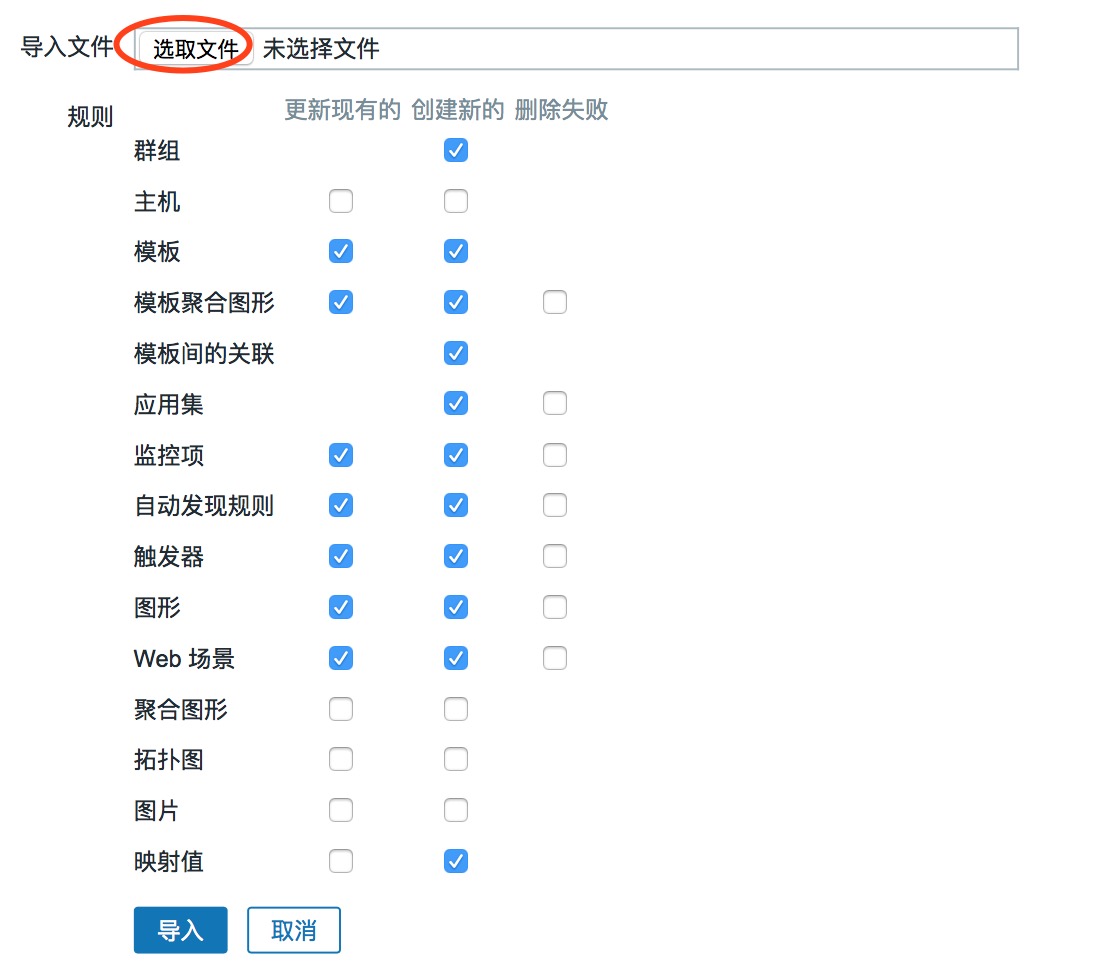
3)在zabbix界面里导入apache监控模块
接着在“主机”的模块里添加apache模块(对应模块的监控图形可以自己根据需要进行添加或移除)
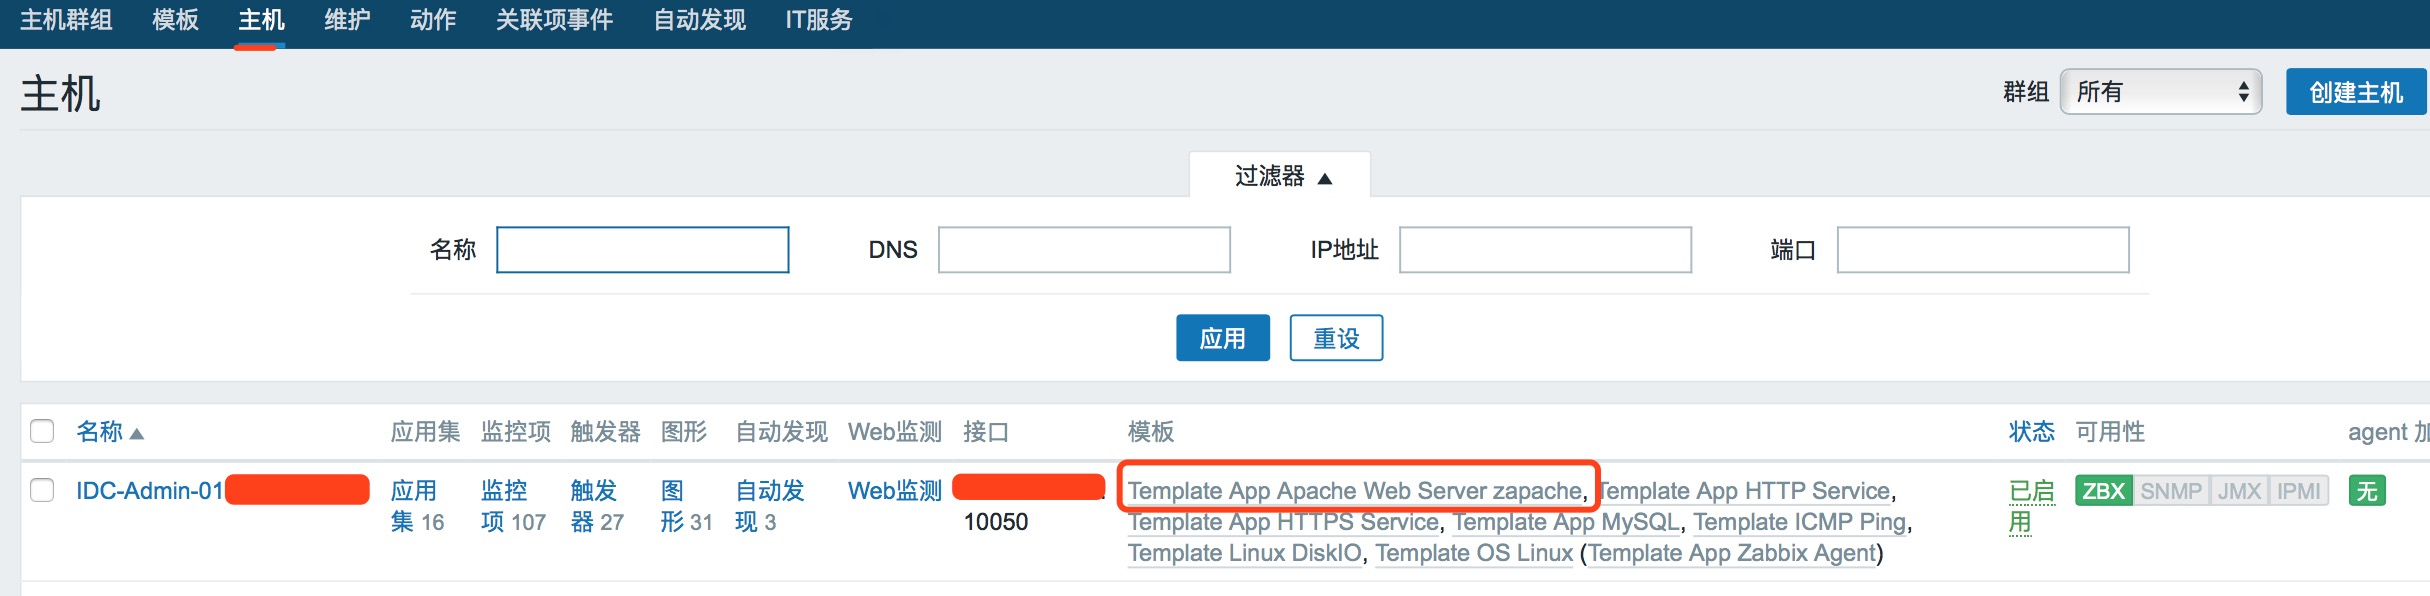
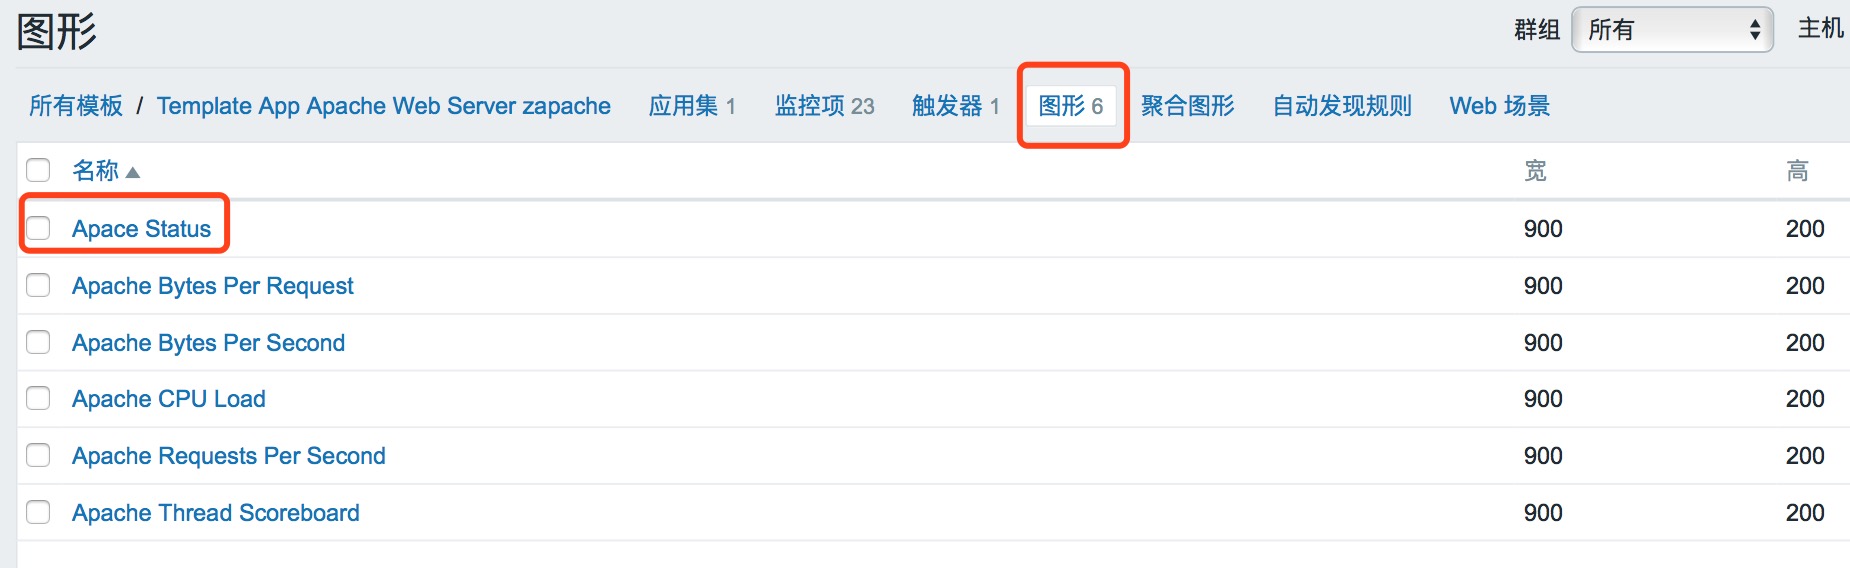
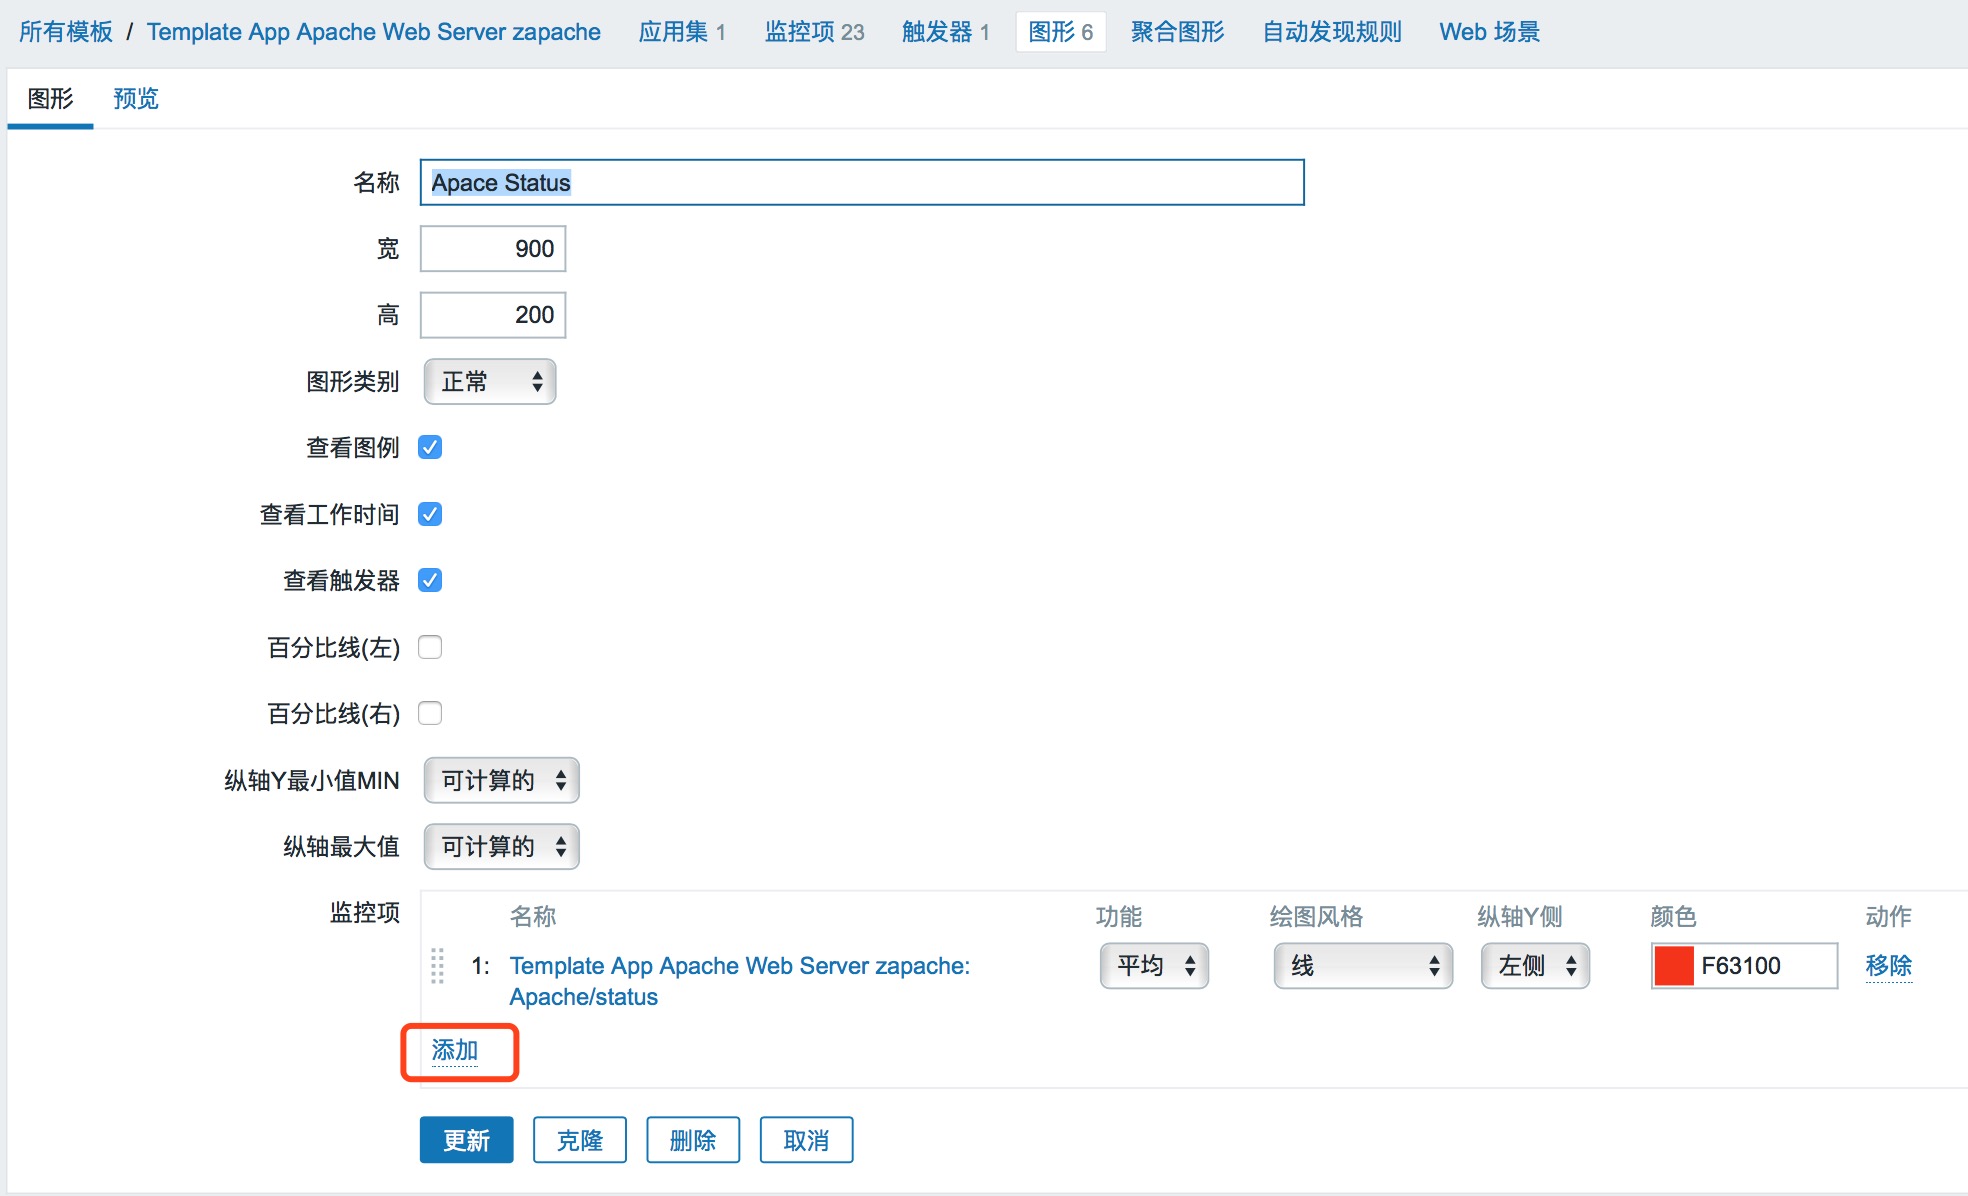
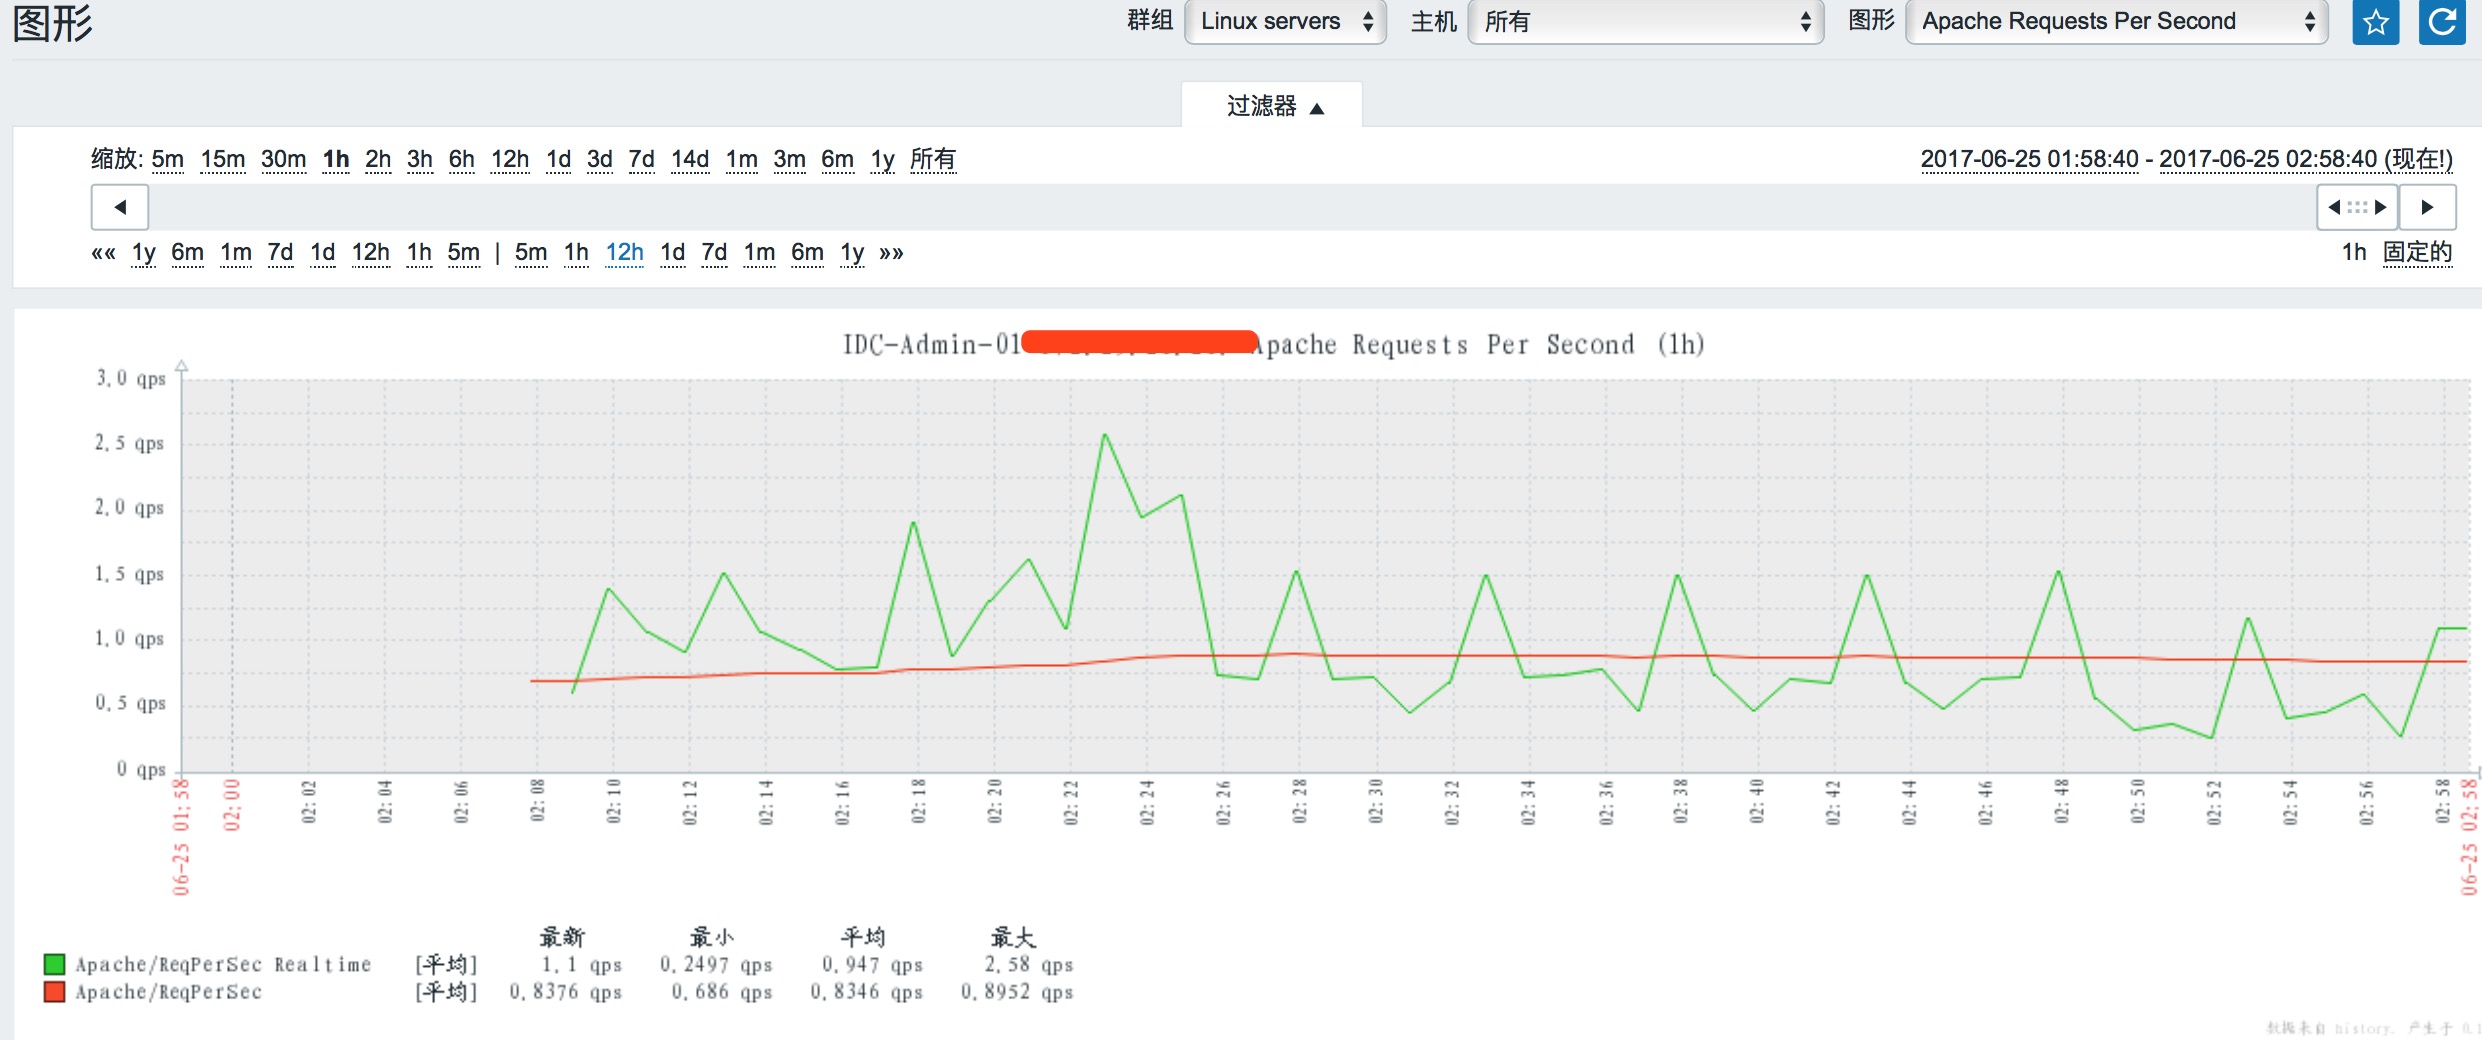
点击“添加”,就能看到该监控项的所有图形了。
*************** 当你发现自己的才华撑不起野心时,就请安静下来学习吧!***************

 浙公网安备 33010602011771号