最近因为项目需要,需要为客户的统计数据生成图表,包括柱状图和饼图。我找来了Dundas Software的Dundas Chart,大家可以上它的网站www.dundas.com查看最新版本的信息以及下载该软件它确实是一个功能强大的组件,而且用户友好性方面很值得国产软件学习。
闲话少说,进入该软件的使用。先安装该软件,安装后它包括两个非常有用的功能,一个是做的非常类似msdn的帮助文档,相信对.net程序员非常友好,就当是msdn用吧。另外一个是它的sample,这是一个完整的.net解决方案,你可以在IIS里面配置个网站来访问它。接着你就可以开始通过sample来了解和学习Dundas Chart的强大功能了。
下面给个我学习中生成的图片。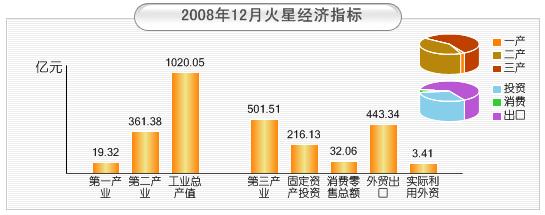
下面是程序部分源码
 private void Page_Load(object sender, System.EventArgs e)


 {
{
 // 在此处放置用户代码以初始化页面
if(!this.IsPostBack)

 {
{
double industry1 = 19.32;
double industry2 = 361.38;
double industry3 = 501.51;
double industryfull = 1020.05;
double fixedasserts = 216.13;
double retailtrade = 32.06;
double foreigntrade = 443.34;
double foreigncapital = 3.41;
//------------------------生产统计图表-------------------------
Dundas.Charting.WebControl.Chart Chart1 = new Dundas.Charting.WebControl.Chart();
Chart1.BackImage = this.Server.MapPath("cn/images/target/back_img.gif");
Chart1.BackGradientEndColor = Color.White;
Chart1.BorderLineColor = Color.White;
Chart1.BorderLineWidth = 0;
Chart1.BorderSkin.FrameBackColor = Color.MediumTurquoise;
Chart1.BorderSkin.FrameBackGradientEndColor = Color.Teal;
Chart1.Palette = ChartColorPalette.SemiTransparent;
Chart1.Width = 545;
Chart1.Height = 215;
Chart1.ImageType = ChartImageType.Jpeg;
Chart1.AntiAliasing = AntiAliasing.All;
Chart1.Titles.Add("Default");
Chart1.Titles[0].Text = "2008年12月火星经济指标";
Chart1.Titles[0].Alignment = ContentAlignment.TopCenter;
Chart1.Titles[0].Font = new Font("黑体", 12, FontStyle.Bold);
Chart1.Titles[0].Color = Color.FromArgb(72, 72, 72);
饼图("一产", "二产", "三产")#region 饼图("一产", "二产", "三产")
//设置图表区域样式1("一产", "二产", "三产")
Chart1.ChartAreas.Add("Default");
ChartArea ChartArea1 = Chart1.ChartAreas["Default"];
ChartArea1.Area3DStyle.Enable3D = true;
ChartArea1.Area3DStyle.Light = LightStyle.None;
ChartArea1.Area3DStyle.XAngle = 70;
ChartArea1.Area3DStyle.YAngle = 60;
ChartArea1.BorderWidth = 0;
ChartArea1.BackColor = Color.Transparent;
ChartArea1.Position.Auto = false;
ChartArea1.Position.Width = 50;
ChartArea1.Position.Height = 30;
ChartArea1.Position.X = 65;
ChartArea1.Position.Y = 10;
//设置图例区域样式1("一产", "二产", "三产")
Legend Legend1 = Chart1.Legends["Default"];
Legend1.Alignment = StringAlignment.Center;
Legend1.BorderWidth = 1;
Legend1.Font = new Font("幼圆", 8, FontStyle.Bold);
Legend1.BackColor = Color.Transparent;
Legend1.FontColor = Color.Black;
Legend1.DockInsideChartArea = true;
Legend1.DockToChartArea = "Default";
//绑定数据1("一产", "二产", "三产")
double[] yValues = {industry1, industry2, industry3};
string[] xValues = {"一产", "二产", "三产"};
Chart1.Series.Add("Series1");
Series Series1 = Chart1.Series["Series1"];
Series1.Points.DataBindXY(xValues, yValues);
Series1.ChartType = "Pie";
Series1.BorderColor = Color.White;
Series1.Palette = ChartColorPalette.EarthTones;
Series1["LabelStyle"] = "Disabled";
Series1.ChartArea = "Default";
Series1.Legend = "Default";
 #endregion
饼图("投资", "消费", "出口")#region 饼图("投资", "消费", "出口")
//设置图表区域样式2("投资", "消费", "出口")
Chart1.ChartAreas.Add("Second");
ChartArea ChartArea2 = Chart1.ChartAreas["Second"];
ChartArea2.Area3DStyle.Enable3D = true;
ChartArea2.Area3DStyle.Light = LightStyle.None;
ChartArea2.Area3DStyle.XAngle = 70;
ChartArea2.Area3DStyle.YAngle = 60;
ChartArea2.BorderWidth = 0;
ChartArea2.BackColor = Color.Transparent;
ChartArea2.Position.Auto = false;
ChartArea2.Position.Width = 50;
ChartArea2.Position.Height = 30;
ChartArea2.Position.X = 65;
ChartArea2.Position.Y = 32;
//设置图例区域样式2("投资", "消费", "出口")
Legend Legend2 = new Legend("Second");
Chart1.Legends.Add(Legend2);
Legend2.Alignment = StringAlignment.Center;
Legend2.BorderWidth = 1;
Legend2.BackColor = Color.Transparent;
Legend2.Font = new Font("幼圆", 8, FontStyle.Bold);
Legend2.FontColor = Color.Black;
Legend2.DockInsideChartArea = true;
Legend2.DockToChartArea = "Second";
//绑定数据2("投资", "消费", "出口")
double[] yValues2 = {fixedasserts, retailtrade, foreigntrade};
string[] xValues2 = {"投资", "消费", "出口"};
Chart1.Series.Add("Series2");
Series Series2 = Chart1.Series["Series2"];
Series2.Points.DataBindXY(xValues2, yValues2);
Series2.ChartType = "Pie";
Series2.BorderColor = Color.White;
Series2.Palette = ChartColorPalette.Pastel;
Series2["LabelStyle"] = "Disabled";
Series2.ChartArea = "Second";
Series2.Legend = "Second";
#endregion
柱状图#region 柱状图
double[] yTitle3 = {industry1, industry2,industryfull,0, industry3, fixedasserts, retailtrade, foreigntrade, foreigncapital};
double x = MaxValue(yTitle3)/10;
//设置图表区域样式3
Chart1.ChartAreas.Add("3nd");
ChartArea ChartArea3 = Chart1.ChartAreas["3nd"];
ChartArea3.Area3DStyle.Enable3D = false;
ChartArea3.Area3DStyle.Light = LightStyle.Realistic;
ChartArea3.AxisX.LineColor = Color.FromArgb(64,64,64);
ChartArea3.AxisX.LabelStyle.Font = new Font("幼圆", 8, FontStyle.Bold);
ChartArea3.AxisX.LabelStyle.FontColor = Color.Black;
ChartArea3.AxisX.LabelStyle.OffsetLabels = false;
ChartArea3.AxisX.LabelsAutoFit = false;
ChartArea3.AxisX.MajorGrid.Enabled = false;
ChartArea3.AxisX.MajorTickMark.Enabled = true;
ChartArea3.AxisX.MajorTickMark.LineColor = Color.Transparent;
ChartArea3.AxisX.MajorTickMark.Interval = 4;
ChartArea3.AxisY.CustomLabels.Add(0, MaxValue(yTitle3)*2.3, "亿元");
ChartArea3.AxisY.LabelStyle.Enabled = true;
ChartArea3.AxisY.LabelStyle.FontAngle = 0;
ChartArea3.AxisY.LabelStyle.Font = new Font("幼圆", 10, FontStyle.Bold);
ChartArea3.AxisY.MajorGrid.Enabled = false;
ChartArea3.AxisY.MajorTickMark.Enabled = false;
ChartArea3.BorderWidth = 0;
ChartArea3.BackColor = Color.Transparent;
ChartArea3.Position.Auto = false;
ChartArea3.Position.Width = 80;
ChartArea3.Position.Height = 67;
ChartArea3.Position.X = 5;
ChartArea3.Position.Y = 28;
//设置图例区域样式3
Legend Legend3 = new Legend("3nd");
Chart1.Legends.Add(Legend3);
Legend3.Enabled = false;
Legend3.DockToChartArea = "3nd";
//绑定数据3
double[] yValues3 = {industry1+x, industry2+x,industryfull+x,0, industry3+x, fixedasserts+x, retailtrade+x, foreigntrade+x, foreigncapital+x};
string[] xValues3 = {"第一产业", "第二产业", "工业总产值", " ", "第三产业", "固定资产投资", "消费零售总额", "外贸出口", "实际利用外资"};
Chart1.Series.Add("Series3");
Series Series3 = Chart1.Series["Series3"];
Series3.Points.DataBindXY(xValues3, yValues3);
Series3.ChartType = "Column";
Series3.BorderColor = Color.White;
Series3.BackGradientType = GradientType.VerticalCenter;
Series3.BackGradientEndColor = Color.Khaki;
Series3.Color = Color.FromArgb(255,128,0);
Series3["PointWidth"] = "0.7";
Series3.ChartArea = "3nd";
Series3.Legend = "3nd";
for(int i=0;i<Series3.Points.Count;i++)
{
if(yTitle3[i]!=0) Series3.Points[i].Label = yTitle3[i].ToString();
}
#endregion
Chart1.Save(this.Server.MapPath("Stat.jpg"), ChartImageFormat.Jpeg);
}
 }
}
private double MaxValue(double[] yValue)
{
double maxvalue = 0;
for(int i=0;i<yValue.Length;i++)
{
if(yValue[i] > maxvalue) maxvalue = yValue[i];
}
return maxvalue;
}


 浙公网安备 33010602011771号