JFreeChart开发_用JFreeChart增强JSP报表的用户体验
项目结构:

JFreeChart是一组功能强大、灵活易用的Java绘图API,使用它可以生成多种通用性的报表,
包括柱状图、饼图、曲线图、甘特图等。它能够用在Swing和Web等中制作自定义的图表或报表,
并且得到广泛的应用。本文将通过引领读者学习在JFreeChart中饼图、柱状图和曲线图的进阶
应用,来达到熟练使用JFreeChart的目的。
下载JFreeChart:
JFreeChart是开放源代码的免费软件,但是它的支持文档需要付费才能得到。
其下载地址为:http://sourceforge.net/project/showfiles.php?group_id=15494
说明:1)source目录:为jfreechart的源码目录;
2)lib目录:为包目录,我们需要关注的包为jfreechart-1.0.6.jar、gnujaxp.jar和jcommon-1.0.10.jar这三个包;
3)根目录下的jfreechart-1.0.6-demo.jar是例子程序,大家双击后可看到其中有很多例子的运行结果。
==================================================================
接下来就进入开发阶段了
==================================================================
/jsp_response_bufferedImage/WebRoot/WEB-INF/web.xml
 1 <?xml version="1.0" encoding="UTF-8"?>
 2 <web-app version="2.4" xmlns="http://java.sun.com/xml/ns/j2ee"
 3     xmlns:xsi="http://www.w3.org/2001/XMLSchema-instance"
 4     xsi:schemaLocation="http://java.sun.com/xml/ns/j2ee
 5     http://java.sun.com/xml/ns/j2ee/web-app_2_4.xsd">
 6
 7     <servlet>
 8         <servlet-name>DisplayChart</servlet-name>
 9         <servlet-class>org.jfree.chart.servlet.DisplayChart</servlet-class>
10     </servlet>
11     <servlet-mapping>
12         <servlet-name>DisplayChart</servlet-name>
13         <url-pattern>/DisplayChart</url-pattern>
14     </servlet-mapping>
15
16
17     <welcome-file-list>
18         <welcome-file>index.jsp</welcome-file>
19     </welcome-file-list>
20 </web-app>
/jsp_response_bufferedImage/WebRoot/index.jsp
 1 <%@ page language="java" import="java.util.*" pageEncoding="UTF-8"%>
 2 <%
 3 String path = request.getContextPath();
 4 String basePath = request.getScheme()+"://"+request.getServerName()+":"+request.getServerPort()+path+"/";
 5 %>
 6
 7 <!DOCTYPE HTML PUBLIC "-//W3C//DTD HTML 4.01 Transitional//EN">
 8 <html>
 9   <head>
10     <base href="<%=basePath%>">
11
12     <title>My JSP 'index.jsp' starting page</title>
13     <meta http-equiv="pragma" content="no-cache">
14     <meta http-equiv="cache-control" content="no-cache">
15     <meta http-equiv="expires" content="0">
16     <meta http-equiv="keywords" content="keyword1,keyword2,keyword3">
17     <meta http-equiv="description" content="This is my page">
18     <!--
19     <link rel="stylesheet" type="text/css" href="styles.css">
20     -->
21   </head>
22
23   <body>
24     <!-- 这里可以调整转向的页面:simple.jsp,simple2.jsp,simple3.jsp,simple4.jsp,simple5.jsp -->
25     <jsp:forward page="simple5.jsp"></jsp:forward>
26   </body>
27 </html>
/jsp_response_bufferedImage/WebRoot/simple.jsp
 1 <%@ page language="java" import="java.util.*" pageEncoding="UTF-8"%>
 2 <%@ page import="org.jfree.chart.ChartFactory" %>
 3 <%@ page import="org.jfree.chart.JFreeChart" %>
 4 <%@ page import="org.jfree.chart.plot.PlotOrientation" %>
 5 <%@ page import="org.jfree.chart.servlet.ServletUtilities" %>
 6 <%@ page import="org.jfree.data.category.DefaultCategoryDataset" %>
 7 <%
 8 String path = request.getContextPath();
 9 String basePath = request.getScheme()+"://"+request.getServerName()+":"+request.getServerPort()+path+"/";
10 %>
11
12 <%
13     DefaultCategoryDataset dataset = new DefaultCategoryDataset();
14     dataset.addValue(610, "Guangzhou", "pork");
15     dataset.addValue(220, "Guangzhou", "beaf");
16     dataset.addValue(530, "Guangzhou", "chicken");
17     dataset.addValue(340, "Guangzhou", "fish");
18     JFreeChart chart = ChartFactory.createBarChart3D("Meat sales statistics figure", "meat",
19             "Sales Volume", dataset, PlotOrientation.VERTICAL, false, false,
20             false);
21     String filename = ServletUtilities.saveChartAsPNG(chart, 500, 300,
22             null, session);
23     String graphURL = request.getContextPath()
24             + "/DisplayChart?filename=" + filename;
25     out.println(filename);
26     out.println("------------------");
27     out.println(graphURL);
28 %>
29 <!DOCTYPE HTML PUBLIC "-//W3C//DTD HTML 4.01 Transitional//EN">
30 <html>
31   <head>
32     <base href="<%=basePath%>">
33
34     <title>My JSP 'index.jsp' starting page</title>
35     <meta http-equiv="pragma" content="no-cache">
36     <meta http-equiv="cache-control" content="no-cache">
37     <meta http-equiv="expires" content="0">
38     <meta http-equiv="keywords" content="keyword1,keyword2,keyword3">
39     <meta http-equiv="description" content="This is my page">
40   </head>
41
42   <body>
43     <img src="<%=graphURL%>" width=500 height=300 border=0
44     usemap="#<%= filename %>">
45   </body>
46 </html>
在浏览器地址栏输入《我服务器的端口号是1000》:http://localhost:1000/jsp_response_bufferedImage/
运行效果:

/jsp_response_bufferedImage/WebRoot/simple2.jsp
 1 <%@ page language="java" import="java.util.*" pageEncoding="UTF-8"%>
 2 <%@ page
 3     import="org.jfree.chart.ChartFactory,org.jfree.chart.JFreeChart,org.jfree.chart.plot.PlotOrientation,org.jfree.chart.servlet.ServletUtilities,org.jfree.data.category.CategoryDataset,org.jfree.data.general.DatasetUtilities"%>
 4
 5 <%
 6     String path = request.getContextPath();
 7     String basePath = request.getScheme() + "://"
 8             + request.getServerName() + ":" + request.getServerPort()
 9             + path + "/";
10 %>
11
12 <%
13     double[][] data = new double[][] { { 1310 }, { 720 }, { 1130 },
14             { 440 } };
15     String[] rowKeys = { "pork", "beaf", "chicken", "fish" };
16     String[] columnKeys = { "" };
17     CategoryDataset dataset = DatasetUtilities.createCategoryDataset(
18             rowKeys, columnKeys, data);
19     JFreeChart chart = ChartFactory
20             .createBarChart3D("Guangzhou meat sales statistics figure", "meat", "Sales Volume", dataset,
21                     PlotOrientation.VERTICAL, true, false, false);
22
23     String filename = ServletUtilities.saveChartAsPNG(chart, 500, 300,
24             null, session);
25     String graphURL = request.getContextPath()
26             + "/DisplayChart?filename=" + filename;
27 %>
28
29 <!DOCTYPE HTML PUBLIC "-//W3C//DTD HTML 4.01 Transitional//EN">
30 <html>
31     <head>
32         <base href="<%=basePath%>">
33
34         <title>My JSP 'index.jsp' starting page</title>
35         <meta http-equiv="pragma" content="no-cache">
36         <meta http-equiv="cache-control" content="no-cache">
37         <meta http-equiv="expires" content="0">
38         <meta http-equiv="keywords" content="keyword1,keyword2,keyword3">
39         <meta http-equiv="description" content="This is my page">
40     </head>
41
42     <body>
43         <img src="<%=graphURL%>" width=500 height=300 border=0
44             usemap="#<%= filename %>">
45     </body>
46 </html>
在浏览器地址栏输入《我服务器的端口号是1000》:http://localhost:1000/jsp_response_bufferedImage/
运行效果:

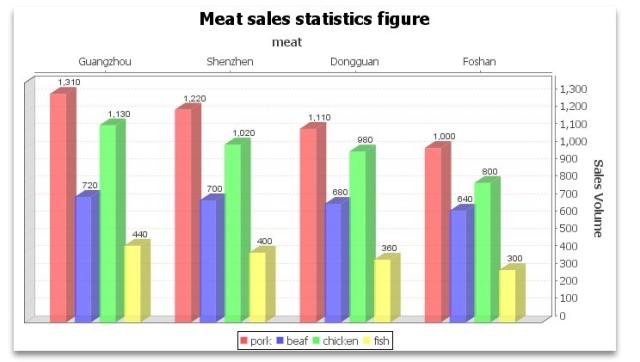
/jsp_response_bufferedImage/WebRoot/simple3.jsp
 1 <%@ page language="java" import="java.util.*" pageEncoding="UTF-8"%>
 2 <%@ page
 3     import="org.jfree.chart.ChartFactory,org.jfree.chart.JFreeChart,org.jfree.chart.plot.PlotOrientation,org.jfree.chart.servlet.ServletUtilities,org.jfree.data.category.CategoryDataset,org.jfree.data.general.DatasetUtilities,org.jfree.chart.plot.*,org.jfree.chart.labels.*,org.jfree.chart.renderer.category.BarRenderer3D,java.awt.*,org.jfree.ui.*,org.jfree.chart.axis.AxisLocation"%>
 4
 5 <%
 6     String path = request.getContextPath();
 7     String basePath = request.getScheme() + "://"
 8             + request.getServerName() + ":" + request.getServerPort()
 9             + path + "/";
10 %>
11
12 <%
13     double[][] data = new double[][] { { 1310, 1220, 1110, 1000 },
14             { 720, 700, 680, 640 }, { 1130, 1020, 980, 800 },
15             { 440, 400, 360, 300 } };
16 String[] rowKeys = { "pork", "beaf", "chicken", "fish" };
17     String[] columnKeys = { "Guangzhou", "Shenzhen", "Dongguan", "Foshan" };
18     CategoryDataset dataset = DatasetUtilities.createCategoryDataset(
19             rowKeys, columnKeys, data);
20
21     JFreeChart chart = ChartFactory.createBarChart3D("Meat sales statistics figure", "meat",
22             "Sales Volume", dataset, PlotOrientation.VERTICAL, true, true, false);
23
24     CategoryPlot plot = chart.getCategoryPlot();
25     //设置网格背景颜色
26     plot.setBackgroundPaint(Color.white);
27     //设置网格竖线颜色
28     plot.setDomainGridlinePaint(Color.pink);
29     //设置网格横线颜色
30     plot.setRangeGridlinePaint(Color.pink);
31     //显示每个柱的数值,并修改该数值的字体属性
32
33     BarRenderer3D renderer = new BarRenderer3D();
34     renderer
35             .setBaseItemLabelGenerator(new StandardCategoryItemLabelGenerator());
36     renderer.setBaseItemLabelsVisible(true);
37     //默认的数字显示在柱子中,通过如下两句可调整数字的显示
38     //注意:此句很关键,若无此句,那数字的显示会被覆盖,给人数字没有显示出来的问题
39     renderer.setBasePositiveItemLabelPosition(new ItemLabelPosition(
40             ItemLabelAnchor.OUTSIDE12, TextAnchor.BASELINE_LEFT));
41     renderer.setItemLabelAnchorOffset(10D);
42     //设置每个地区所包含的平行柱的之间距离
43     //renderer.setItemMargin(0.3);
44     plot.setRenderer(renderer);
45     //设置地区、销量的显示位置
46     //将下方的“肉类”放到上方
47     plot.setDomainAxisLocation(AxisLocation.TOP_OR_RIGHT);
48     //将默认放在左边的“销量”放到右方
49     plot.setRangeAxisLocation(AxisLocation.BOTTOM_OR_RIGHT);
50
51     String filename = ServletUtilities.saveChartAsPNG(chart, 700, 400,
52             null, session);
53     String graphURL = request.getContextPath()
54             + "/DisplayChart?filename=" + filename;
55 %>
56
57
58
59 <!DOCTYPE HTML PUBLIC "-//W3C//DTD HTML 4.01 Transitional//EN">
60 <html>
61     <head>
62         <base href="<%=basePath%>">
63
64         <title>My JSP 'index.jsp' starting page</title>
65         <meta http-equiv="pragma" content="no-cache">
66         <meta http-equiv="cache-control" content="no-cache">
67         <meta http-equiv="expires" content="0">
68         <meta http-equiv="keywords" content="keyword1,keyword2,keyword3">
69         <meta http-equiv="description" content="This is my page">
70     </head>
71
72     <body>
73         <img src="<%=graphURL%>" width=700 height=400 border=0
74             usemap="#<%= filename %>">
75     </body>
76 </html>
在浏览器地址栏输入《我服务器的端口号是1000》:http://localhost:1000/jsp_response_bufferedImage/
运行效果:
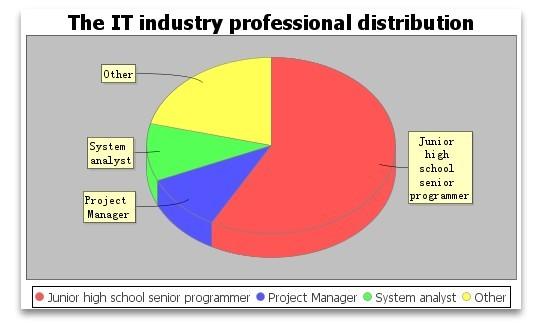
/jsp_response_bufferedImage/WebRoot/simple4.jsp
 1 <%@ page language="java" import="java.util.*" pageEncoding="UTF-8"%>
 2 <%@ page
 3     import="org.jfree.chart.*,org.jfree.chart.plot.PiePlot,org.jfree.data.general.DefaultPieDataset,org.jfree.chart.servlet.ServletUtilities,java.awt.*"%>
 4
 5 <%
 6     String path = request.getContextPath();
 7     String basePath = request.getScheme() + "://"
 8             + request.getServerName() + ":" + request.getServerPort()
 9             + path + "/";
10 %>
11
12 <%
13     //设置数据集
14     DefaultPieDataset dataset = new DefaultPieDataset();
15     dataset.setValue("Junior high school senior programmer", 0.55);
16     dataset.setValue("Project Manager", 0.1);
17     dataset.setValue("System analyst", 0.1);
18     dataset.setValue("System analyst", 0.1);
19     dataset.setValue("Other", 0.2);
20
21     //通过工厂类生成JFreeChart对象
22     //通过工厂类生成JFreeChart对象
23     JFreeChart chart = ChartFactory.createPieChart3D("The IT industry professional distribution",
24             dataset, true, false, false);
25     PiePlot pieplot = (PiePlot) chart.getPlot();
26     pieplot.setLabelFont(new Font("宋体", 0, 12));
27     //没有数据的时候显示的内容
28     pieplot.setNoDataMessage("No data to show");
29     pieplot.setCircular(false);
30
31     pieplot.setLabelGap(0.02D);
32
33     String filename = ServletUtilities.saveChartAsPNG(chart, 500, 300,
34             null, session);
35     String graphURL = request.getContextPath()
36             + "/DisplayChart?filename=" + filename;
37 %>
38
39
40
41
42 <!DOCTYPE HTML PUBLIC "-//W3C//DTD HTML 4.01 Transitional//EN">
43 <html>
44     <head>
45         <base href="<%=basePath%>">
46
47         <title>My JSP 'index.jsp' starting page</title>
48         <meta http-equiv="pragma" content="no-cache">
49         <meta http-equiv="cache-control" content="no-cache">
50         <meta http-equiv="expires" content="0">
51         <meta http-equiv="keywords" content="keyword1,keyword2,keyword3">
52         <meta http-equiv="description" content="This is my page">
53     </head>
54
55     <body>
56         <img src="<%=graphURL%>" width=500 height=300 border=0
57             usemap="#<%= filename %>">
58     </body>
59 </html>
在浏览器地址栏输入《我服务器的端口号是1000》:http://localhost:1000/jsp_response_bufferedImage/
运行效果:
/jsp_response_bufferedImage/WebRoot/simple5.jsp
 1 <%@ page language="java" import="java.util.*" pageEncoding="UTF-8"%>
 2 <%@ page
 3     import="org.jfree.chart.ChartFactory,org.jfree.chart.JFreeChart,org.jfree.chart.servlet.ServletUtilities,org.jfree.chart.title.TextTitle,org.jfree.data.time.TimeSeries,org.jfree.data.time.Month,org.jfree.data.time.TimeSeriesCollection,java.awt.Font"%>
 4
 5 <%
 6     String path = request.getContextPath();
 7     String basePath = request.getScheme() + "://"
 8             + request.getServerName() + ":" + request.getServerPort()
 9             + path + "/";
10 %>
11
12 <%
13     //访问量统计时间线
14     TimeSeries timeSeries = new TimeSeries("Hongten 's blog traffic statistics", Month.class);
15     //时间曲线数据集合
16     TimeSeriesCollection lineDataset = new TimeSeriesCollection();
17     //构造数据集合
18     timeSeries.add(new Month(1, 2007), 11200);
19     timeSeries.add(new Month(2, 2007), 9000);
20     timeSeries.add(new Month(3, 2007), 6200);
21     timeSeries.add(new Month(4, 2007), 8200);
22     timeSeries.add(new Month(5, 2007), 8200);
23     timeSeries.add(new Month(6, 2007), 12200);
24     timeSeries.add(new Month(7, 2007), 13200);
25     timeSeries.add(new Month(8, 2007), 8300);
26     timeSeries.add(new Month(9, 2007), 12400);
27     timeSeries.add(new Month(10, 2007), 12500);
28     timeSeries.add(new Month(11, 2007), 13600);
29     timeSeries.add(new Month(12, 2007), 12500);
30
31     lineDataset.addSeries(timeSeries);
32     JFreeChart chart = ChartFactory.createTimeSeriesChart(
33             "Traffic statistical time line", "Months", "Vistor Volume",
34             lineDataset, true, true, true);
35     //设置子标题
36     TextTitle subtitle = new TextTitle("2007 year", new Font("黑体",
37             Font.BOLD, 12));
38     chart.addSubtitle(subtitle);
39     //设置主标题
40     chart.setTitle(new TextTitle("Hongten 's blog traffic statistics",
41             new Font("隶书", Font.ITALIC, 15)));
42     chart.setAntiAlias(true);
43     String filename = ServletUtilities.saveChartAsPNG(chart, 500, 300,
44             null, session);
45     String graphURL = request.getContextPath()
46             + "/DisplayChart?filename=" + filename;
47 %>
48
49 <!DOCTYPE HTML PUBLIC "-//W3C//DTD HTML 4.01 Transitional//EN">
50 <html>
51     <head>
52         <base href="<%=basePath%>">
53
54         <title>My JSP 'index.jsp' starting page</title>
55         <meta http-equiv="pragma" content="no-cache">
56         <meta http-equiv="cache-control" content="no-cache">
57         <meta http-equiv="expires" content="0">
58         <meta http-equiv="keywords" content="keyword1,keyword2,keyword3">
59         <meta http-equiv="description" content="This is my page">
60     </head>
61
62     <body>
63         <img src="<%=graphURL%>" width=500 height=300 border=0
64             usemap="#<%= filename %>">
65     </body>
66 </html>
在浏览器地址栏输入《我服务器的端口号是1000》:http://localhost:1000/jsp_response_bufferedImage/
运行效果:


 浙公网安备 33010602011771号