

flask+sqlite3+echarts3 系统监控
总的而言,分三部分:
1.监控器(monitor.py): 每秒获取系统的四个cpu的使用率,存入数据库。
2.路由器(app.py): 响应页面的ajax,获取最新的一条或多条数据。
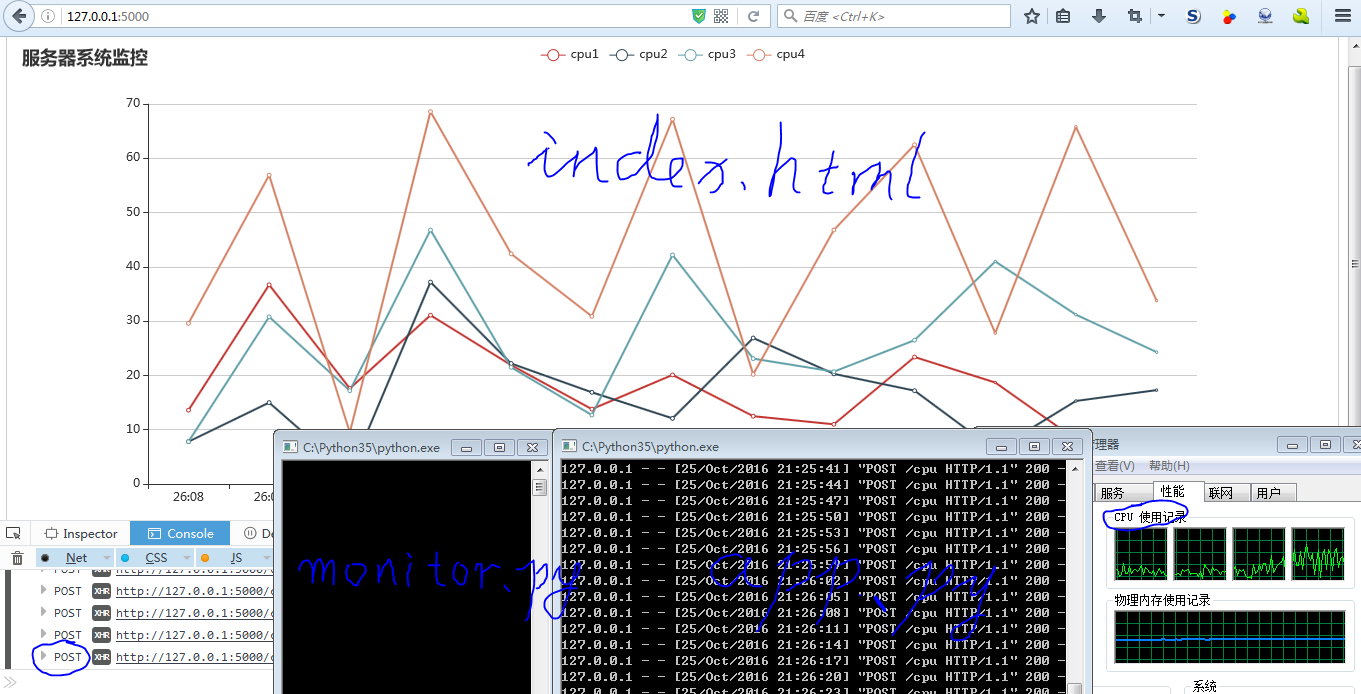
3.页面(index.html): 发出ajax请求,更新echarts图表
一、监控器
使用了psutil库,对系统进行监控。
import psutil
import sqlite3
import time

'''
说明:四个cpu使用率,显然是临时数据,所以最好用内存数据库,如Redis等
但是这里强行使用sqlite3,不管了,哪个叫他是内置的呢?!
'''

db_name = 'mydb.db'


def create_db():
    # 连接
    conn = sqlite3.connect(db_name)
    c = conn.cursor()

    # 创建表
    c.execute('''DROP TABLE IF EXISTS cpu''') # 删除旧表,如果存在(因为这是临时数据)
    c.execute('''CREATE TABLE cpu (id INTEGER PRIMARY KEY AUTOINCREMENT, insert_time text,cpu1 float, cpu2 float, cpu3 float, cpu4 float)''')

    # 关闭
    conn.close()


def save_to_db(data):
    '''参数data格式:['00:01',3.5, 5.9, 0.7, 29.6]'''
    # 建立连接
    conn = sqlite3.connect(db_name)
    c = conn.cursor()

    # 插入数据
    c.execute('INSERT INTO cpu(insert_time,cpu1,cpu2,cpu3,cpu4) VALUES (?,?,?,?,?)', data)

    # 提交!!!
    conn.commit()

    # 关闭连接
    conn.close()


# 创建表
create_db()

# 通过循环,对系统进行监控
while True:
    # 获取系统cpu使用率(每隔1秒)
    cpus = psutil.cpu_percent(interval=1, percpu=True)

    # 获取系统时间(只取分:秒)
    t = time.strftime('%M:%S', time.localtime())

    # 保存到数据库
    save_to_db((t, *cpus))
二、路由器
import sqlite3
from flask import Flask, request, render_template, jsonify

app = Flask(__name__)


def get_db():
    db = sqlite3.connect('mydb.db')
    db.row_factory = sqlite3.Row
    return db


def query_db(query, args=(), one=False):
    db = get_db()
    cur = db.execute(query, args)
    db.commit()
    rv = cur.fetchall()
    db.close()
    return (rv[0] if rv else None) if one else rv


@app.route("/", methods=["GET"])
def index():
    return render_template("index.html")


@app.route("/cpu", methods=["POST"])
def cpu():
    if request.method == "POST":
        res = query_db("SELECT * FROM cpu WHERE id>=(?)", args=(int(request.form['id'])+1,)) #返回1+个数据

    return jsonify(insert_time = [x[1] for x in res],
                   cpu1 = [x[2] for x in res],
                   cpu2 = [x[3] for x in res],
                   cpu3 = [x[4] for x in res],
                   cpu4 = [x[5] for x in res]) # 返回json格式


if __name__ == "__main__":
    app.run(debug=True)
三、页面
<!DOCTYPE html>
<html lang="en">
<head>
    <meta charset="utf-8">
    <title>ECharts3 Ajax</title>
    <script src="{{ url_for('static', filename='jquery-3.1.1.js') }}"></script>
    <script src="{{ url_for('static', filename='echarts.js') }}"></script>
</head>

<body>
    <!--为ECharts准备一个具备大小(宽高)的Dom-->
    <div id="main" style="height:500px;border:1px solid #ccc;padding:10px;"></div>

    <script type="text/javascript">
    //--- 折柱 ---
    var myChart = echarts.init(document.getElementById('main'));

    myChart.setOption({
        title: {
            text: '服务器系统监控'
        },
        tooltip: {},
        legend: {
            data:['cpu1','cpu2','cpu3','cpu4']
        },
        xAxis: {
            data: []
        },
        yAxis: {},
        series: [{
            name: 'cpu1',
            type: 'line',
            data: []
        },{
            name: 'cpu2',
            type: 'line',
            data: []
        },{
            name: 'cpu3',
            type: 'line',
            data: []
        },{
            name: 'cpu4',
            type: 'line',
            data: []
        }]
    });


    // 六个全局变量:插入时间、cpu1、cpu2、cpu3、cpu4、 哨兵(用于POST)
    var insert_time = ["","","","","","","","","",""],
        cpu1 = [0,0,0,0,0,0,0,0,0,0],
        cpu2 = [0,0,0,0,0,0,0,0,0,0],
        cpu3 = [0,0,0,0,0,0,0,0,0,0],
        cpu4 = [0,0,0,0,0,0,0,0,0,0],

        lastID = 0; // 哨兵,记录上次数据表中的最后id +1(下次查询只要>=lastID)


    //准备好统一的 callback 函数
    var update_mychart = function (data) { //data是json格式的response对象

        myChart.hideLoading(); // 隐藏加载动画

        dataLength = data.insert_time.length; //取回的数据长度
        lastID += dataLength; //哨兵,相应增加。

        // 切片是能统一的关键!!
        insert_time = insert_time.slice(dataLength).concat(data.insert_time); // 数组,先切片、再拼接
        cpu1 = cpu1.slice(dataLength).concat(data.cpu1.map(parseFloat)); //注意map方法
        cpu2 = cpu2.slice(dataLength).concat(data.cpu2.map(parseFloat));
        cpu3 = cpu3.slice(dataLength).concat(data.cpu3.map(parseFloat));
        cpu4 = cpu4.slice(dataLength).concat(data.cpu4.map(parseFloat));

        // 填入数据
        myChart.setOption({
            xAxis: {
                data: insert_time
            },
            series: [{
                name: 'cpu1', // 根据名字对应到相应的系列
                data: cpu1
            },{
                name: 'cpu2',
                data: cpu2
            },{
                name: 'cpu3',
                data: cpu3
            },{
                name: 'cpu4',
                data: cpu4
            }]
        });

        if (dataLength == 0){clearInterval(timeTicket);} //如果取回的数据长度为0,停止ajax
    }

    myChart.showLoading(); // 首次显示加载动画


    // 异步加载数据 (首次,get,显示6个数据)
    $.get('/cpu').done(update_mychart);


    // 异步更新数据 (以后,定时post,取回1个数据)
    var timeTicket = setInterval(function () {
        $.post('/cpu',{id: lastID}).done(update_mychart);
    }, 3000);

    </script>
</body>
</html>
效果图

 浙公网安备 33010602011771号