Python | Pandas数据清洗与画图
准备数据
2016年北京PM2.5数据集
数据源说明:美国驻华使馆的空气质量检测数据
数据清洗
1. 导入包
import numpy as np
import matplotlib.pyplot as plt
import matplotlib
import pandas as pd
from datetime import datetime
2. 导入数据
用Pandas库的read_csv()导入csv文件
# 导入2016年北京PM2.5数据集
df = pd.read_csv("Beijing_2016_HourlyPM25_created20170201.csv")
df.head()
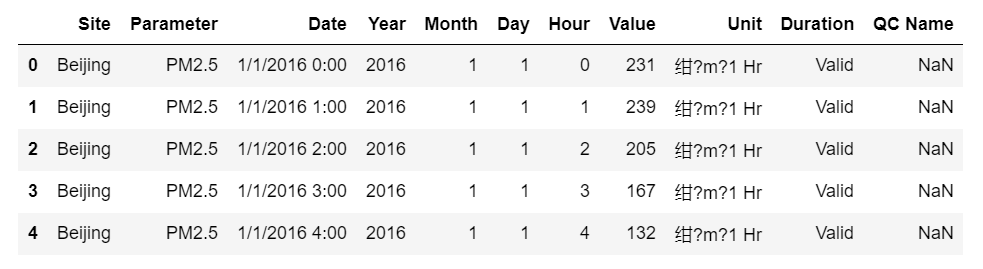
3. 删除对数据分析没有用的列
用Pandas库的drop()删除行或列,axis=0 表示行,axis=1 表示列。
df.drop(["Unit","Duration","QC Name"], axis = 1, inplace=True)
df.head()

4. 查看数据的简要信息
用Pandas库的describe()来查看数据的简要信息,包括了计数,平均值,标准差,最小值,最大值等。
df.describe()

5. 删除指定的数据
通过数据的简要信息发现PM2.5的值存在负数,而PM2.5的值不能为负数。
我们来查看一下PM2.5的值为负数的数量。
count = 0
print('PM2.5的值为负数的数量:')
for i in range(df.shape[0]):
    if(df.at[i,'Value']<0):
        count = count + 1
print(count)
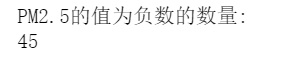
PM2.5的值为负数的数据有45条,而整个数据集的数据有8000多条,删除这45条数据对数据分析没有影响,那怎么删除这45条没用的数据呢?
我们要把PM2.5的值为负数的数据变成空值(NaN),再用Pandas库的dropna()删除空值。
# 把负数的值变成空值(NaN)
df.loc[df.Value<0,'Value']=np.nan
# 删除有空值的数据
df.dropna(inplace=True)
# 此时已经没有负数的PM2.5值了
df.describe()

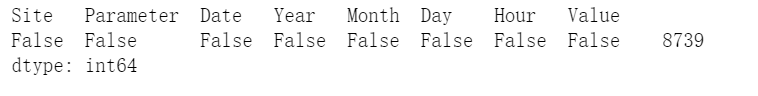
6. 查看是否有空值
用Pandas库的isnull()来查看是否有空值,value_counts()用来统计个数。
df.isnull().value_counts()
7. 查看是否有重复行
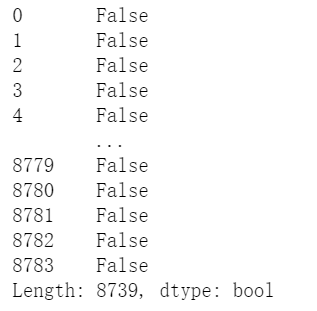
用Pandas库的duplicated()来查看是否有重复行。
df.duplicated()
8. 保存数据清洗后的文件
用Pandas库的to_csv()保存csv文件。
df.to_csv('Beijing_2016_PM25.csv',encoding='utf-8')
画图
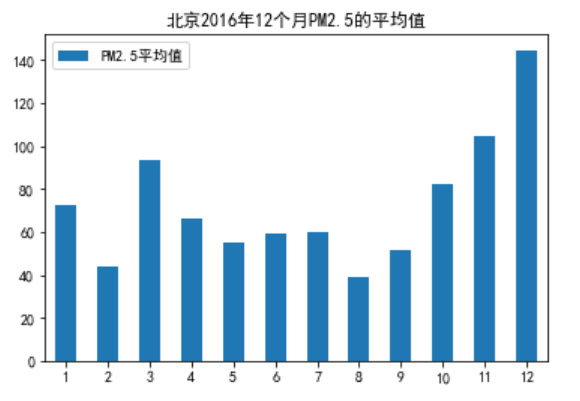
1. 导入数据清洗后的文件,统计北京2016年12个月PM2.5的平均值
我们用条形图来表示:
PM25 = pd.read_csv("Beijing_2016_PM25.csv")
month_avg = PM25.groupby(['Month'])['Value'].mean()
PM25_month = pd.DataFrame({'PM2.5平均值':month_avg}, index = np.arange(1,13))
PM25_month.plot(kind='bar',title='北京2016年12个月PM2.5的平均值')
plt.xticks(rotation=360)
plt.show()
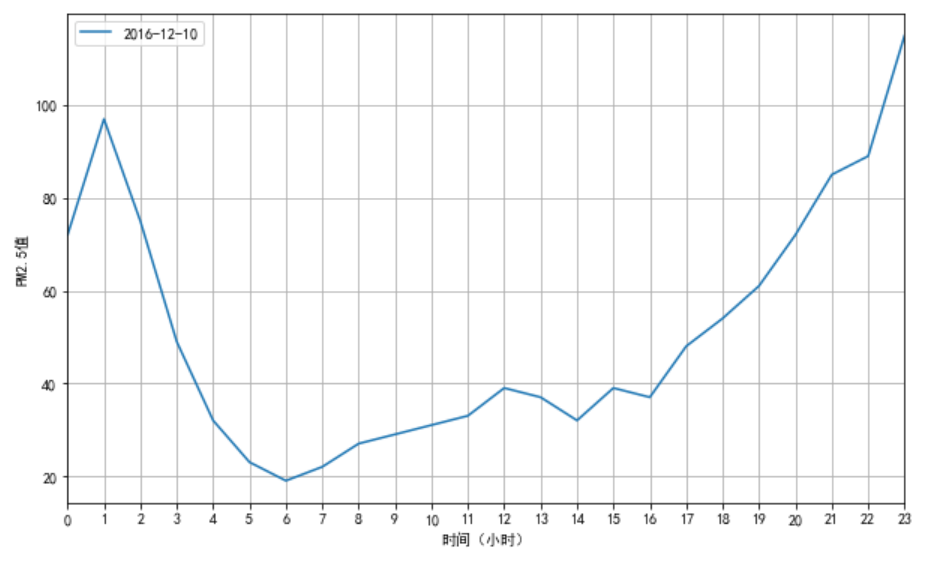
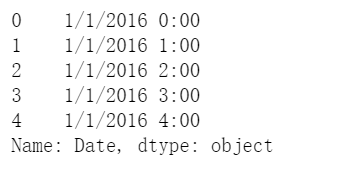
2. 绘制某一天的PM2.5折线图
在我们使用Date时发现,Date格式并非datetime格式,而是object格式。
PM25.Date.head()
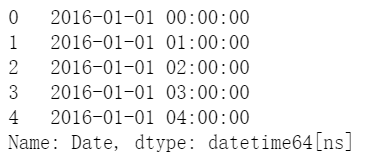
所以我们要把Date的格式转为datetime。
PM25['Date'] = pd.to_datetime(PM25['Date'])
PM25['Date'].head()
转为datetime格式后,再把Date列设置为列索引。
PM25 = PM25.set_index('Date')
PM25.index
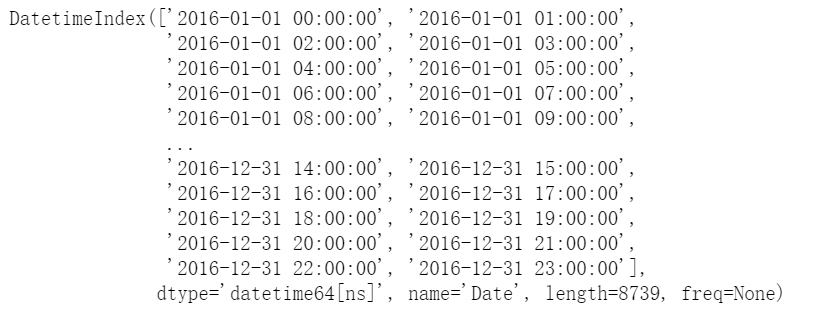
上面的处理完后,就正式进入绘图阶段了。
plt.rcParams['figure.figsize'] = (10.0, 6.0) # 设置画布尺寸
s=pd.Series(PM25['2016-12-10'].Value)#查看2016-12-10的记录
s.plot(kind='line',label='2016-12-10')
plt.legend(loc='upper left') # loc:图例位置参数
plt.xticks(s.index,range(0,24))
plt.xlabel('时间(小时)')
plt.ylabel('PM2.5值')
plt.grid()
plt.show()