查看分配内存、生成Go程较多的函数调用 内存分析/动态追踪 内存溢出 性能 pprof Go程数量 grpc连接池
实践:
-2
排BUG
1)函数NewClientOnce 会新建grcp连接
2)每个Grpc链接会生成一个新的Go程
go cc.scWatcher()
3)和/debug/pprof/goroutine?debug=1
结果吻合
google.golang.org/grpc.(*ccBalancerWrapper).watcher+0x155
go/pkg/mod/google.golang.org/grpc@v1.51.0/balancer_conn_wrappers.go:115
Go程数量不断增加
修复:
建立连接池,通过连接池控制连接数
func NewClient(conn *grpc.ClientConn) pb.APPClient {
	return pb.NewAPPClient(conn)
}
func NewCli() (pb.APPClient, int) {
	c, i := GetAConnWithBlock()
	return NewClient(c), i
}


package server

import (
	"APP/internal/conf"
	"APP/internal/log"
	"fmt"
	"runtime"
	"sync"
	"time"

	"google.golang.org/grpc"
)

var ConnPoolLock sync.Mutex
var ConnPoolSize *int
var ConnPoolIndex int
var ConnPool []*grpc.ClientConn
var ConnPoolThisInUse []bool

func chekcConnState(c *grpc.ClientConn) bool {
	defer func() {

		if e := recover(); e != nil {
			var buf = make([]byte, 8192)
			runtime.Stack(buf, true)

			err := fmt.Errorf("recover: %v Stack:%v", e, string(buf))
			log.SRELog.Error(err)

		}
		// log.SRELog.Info("Leave chekcConnState")
	}()

	if c == nil {
		return false
	}
	switch c.GetState().String() {
	case "IDLE", "CONNECTING", "READY":
		return true
	case "TRANSIENT_FAILURE", "SHUTDOWN":
		err := c.Close()
		if err != nil {
			log.SRELog.Error(err)
		}
		return false
	default:
		err := c.Close()
		if err != nil {
			log.SRELog.Error(err)
		}
		return false
	}
}

var InitConnPoolBlockedCh = make(chan struct{})

func InitConnPool() {
	defer func() {
		if e := recover(); e != nil {
			var buf = make([]byte, 8192)
			runtime.Stack(buf, true)

			err := fmt.Errorf("recover: %v Stack:%v", e, string(buf))
			log.SRELog.Error(err)
		}
	}()
	log.SRELog.Info("IN InitConnPool")
	ConnPoolSize = &conf.Config.GrpcConnPoolSize
	ConnPoolLock.Lock()
	ConnPool = make([]*grpc.ClientConn, *ConnPoolSize)
	ConnPoolThisInUse = make([]bool, *ConnPoolSize)
	ConnPoolLock.Unlock()
	for i := 0; i < *ConnPoolSize; i++ {
		var c *grpc.ClientConn
		var err error
		for {
			c, err = NewConn()
			if err != nil {
				// TODO
				defer func() {
					log.SRELog.Error(err)
				}()
				continue
			} else {
				break
			}
		}
		ConnPoolLock.Lock()
		ConnPool[i] = c
		ConnPoolLock.Unlock()
	}

	ConnPoolLock.Lock()
	log.SRELog.Info("IN InitConnPool-*ConnPoolSize-2 ", *ConnPoolSize, " ", len(ConnPool))
	ConnPoolLock.Unlock()

	InitConnPoolBlockedCh <- struct{}{}
}

var CheckConnPoolBlockedCh = make(chan struct{}, 1)
var sleepSeconds float64 = 1

func CheckConnPool() {

	defer func() {
		if e := recover(); e != nil {
			var buf = make([]byte, 8192)
			runtime.Stack(buf, true)

			err := fmt.Errorf("recover: %v Stack:%v", e, string(buf))
			log.SRELog.Error(err)
		}
	}()
	defer func() {
		// CheckConnPoolBlockedCh <- struct{}{}
	}()
	// TODO
	time.Sleep(time.Duration(int(sleepSeconds+1)) * time.Second)

	// log.SRELog.Info("IN CheckConnPool", " ", len(ConnPool))

	start := time.Now()
	for i, c := range ConnPool {
		if !chekcConnState(c) {
			var c1 *grpc.ClientConn
			var err error
			for {
				c1, err = NewConn()
				if err != nil {
					// TODO
					defer func() {
						log.SRELog.Error(err)
					}()
					continue
				} else {
					break
				}
			}
			ConnPoolLock.Lock()
			ConnPool[i] = c1
			ConnPoolLock.Unlock()
		}
	}
	elapsed := time.Since(start)
	sleepSeconds = elapsed.Seconds()
}

func GetAConnWithBlock() (*grpc.ClientConn, int) {
	defer func() {
		if e := recover(); e != nil {
			var buf = make([]byte, 8192)
			runtime.Stack(buf, true)

			err := fmt.Errorf("recover: %v Stack:%v", e, string(buf))
			log.SRELog.Error(err)
		}
	}()
	for {
		for i, c := range ConnPool {
			ConnPoolLock.Lock()
			if chekcConnState(c) && !ConnPoolThisInUse[i] {
				ConnPoolThisInUse[i] = true
				ConnPoolLock.Unlock()
				return c, i
			}
			ConnPoolLock.Unlock()
		}
		time.Sleep(time.Second)
	}
}

func ChangeStateConnPoolThisInUse(i int, b bool) {
	// 让调用者感受不到锁
	ConnPoolLock.Lock()
	ConnPoolThisInUse[i] = b
	ConnPoolLock.Unlock()
}
使Go程数量不断增加的错误代码
func NewClientOnce() pb.APPClient {
    conn, err := NewConn()
    if err != nil {
        for {
            conn, err = NewConn()
            if err == nil {
                break
            }
        }
    }
    return pb.NewAPPClient(conn)
}

func NewConn() (*grpc.ClientConn, error) {
    // TODO
    var tlsConfig = func() *tls.Config {
        CertFile := conf.CertFile
        caFile := CertFile
        caCert, err := os.ReadFile(caFile)
        log.LogThenPanic(err)

        caCertPool := x509.NewCertPool()
        caCertPool.AppendCertsFromPEM(caCert)

        keyPEMBlock := []byte(keyPEMBlockStrTODO)
        _, err = tls.X509KeyPair(caCert, keyPEMBlock)
        log.LogThenPanic(err)

        config := &tls.Config{
            RootCAs:            caCertPool,
            InsecureSkipVerify: true,
        }
        return config
    }()

    var opts = func() []grpc.DialOption {
        creds := credentials.NewTLS(tlsConfig)
        AccessToken := conf.Config.AccessToken
        perRPC, err := NewCustomerPerRPCCredentials(AccessToken)
        log.LogThenPanic(err)
        bytes := 1024 * 1024 * 4 * 4
        cp := grpc.ConnectParams{}
        cp.MinConnectTimeout = 16 * time.Second
        co := []grpc.CallOption{grpc.UseCompressor(gzip.Name)}
        opts := []grpc.DialOption{
            grpc.WithTransportCredentials(creds),
            grpc.WithBlock(),
            grpc.WithDefaultCallOptions(grpc.MaxCallRecvMsgSize(bytes)),
            grpc.WithConnectParams(cp),
            grpc.WithDefaultCallOptions(co...),
            grpc.WithPerRPCCredentials(perRPC),
        }
        return opts
    }()

    // var target = utils.ConcatStr(conf.Config.SrvAddr, ":50053")
    var target = utils.ConcatStr(conf.Config.SrvAddr)

    grpc.UseCompressor(gzip.Name)
    return grpc.Dial(target, opts...)
}

C:\Users\u\go\pkg\mod\google.golang.org\grpc@v1.51.0\clientconn.go


// The target name syntax is defined in
// https://github.com/grpc/grpc/blob/master/doc/naming.md.
// e.g. to use dns resolver, a "dns:///" prefix should be applied to the target.
func DialContext(ctx context.Context, target string, opts ...DialOption) (conn *ClientConn, err error) {
    cc := &ClientConn{
        target:            target,
        csMgr:             &connectivityStateManager{},
        conns:             make(map[*addrConn]struct{}),
        dopts:             defaultDialOptions(),
        blockingpicker:    newPickerWrapper(),
        czData:            new(channelzData),
        firstResolveEvent: grpcsync.NewEvent(),
    }
    cc.retryThrottler.Store((*retryThrottler)(nil))
    cc.safeConfigSelector.UpdateConfigSelector(&defaultConfigSelector{nil})
    cc.ctx, cc.cancel = context.WithCancel(context.Background())

    for _, opt := range extraDialOptions {
        opt.apply(&cc.dopts)
    }

    for _, opt := range opts {
        opt.apply(&cc.dopts)
    }

    chainUnaryClientInterceptors(cc)
    chainStreamClientInterceptors(cc)

    defer func() {
        if err != nil {
            cc.Close()
        }
    }()

    pid := cc.dopts.channelzParentID
    cc.channelzID = channelz.RegisterChannel(&channelzChannel{cc}, pid, target)
    ted := &channelz.TraceEventDesc{
        Desc:     "Channel created",
        Severity: channelz.CtInfo,
    }
    if cc.dopts.channelzParentID != nil {
        ted.Parent = &channelz.TraceEventDesc{
            Desc:     fmt.Sprintf("Nested Channel(id:%d) created", cc.channelzID.Int()),
            Severity: channelz.CtInfo,
        }
    }
    channelz.AddTraceEvent(logger, cc.channelzID, 1, ted)
    cc.csMgr.channelzID = cc.channelzID

    if cc.dopts.copts.TransportCredentials == nil && cc.dopts.copts.CredsBundle == nil {
        return nil, errNoTransportSecurity
    }
    if cc.dopts.copts.TransportCredentials != nil && cc.dopts.copts.CredsBundle != nil {
        return nil, errTransportCredsAndBundle
    }
    if cc.dopts.copts.CredsBundle != nil && cc.dopts.copts.CredsBundle.TransportCredentials() == nil {
        return nil, errNoTransportCredsInBundle
    }
    transportCreds := cc.dopts.copts.TransportCredentials
    if transportCreds == nil {
        transportCreds = cc.dopts.copts.CredsBundle.TransportCredentials()
    }
    if transportCreds.Info().SecurityProtocol == "insecure" {
        for _, cd := range cc.dopts.copts.PerRPCCredentials {
            if cd.RequireTransportSecurity() {
                return nil, errTransportCredentialsMissing
            }
        }
    }

    if cc.dopts.defaultServiceConfigRawJSON != nil {
        scpr := parseServiceConfig(*cc.dopts.defaultServiceConfigRawJSON)
        if scpr.Err != nil {
            return nil, fmt.Errorf("%s: %v", invalidDefaultServiceConfigErrPrefix, scpr.Err)
        }
        cc.dopts.defaultServiceConfig, _ = scpr.Config.(*ServiceConfig)
    }
    cc.mkp = cc.dopts.copts.KeepaliveParams

    if cc.dopts.copts.UserAgent != "" {
        cc.dopts.copts.UserAgent += " " + grpcUA
    } else {
        cc.dopts.copts.UserAgent = grpcUA
    }

    if cc.dopts.timeout > 0 {
        var cancel context.CancelFunc
        ctx, cancel = context.WithTimeout(ctx, cc.dopts.timeout)
        defer cancel()
    }
    defer func() {
        select {
        case <-ctx.Done():
            switch {
            case ctx.Err() == err:
                conn = nil
            case err == nil || !cc.dopts.returnLastError:
                conn, err = nil, ctx.Err()
            default:
                conn, err = nil, fmt.Errorf("%v: %v", ctx.Err(), err)
            }
        default:
        }
    }()

    scSet := false
    if cc.dopts.scChan != nil {
        // Try to get an initial service config.
        select {
        case sc, ok := <-cc.dopts.scChan:
            if ok {
                cc.sc = &sc
                cc.safeConfigSelector.UpdateConfigSelector(&defaultConfigSelector{&sc})
                scSet = true
            }
        default:
        }
    }
    if cc.dopts.bs == nil {
        cc.dopts.bs = backoff.DefaultExponential
    }

    // Determine the resolver to use.
    resolverBuilder, err := cc.parseTargetAndFindResolver()
    if err != nil {
        return nil, err
    }
    cc.authority, err = determineAuthority(cc.parsedTarget.Endpoint, cc.target, cc.dopts)
    if err != nil {
        return nil, err
    }
    channelz.Infof(logger, cc.channelzID, "Channel authority set to %q", cc.authority)

    if cc.dopts.scChan != nil && !scSet {
        // Blocking wait for the initial service config.
        select {
        case sc, ok := <-cc.dopts.scChan:
            if ok {
                cc.sc = &sc
                cc.safeConfigSelector.UpdateConfigSelector(&defaultConfigSelector{&sc})
            }
        case <-ctx.Done():
            return nil, ctx.Err()
        }
    }
    if cc.dopts.scChan != nil {
        go cc.scWatcher()
    }

    var credsClone credentials.TransportCredentials
    if creds := cc.dopts.copts.TransportCredentials; creds != nil {
        credsClone = creds.Clone()
    }
    cc.balancerWrapper = newCCBalancerWrapper(cc, balancer.BuildOptions{
        DialCreds:        credsClone,
        CredsBundle:      cc.dopts.copts.CredsBundle,
        Dialer:           cc.dopts.copts.Dialer,
        Authority:        cc.authority,
        CustomUserAgent:  cc.dopts.copts.UserAgent,
        ChannelzParentID: cc.channelzID,
        Target:           cc.parsedTarget,
    })

    // Build the resolver.
    rWrapper, err := newCCResolverWrapper(cc, resolverBuilder)
    if err != nil {
        return nil, fmt.Errorf("failed to build resolver: %v", err)
    }
    cc.mu.Lock()
    cc.resolverWrapper = rWrapper
    cc.mu.Unlock()

    // A blocking dial blocks until the clientConn is ready.
    if cc.dopts.block {
        for {
            cc.Connect()
            s := cc.GetState()
            if s == connectivity.Ready {
                break
            } else if cc.dopts.copts.FailOnNonTempDialError && s == connectivity.TransientFailure {
                if err = cc.connectionError(); err != nil {
                    terr, ok := err.(interface {
                        Temporary() bool
                    })
                    if ok && !terr.Temporary() {
                        return nil, err
                    }
                }
            }
            if !cc.WaitForStateChange(ctx, s) {
                // ctx got timeout or canceled.
                if err = cc.connectionError(); err != nil && cc.dopts.returnLastError {
                    return nil, err
                }
                return nil, ctx.Err()
            }
        }
    }

    return cc, nil
}


C:\Users\C:\Users\u\go\pkg\mod\google.golang.org\grpc@v1.51.0\clientconn.go\go\pkg\mod\google.golang.org\grpc@v1.51.0\clientconn.go
-1
pprof/goroutine
379=148+107+106+4+2+1*12 哪些代码、业务逻辑产生的Go程
goroutine profile: total 379
148 @ 0x47beb6 0x48d02c 0xcb15f6 0x4ad2a1
#	0xcb15f5	google.golang.org/grpc.(*ccBalancerWrapper).watcher+0x155	C:/Users/u/go/pkg/mod/google.golang.org/grpc@v1.51.0/balancer_conn_wrappers.go:115

107 @ 0x47beb6 0x48d02c 0xbed745 0xbee365 0xbffc73 0x4ad2a1
#	0xbed744	google.golang.org/grpc/internal/transport.(*controlBuffer).get+0x1c4	C:/Users/u/go/pkg/mod/google.golang.org/grpc@v1.51.0/internal/transport/controlbuf.go:408
#	0xbee364	google.golang.org/grpc/internal/transport.(*loopyWriter).run+0x124	C:/Users/u/go/pkg/mod/google.golang.org/grpc@v1.51.0/internal/transport/controlbuf.go:535
#	0xbffc72	google.golang.org/grpc/internal/transport.newHTTP2Client.func6+0x112	C:/Users/u/go/pkg/mod/google.golang.org/grpc@v1.51.0/internal/transport/http2_client.go:442

106 @ 0x47beb6 0x471ed7 0x4a6bc9 0x568bdd 0x56ac0c 0x56c26d 0x5e3a91 0x607c51 0x7c0326 0x5a6793 0x7c0713 0x7bc3f7 0x7c525d 0x7c5261 0x828c33 0x519e5e 0xbd5276 0xbd51f9 0xbd63cf 0xc0f888 0x4ad2a1
#	0x4a6bc8	internal/poll.runtime_pollWait+0x88					C:/Program Files/Go/src/runtime/netpoll.go:305
#	0x568bdc	internal/poll.(*pollDesc).wait+0xbc					C:/Program Files/Go/src/internal/poll/fd_poll_runtime.go:84
#	0x56ac0b	internal/poll.execIO+0x28b						C:/Program Files/Go/src/internal/poll/fd_windows.go:175
#	0x56c26c	internal/poll.(*FD).Read+0x44c						C:/Program Files/Go/src/internal/poll/fd_windows.go:441
#	0x5e3a90	net.(*netFD).Read+0x50							C:/Program Files/Go/src/net/fd_posix.go:55
#	0x607c50	net.(*conn).Read+0xb0							C:/Program Files/Go/src/net/net.go:183
#	0x7c0325	crypto/tls.(*atLeastReader).Read+0x85					C:/Program Files/Go/src/crypto/tls/conn.go:787
#	0x5a6792	bytes.(*Buffer).ReadFrom+0x112						C:/Program Files/Go/src/bytes/buffer.go:202
#	0x7c0712	crypto/tls.(*Conn).readFromUntil+0x1f2					C:/Program Files/Go/src/crypto/tls/conn.go:809
#	0x7bc3f6	crypto/tls.(*Conn).readRecordOrCCS+0x416				C:/Program Files/Go/src/crypto/tls/conn.go:616
#	0x7c525c	crypto/tls.(*Conn).readRecord+0x29c					C:/Program Files/Go/src/crypto/tls/conn.go:582
#	0x7c5260	crypto/tls.(*Conn).Read+0x2a0						C:/Program Files/Go/src/crypto/tls/conn.go:1287
#	0x828c32	bufio.(*Reader).Read+0x4f2						C:/Program Files/Go/src/bufio/bufio.go:237
#	0x519e5d	io.ReadAtLeast+0xdd							C:/Program Files/Go/src/io/io.go:332
#	0xbd5275	io.ReadFull+0x95							C:/Program Files/Go/src/io/io.go:351
#	0xbd51f8	golang.org/x/net/http2.readFrameHeader+0x18				C:/Users/u/go/pkg/mod/golang.org/x/net@v0.0.0-20220722155237-a158d28d115b/http2/frame.go:237
#	0xbd63ce	golang.org/x/net/http2.(*Framer).ReadFrame+0x10e			C:/Users/u/go/pkg/mod/golang.org/x/net@v0.0.0-20220722155237-a158d28d115b/http2/frame.go:498
#	0xc0f887	google.golang.org/grpc/internal/transport.(*http2Client).reader+0x2a7	C:/Users/u/go/pkg/mod/google.golang.org/grpc@v1.51.0/internal/transport/http2_client.go:1561

4 @ 0x47beb6 0x471ed7 0x4a6bc9 0x568bdd 0x56ac0c 0x56c26d 0x5e3a91 0x607c51 0xe6a2ca 0xe6a575 0xe6a561 0xe69085 0xe61385 0x4ad2a1
#	0x4a6bc8	internal/poll.runtime_pollWait+0x88		C:/Program Files/Go/src/runtime/netpoll.go:305
#	0x568bdc	internal/poll.(*pollDesc).wait+0xbc		C:/Program Files/Go/src/internal/poll/fd_poll_runtime.go:84
#	0x56ac0b	internal/poll.execIO+0x28b			C:/Program Files/Go/src/internal/poll/fd_windows.go:175
#	0x56c26c	internal/poll.(*FD).Read+0x44c			C:/Program Files/Go/src/internal/poll/fd_windows.go:441
#	0x5e3a90	net.(*netFD).Read+0x50				C:/Program Files/Go/src/net/fd_posix.go:55
#	0x607c50	net.(*conn).Read+0xb0				C:/Program Files/Go/src/net/net.go:183
#	0xe6a2c9	CIT/internal/biz.Pinger+0x429			D:/code/App/internal/biz/utils.ping.go:149
#	0xe6a574	CIT/internal/biz.pingByip4Icmp.func1+0x74	D:/code/App/internal/biz/utils.ping.go:181
#	0xe6a560	CIT/internal/biz.pingByip4Icmp+0x60		D:/code/App/internal/biz/utils.ping.go:187
#	0xe69084	CIT/internal/biz.pongMixed+0x44			D:/code/App/internal/biz/utils.go:98
#	0xe61384	CIT/internal/biz.ConsumerHost2Ping.func2+0xc4	D:/code/App/internal/biz/ping.go:145

2 @ 0x47beb6 0x444470 0x444018 0x97a4a6 0x4ad2a1
#	0x97a4a5	github.com/natefinch/lumberjack.(*Logger).millRun+0x65	C:/Users/u/go/pkg/mod/github.com/natefinch/lumberjack@v2.0.0+incompatible/lumberjack.go:379

1 @ 0x46e8f6 0x4a67c5 0xe9df63 0xe9dd10 0xe99dbb 0xeaf65f 0xeb07f2 0x8f5c0e 0x8f8186 0x8fa882 0x8f3ec5 0x4ad2a1
#	0x4a67c4	runtime/pprof.runtime_goroutineProfileWithLabels+0x24	C:/Program Files/Go/src/runtime/mprof.go:846
#	0xe9df62	runtime/pprof.writeRuntimeProfile+0xe2			C:/Program Files/Go/src/runtime/pprof/pprof.go:723
#	0xe9dd0f	runtime/pprof.writeGoroutine+0x8f			C:/Program Files/Go/src/runtime/pprof/pprof.go:683
#	0xe99dba	runtime/pprof.(*Profile).WriteTo+0x1ba			C:/Program Files/Go/src/runtime/pprof/pprof.go:330
#	0xeaf65e	net/http/pprof.handler.ServeHTTP+0x57e			C:/Program Files/Go/src/net/http/pprof/pprof.go:253
#	0xeb07f1	net/http/pprof.Index+0x3b1				C:/Program Files/Go/src/net/http/pprof/pprof.go:371
#	0x8f5c0d	net/http.HandlerFunc.ServeHTTP+0x4d			C:/Program Files/Go/src/net/http/server.go:2109
#	0x8f8185	net/http.(*ServeMux).ServeHTTP+0xc5			C:/Program Files/Go/src/net/http/server.go:2487
#	0x8fa881	net/http.serverHandler.ServeHTTP+0x641			C:/Program Files/Go/src/net/http/server.go:2947
#	0x8f3ec4	net/http.(*conn).serve+0xbe4				C:/Program Files/Go/src/net/http/server.go:1991

1 @ 0x47a61f 0x4ae8fb 0xeb90b9 0x47bb1e 0x4ad2a1
#	0xeb90b8	main.main+0x1c18	D:/code/App/cmd/main_windows.go:149
#	0x47bb1d	runtime.main+0x1fd	C:/Program Files/Go/src/runtime/proc.go:250

1 @ 0x47beb6 0x44358c 0x4430fd 0xe6105f 0x4ad2a1
#	0xe6105e	CIT/internal/biz.ConsumerHost2Ping+0x27e	D:/code/App/internal/biz/ping.go:139

1 @ 0x47beb6 0x444470 0x443fd8 0xbffe67 0xbff42a 0xcc037e 0xcc0184 0xcbfc18 0xcbf2d8 0xcbc645 0x4ad2a1
#	0xbffe66	google.golang.org/grpc/internal/transport.newHTTP2Client.func5+0x66	C:/Users/u/go/pkg/mod/google.golang.org/grpc@v1.51.0/internal/transport/http2_client.go:391
#	0xbff429	google.golang.org/grpc/internal/transport.newHTTP2Client+0x33a9		C:/Users/u/go/pkg/mod/google.golang.org/grpc@v1.51.0/internal/transport/http2_client.go:454
#	0xcc037d	google.golang.org/grpc/internal/transport.NewClientTransport+0x5fd	C:/Users/u/go/pkg/mod/google.golang.org/grpc@v1.51.0/internal/transport/transport.go:587
#	0xcc0183	google.golang.org/grpc.(*addrConn).createTransport+0x403		C:/Users/u/go/pkg/mod/google.golang.org/grpc@v1.51.0/clientconn.go:1269
#	0xcbfc17	google.golang.org/grpc.(*addrConn).tryAllAddrs+0x557			C:/Users/u/go/pkg/mod/google.golang.org/grpc@v1.51.0/clientconn.go:1213
#	0xcbf2d7	google.golang.org/grpc.(*addrConn).resetTransport+0x217			C:/Users/u/go/pkg/mod/google.golang.org/grpc@v1.51.0/clientconn.go:1148
#	0xcbc644	google.golang.org/grpc.(*addrConn).connect+0xc4				C:/Users/u/go/pkg/mod/google.golang.org/grpc@v1.51.0/clientconn.go:803

1 @ 0x47beb6 0x444470 0x443fd8 0xc00169 0x4ad2a1
#	0xc00168	google.golang.org/grpc/internal/transport.newHTTP2Client.func4+0xc8	C:/Users/u/go/pkg/mod/google.golang.org/grpc@v1.51.0/internal/transport/http2_client.go:240

1 @ 0x47beb6 0x471ed7 0x4a6bc9 0x568bdd 0x56ac0c 0x56c26d 0x5e3a91 0x607c51 0x7c0326 0x5a6793 0x7c0713 0x7bc3f7 0x7c525d 0x7c5261 0x828c33 0x519e5e 0xbd5276 0xbd51f9 0xbd63cf 0xc0f345 0xc0f69a 0x4ad2a1
#	0x4a6bc8	internal/poll.runtime_pollWait+0x88						C:/Program Files/Go/src/runtime/netpoll.go:305
#	0x568bdc	internal/poll.(*pollDesc).wait+0xbc						C:/Program Files/Go/src/internal/poll/fd_poll_runtime.go:84
#	0x56ac0b	internal/poll.execIO+0x28b							C:/Program Files/Go/src/internal/poll/fd_windows.go:175
#	0x56c26c	internal/poll.(*FD).Read+0x44c							C:/Program Files/Go/src/internal/poll/fd_windows.go:441
#	0x5e3a90	net.(*netFD).Read+0x50								C:/Program Files/Go/src/net/fd_posix.go:55
#	0x607c50	net.(*conn).Read+0xb0								C:/Program Files/Go/src/net/net.go:183
#	0x7c0325	crypto/tls.(*atLeastReader).Read+0x85						C:/Program Files/Go/src/crypto/tls/conn.go:787
#	0x5a6792	bytes.(*Buffer).ReadFrom+0x112							C:/Program Files/Go/src/bytes/buffer.go:202
#	0x7c0712	crypto/tls.(*Conn).readFromUntil+0x1f2						C:/Program Files/Go/src/crypto/tls/conn.go:809
#	0x7bc3f6	crypto/tls.(*Conn).readRecordOrCCS+0x416					C:/Program Files/Go/src/crypto/tls/conn.go:616
#	0x7c525c	crypto/tls.(*Conn).readRecord+0x29c						C:/Program Files/Go/src/crypto/tls/conn.go:582
#	0x7c5260	crypto/tls.(*Conn).Read+0x2a0							C:/Program Files/Go/src/crypto/tls/conn.go:1287
#	0x828c32	bufio.(*Reader).Read+0x4f2							C:/Program Files/Go/src/bufio/bufio.go:237
#	0x519e5d	io.ReadAtLeast+0xdd								C:/Program Files/Go/src/io/io.go:332
#	0xbd5275	io.ReadFull+0x95								C:/Program Files/Go/src/io/io.go:351
#	0xbd51f8	golang.org/x/net/http2.readFrameHeader+0x18					C:/Users/u/go/pkg/mod/golang.org/x/net@v0.0.0-20220722155237-a158d28d115b/http2/frame.go:237
#	0xbd63ce	golang.org/x/net/http2.(*Framer).ReadFrame+0x10e				C:/Users/u/go/pkg/mod/golang.org/x/net@v0.0.0-20220722155237-a158d28d115b/http2/frame.go:498
#	0xc0f344	google.golang.org/grpc/internal/transport.(*http2Client).readServerPreface+0x84	C:/Users/u/go/pkg/mod/google.golang.org/grpc@v1.51.0/internal/transport/http2_client.go:1531
#	0xc0f699	google.golang.org/grpc/internal/transport.(*http2Client).reader+0xb9		C:/Users/u/go/pkg/mod/google.golang.org/grpc@v1.51.0/internal/transport/http2_client.go:1549

1 @ 0x47beb6 0x471ed7 0x4a6bc9 0x568bdd 0x56ac0c 0x56c26d 0x5e3a91 0x607c51 0x8e9af9 0x4ad2a1
#	0x4a6bc8	internal/poll.runtime_pollWait+0x88		C:/Program Files/Go/src/runtime/netpoll.go:305
#	0x568bdc	internal/poll.(*pollDesc).wait+0xbc		C:/Program Files/Go/src/internal/poll/fd_poll_runtime.go:84
#	0x56ac0b	internal/poll.execIO+0x28b			C:/Program Files/Go/src/internal/poll/fd_windows.go:175
#	0x56c26c	internal/poll.(*FD).Read+0x44c			C:/Program Files/Go/src/internal/poll/fd_windows.go:441
#	0x5e3a90	net.(*netFD).Read+0x50				C:/Program Files/Go/src/net/fd_posix.go:55
#	0x607c50	net.(*conn).Read+0xb0				C:/Program Files/Go/src/net/net.go:183
#	0x8e9af8	net/http.(*connReader).backgroundRead+0x78	C:/Program Files/Go/src/net/http/server.go:678

1 @ 0x47beb6 0x471ed7 0x4a6bc9 0x568bdd 0x56ac0c 0x5729fa 0x573008 0x5e6bf5 0x614145 0x611d88 0x8fb127 0x8fab05 0xeb6ea5 0xeb6dc6 0x4ad2a1
#	0x4a6bc8	internal/poll.runtime_pollWait+0x88	C:/Program Files/Go/src/runtime/netpoll.go:305
#	0x568bdc	internal/poll.(*pollDesc).wait+0xbc	C:/Program Files/Go/src/internal/poll/fd_poll_runtime.go:84
#	0x56ac0b	internal/poll.execIO+0x28b		C:/Program Files/Go/src/internal/poll/fd_windows.go:175
#	0x5729f9	internal/poll.(*FD).acceptOne+0xd9	C:/Program Files/Go/src/internal/poll/fd_windows.go:942
#	0x573007	internal/poll.(*FD).Accept+0x307	C:/Program Files/Go/src/internal/poll/fd_windows.go:976
#	0x5e6bf4	net.(*netFD).accept+0x74		C:/Program Files/Go/src/net/fd_windows.go:139
#	0x614144	net.(*TCPListener).accept+0x44		C:/Program Files/Go/src/net/tcpsock_posix.go:142
#	0x611d87	net.(*TCPListener).Accept+0x67		C:/Program Files/Go/src/net/tcpsock.go:288
#	0x8fb126	net/http.(*Server).Serve+0x5a6		C:/Program Files/Go/src/net/http/server.go:3070
#	0x8fab04	net/http.(*Server).ListenAndServe+0xc4	C:/Program Files/Go/src/net/http/server.go:2999
#	0xeb6ea4	net/http.ListenAndServe+0x104		C:/Program Files/Go/src/net/http/server.go:3255
#	0xeb6dc5	main.bizFunc.func1+0x25			D:/code/App/cmd/main.go:63

1 @ 0x47beb6 0x48d02c 0xcb9973 0xcb77c5 0xd06811 0xd06817 0xd05f8a 0xe5ec8d 0xeb6f65 0x4ad2a1
#	0xcb9972	google.golang.org/grpc.(*ClientConn).WaitForStateChange+0x112	C:/Users/u/go/pkg/mod/google.golang.org/grpc@v1.51.0/clientconn.go:515
#	0xcb77c4	google.golang.org/grpc.DialContext+0x2504			C:/Users/u/go/pkg/mod/google.golang.org/grpc@v1.51.0/clientconn.go:321
#	0xd06810	google.golang.org/grpc.Dial+0xd0				C:/Users/u/go/pkg/mod/google.golang.org/grpc@v1.51.0/clientconn.go:105
#	0xd06816	CIT/internal/server.NewConn+0xd6				D:/code/App/internal/server/conn.go:101
#	0xd05f89	CIT/internal/server.NewClientOnce+0x29				D:/code/App/internal/server/cli.go:10
#	0xe5ec8c	CIT/internal/biz.OIDGet+0xcc					D:/code/App/internal/biz/OIDValSerialize.go:39
#	0xeb6f64	main.bizFunc.func4+0x24						D:/code/App/cmd/main.go:86

1 @ 0x47beb6 0x4a9e9c 0xe60945 0xeb6f25 0x4ad2a1
#	0x4a9e9b	time.Sleep+0x13b				C:/Program Files/Go/src/runtime/time.go:195
#	0xe60944	CIT/internal/biz.ProducerHost2Ping+0x684	D:/code/App/internal/biz/ping.go:97
#	0xeb6f24	main.bizFunc.func3+0x24				D:/code/App/cmd/main.go:75

1 @ 0x47beb6 0x4a9e9c 0xe6207e 0xe62234 0x4ad2a1
#	0x4a9e9b	time.Sleep+0x13b				C:/Program Files/Go/src/runtime/time.go:195
#	0xe6207d	CIT/internal/biz.ReporterHost2Ping.func2+0x55d	D:/code/App/internal/biz/ping.go:214
#	0xe62233	CIT/internal/biz.ReporterHost2Ping+0x53		D:/code/App/internal/biz/ping.go:242

1 @ 0x47beb6 0x4a9e9c 0xeb6eef 0x4ad2a1
#	0x4a9e9b	time.Sleep+0x13b	C:/Program Files/Go/src/runtime/time.go:195
#	0xeb6eee	main.bizFunc.func2+0x2e	D:/code/App/cmd/main.go:70
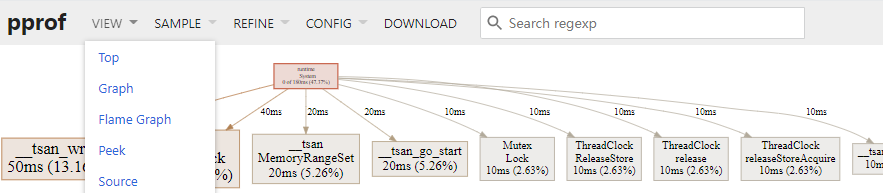
1、
go tool pprof http://host:port/debug/pprof/profile -seconds 20
Saved profile in C:\Users\uabc\pprof\pprof.samples.cpu.003.pb.gz
type "help <cmd|option>" for more information
(pprof)
(pprof)web

不同方法消耗时间的差异
go tool pprof -http=:8081 pprof.samples.cpu.003.pb.gz
Serving web UI on http://localhost:8081
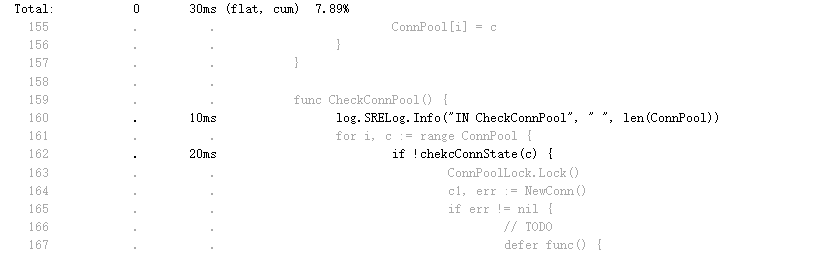
func CheckConnPool() {
	log.SRELog.Info("IN CheckConnPool", " ", len(ConnPool))
	for i, c := range ConnPool {
		if !chekcConnState(c) {
			ConnPoolLock.Lock()
			c1, err := NewConn()
			if err != nil {
				// TODO
				defer func() {
					log.SRELog.Error(err)
				}()
				ConnPoolLock.Unlock()
				continue
			}
			ConnPool[i] = c1
			ConnPoolLock.Unlock()
		}
	}
}
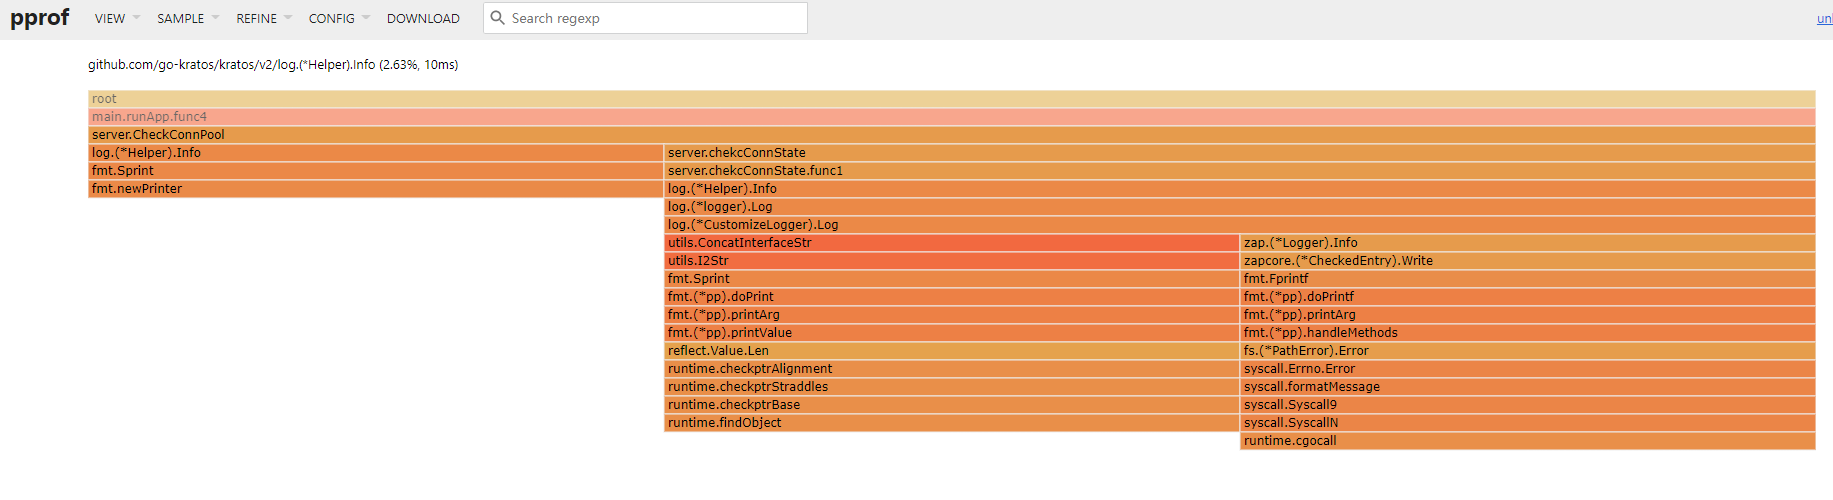
打日志,占用了该方法消耗的时间中占比 1/3
go pprof火焰图性能优化 - 知乎 https://zhuanlan.zhihu.com/p/71529062
使用生成火焰图优化
- 获取cpuprofile
获取最近10秒程序运行的cpuprofile,-seconds参数不填默认为30。
go tool pprof http://127.0.0.1:8080/debug/pprof/profile -seconds 10等10s后会生成一个: pprof.samples.cpu.001.pb.gz文件
2. 生成火焰图
go tool pprof -http=:8081 ~/pprof/pprof.samples.cpu.001.pb.gz其中-http=:8081会启动一个http服务,端口为8081,然后浏览器会弹出此文件的图解:
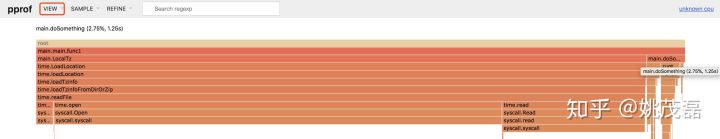 图1: 火焰图优化
图中,从上往下是方法的调用栈,长度代表cpu时长。
进一步分析优化
Profiles
Each link below displays a global profile in zoomable graph form as produced by pprof's "web" command. In addition there is a link to download the profile for offline analysis with pprof. All four profiles represent causes of delay that prevent a goroutine from running on a logical processor: because it was waiting for the network, for a synchronization operation on a mutex or channel, for a system call, or for a logical processor to become available.
- Network blocking profile (⬇)
- Synchronization blocking profile (⬇)
- Syscall blocking profile (⬇)
- Scheduler latency profile (⬇)
Network blocking profile (⬇)

Synchronization blocking profile (⬇)

Syscall blocking profile (⬇)

Scheduler latency profile (⬇)

实践:
1、curl http://ip:port/debug/pprof/trace?seconds=20 > trace.out
2、
go tool trace trace.out
2022/09/15 14:23:41 Parsing trace...
2022/09/15 14:23:41 Splitting trace...
2022/09/15 14:23:41 Opening browser. Trace viewer is listening on http://127.0.0.1:62903
1)分析go程数量
http://127.0.0.1:62903/goroutines
http://127.0.0.1:62903/goroutines

Goroutines:
APP/internal/SRE.(*SREClient).IMAlert N=208
main.runApp.func4 N=1
net/http.(*http2clientStream).doRequest N=208
net/http.(*http2ClientConn).readLoop N=1
main.runApp.func6 N=1
APP/internal/biz.OIDSaveRet.func4 N=6
runtime.gcBgMarkWorker N=12
main.runApp.func8 N=1
google.golang.org/grpc/internal/transport.(*http2Client).reader N=3
google.golang.org/grpc/credentials.(*tlsCreds).ClientHandshake.func1 N=1
runtime.bgsweep N=1
google.golang.org/grpc/internal/transport.newHTTP2Client.func3 N=3
golang.org/x/sys/windows/svc.serviceMain.func2 N=1
google.golang.org/grpc.(*addrConn).connect N=1
google.golang.org/grpc.(*ccBalancerWrapper).watcher N=2
runtime.bgscavenge N=1
APP/internal/biz.OIDSNMP.func3.5 N=2
main.runApp N=40
net/http.(*conn).serve N=1
runtime/trace.Start.func1 N=1
net.(*netFD).connect.func2 N=1
google.golang.org/grpc.(*ccResolverWrapper).resolveNow N=1
N=25
排查代码
package log

import (
	"APP/internal/SRE"
	"APP/internal/utils"
	"fmt"
	"os"

	"github.com/go-kratos/kratos/v2/log"
	"go.uber.org/zap"
	"go.uber.org/zap/zapcore"
)

type CustomizeLogger struct {
	log    *zap.Logger
	Sync   func() error
	sreCli *SRE.SREClient
}

// Log Implementation of logger interface
func (l *CustomizeLogger) Log(level log.Level, keyvals ...interface{}) error {
	if len(keyvals) == 0 || len(keyvals)%2 != 0 {
		l.log.Warn(fmt.Sprint("Keyvalues must appear in pairs: ", keyvals))
		return nil
	}

	// Zap.Field is used when keyvals pairs appear
	var data []zap.Field
	for i := 0; i < len(keyvals); i += 2 {
		data = append(data, zap.Any(fmt.Sprint(keyvals[i]), fmt.Sprint(keyvals[i+1])))
	}

	// runtimeInfo := utils.ConcatStr(utils.ConcatInterfaceStr(utils.MemStats()), utils.Hostname(), " ", os.Getenv("USER"), utils.ConcatStr(utils.GetLocalIPs()...))
	// runtimeInfo := utils.ConcatStr(utils.ConcatInterfaceStr(utils.MemStats()), utils.Hostname())
	runtimeInfo := utils.ConcatStr(utils.ConcatInterfaceStr(utils.MemStats()))
	data = append(data, zap.String("runtime", runtimeInfo))

	switch level {
	case log.LevelDebug:

		l.log.Debug("", data...)
		go l.sreCli.IMAlert(-1, "Debug", nil, data)
	case log.LevelInfo:
		l.log.Info("", data...)
	case log.LevelWarn:
		l.log.Warn("", data...)
	case log.LevelError:
		l.log.Error("", data...)
		go l.sreCli.IMAlert(-2, "Error", nil, data)

	}

	return nil
}

const PathSeparator = string(os.PathSeparator)

// zap package - go.uber.org/zap - pkg.go.dev https://pkg.go.dev/go.uber.org/zap
func NewCustomizeLogger(Filename string, Extend ...interface{}) *CustomizeLogger {
	// For some users, the presets offered by the NewProduction, NewDevelopment,
	// and NewExample constructors won't be appropriate. For most of those
	// users, the bundled Config struct offers the right balance of flexibility
	// and convenience. (For more complex needs, see the AdvancedConfiguration
	// example.)
	//
	// See the documentation for Config and zapcore.EncoderConfig for all the
	// available options.

	// First, define our level-handling logic.
	highPriority := zap.LevelEnablerFunc(func(lvl zapcore.Level) bool {
		return lvl >= zapcore.ErrorLevel
	})
	lowPriority := zap.LevelEnablerFunc(func(lvl zapcore.Level) bool {
		return lvl < zapcore.ErrorLevel
	})

	en := func() zapcore.EncoderConfig {
		return zapcore.EncoderConfig{
			TimeKey:        "ts",
			LevelKey:       "level",
			NameKey:        "logger",
			CallerKey:      "caller",
			FunctionKey:    zapcore.OmitKey,
			MessageKey:     "msg",
			StacktraceKey:  "stacktrace",
			LineEnding:     zapcore.DefaultLineEnding,
			EncodeLevel:    zapcore.CapitalLevelEncoder,
			EncodeTime:     zapcore.ISO8601TimeEncoder,
			EncodeDuration: zapcore.SecondsDurationEncoder,
			EncodeCaller:   zapcore.ShortCallerEncoder,
		}
	}
	// zap package - go.uber.org/zap - pkg.go.dev https://pkg.go.dev/go.uber.org/zap
	// The bundled Config struct only supports the most common configuration
	// options. More complex needs, like splitting logs between multiple files
	// or writing to non-file outputs, require use of the zapcore package.
	coreHighPriority := zapcore.NewCore(
		zapcore.NewConsoleEncoder(en()),
		zapcore.NewMultiWriteSyncer(
			zapcore.AddSync(os.Stdout),
			zapcore.AddSync(IoWriter4SplitFile(Filename+"-ERROR.log")),
		),
		highPriority)
	coreLowPriority := zapcore.NewCore(
		zapcore.NewJSONEncoder(en()),
		zapcore.NewMultiWriteSyncer(
			zapcore.AddSync(os.Stdout),
			zapcore.AddSync(IoWriter4SplitFile(Filename+"-DEBUG.log")),
		),
		lowPriority)
	opts := []zap.Option{
		zap.AddStacktrace(zapcore.WarnLevel),
	}
	core := zapcore.NewTee(
		coreHighPriority,
		coreLowPriority,
	)
	l := zap.New(core, opts...)

	sreCli := &SRE.SREClient{}
	if len(Extend) > 0 {
		QywxIMAlert := Extend[0].(string)
		sreCli.QywxIMAlertRobot = QywxIMAlert
	}
	return &CustomizeLogger{log: l, Sync: l.Sync, sreCli: sreCli}
}
问题定位:
在打日志环节,对于日志信息,开启go程时,没有限制数量,导致内存可能不断增长,内存溢出。
将打日志环节的Debug替换为Info,初步修复后:
Goroutines:
os/exec.(*Cmd).Start.func2 N=5
main.runApp.func6 N=1
main.runApp.func4 N=1
runtime.gcBgMarkWorker N=11
main.runApp.func3 N=1
APP/internal/biz.OIDSaveRet.func4 N=1
main.runApp.func8 N=1
runtime.bgsweep N=1
google.golang.org/grpc/internal/transport.newHTTP2Client.func3 N=1
golang.org/x/sys/windows/svc.serviceMain.func2 N=1
google.golang.org/grpc/internal/transport.(*http2Client).reader N=1
net.lookupProtocol.func1 N=6
net/http.(*conn).serve N=1
runtime.bgscavenge N=1
main.runApp N=40
runtime/trace.Start.func1 N=1
N=25
Goroutines:
APP/internal/biz.OIDSaveRet.func4 N=50
runtime.gcBgMarkWorker N=11
google.golang.org/grpc/internal/transport.newHTTP2Client.func3 N=1
main.runApp.func4 N=1
main.runApp.func8 N=1
google.golang.org/grpc/internal/transport.(*http2Client).reader N=1
net/http.(*persistConn).addTLS.func2 N=2
APP/internal/biz.OIDSNMP.func3.5 N=7
APP/internal/biz.OIDSNMP.func5 N=5
runtime.bgsweep N=1
golang.org/x/sys/windows/svc.serviceMain.func2 N=1
APP/internal/SRE.(*SREClient).IMAlert N=3
net/http.(*http2ClientConn).readLoop N=1
net/http.(*Transport).dialConnFor N=2
net/http.(*conn).serve N=1
net.(*Resolver).lookupIP.func2 N=1
net/http.(*http2clientStream).doRequest N=3
runtime.bgscavenge N=1
main.runApp.func7 N=1
internal/singleflight.(*Group).doCall N=1
net/http.(*http2addConnCall).run N=1
main.runApp N=40
crypto/tls.(*Conn).Close N=1
net/http.(*persistConn).closeConnIfStillIdle N=2
net.(*netFD).connect.func2 N=2
runtime/trace.Start.func1 N=1
N=31
go程分布、数量明显变化。
3、 进一步优化 时间消耗
https://graphviz.org/download/
小结:
1、
- 性能查看工具 pprof,trace 及压测工具 wrk 或其他压测工具的使用要比较了解。
- 代码逻辑层面的走读非常重要,要尽量避免无效逻辑。
- 对于 golang 自身库存在缺陷的,可以寻找第三方库或自己改造。
- golang 版本尽量更新,这次的测试是在 golang1.12 下进行的。而 go1.13 甚至 go1.14 在很多地方进行了改进。比如 fmt.Sprintf,sync.Pool 等。替换成新版本应该能进一步提升性能。
- 本地 benchmark 结果不等于线上运行结果。尤其是在使用缓存来提高处理速度时,要考虑 GC 的影响。
- 传参数或返回值时,尽量按 golang 的设计哲学,少用指针,多用值对象,避免引起过多的变量逃逸,导致 GC 耗时暴涨。struct 的大小一般在 2K 以下的拷贝传值,比使用指针要快(可针对不同的机器压测,判断各自的阈值)。
- 值类型在满足需要的情况下,越小越好。能用 int8,就不要用 int64。
- 资源尽量复用,在 golang1.13 以上,可以考虑使用 sync.Pool 缓存会重复申请的内存或对象。或者自己使用并管理大块内存,用来存储小对象,避免 GC 影响(如本地缓存的场景)。
2、
并发处理
并发操作的问题主要出现在资源竞争上,常见的有:
- 死锁/活锁导致大量阻塞,性能严重下降。
- 资源竞争激烈:大量的线程或协程抢夺一个锁。
- 临界区过大:将不必要的操作也放入临界区,导致锁的释放速度过慢,引起其他线程或协程阻塞。
3、
协程调度
Golang 调度是非抢占式多任务处理,由协程主动交出控制权。遇到如下条件时,才有可能交出控制权
- I/O,select
- channel
- 等待锁
- 函数调用(是一个切换的机会,是否会切换由调度器决定)
- runtime.Gosched()
因此,若存在较长时间的 for 循环处理,并且循环内没有上述逻辑时,会阻塞住其他的协程调度。在实际编码中一定要注意。
4、
GC 处理
GC 的工作就是确定哪些内存可以释放,它是通过扫描内存查找内存分配的指针来完成这个工作的。GC 触发时机:
- 到达堆阈值:默认情况下,它将在堆大小加倍时运行,可通过 GOGC 来设定更高阈值(不建议变更此配置)
- 到达时间阈值:每两分钟会强制启动一次 GC 循环
为啥要注意 GC,是因为 GC 时出现 2 次 Stop the world,即停止所有协程,进行扫描操作。若是 GC 耗时高,则会严重影响服务器性能。
5、
变量逃逸
注意,golang 中的栈是跟函数绑定的,函数结束时栈被回收。
变量内存回收:
-
如果分配在栈中,则函数执行结束可自动将内存回收;
-
如果分配在堆中,则函数执行结束可交给 GC(垃圾回收)处理;
而变量逃逸就意味着增加了堆中的对象个数,影响 GC 耗时。一般要尽量避免逃逸。
逃逸分析不变性:
- 指向栈对象的指针不能存在于堆中;
- 指向栈对象的指针不能在栈对象回收后存活;
在逃逸分析过程中,凡是发现出现违反上述约定的变量,就将其移到堆中。
逃逸常见的情况:
- 指针逃逸:返回局部变量的地址(不变性 2)
- 栈空间不足
- 动态类型逃逸:如 fmt.Sprintf,json.Marshel 等接受变量为...interface{}函数的调用,会导致传入的变量逃逸。
- 闭包引用
Golang 性能优化实战
-
# 下载cpu profile
go tool pprof http://ip:port/debug/pprof/profile?seconds=120 # 等待120s,不带此参数时等待30s

# 下载heap profile
go tool pprof http://ip:port/debug/pprof/heap

# 下载goroutine profile
go tool pprof http://ip:port/debug/pprof/goroutine

# 下载block profile
go tool pprof http://ip:port/debug/pprof/block

# 下载mutex profile
go tool pprof http://ip:port/debug/pprof/mutex

# 下载20秒的trace记录(遇到棘手问题时,查看trace会比较容易定位)
 curl http://100.97.1.35:10078/debug/pprof/trace?seconds=20 > trace.out
go tool trace trace.out 查看 -
直接在终端中通过 pprof 命令查看
-
sz 上面命令执行时出现的
Saved profile in /root/pprof/pprof.binary.alloc_objects.xxxxxxx.xxxx.pb.gz到本地 -
在本地环境,执行
go tool pprof -http=":8081" pprof.binary.alloc_objects.xxxxxxx.xxxx.pb.gz即可直接通过http://localhost:8081页面查看。包括topN,火焰图信息等,会更方便一点。
GC Trace
golang 具备 GC 功能,而 GC 是最容易被忽视的性能影响因素。尤其是在本地使用 benchmark 测试时,由于时间较短,占用内存较少。往往不会触发 GC。而一旦线上出现 GC 问题,又不太好定位。目前常用的定位方式有两种:
本地 gctrace
-
在执行程序前加
GODEBUG=gctrace=1,每次 gc 时会输出一行如下内容gc 1 @0.001s 11%: 0.007+1.5+0.004 ms clock, 0.089+1.5/2.8/0.27+0.054 ms cpu, 4->4->3 MB, 5 MB goal, 12 P
scvg: inuse: 4, idle: 57, sys: 62, released: 57, consumed: 4 (MB) -
也通过日志转为图形化:
GODEBUG=gctrace=1 godoc -index -http=:6060 2> stderr.log
cat stderr.log | gcvis - inuse:使用了多少 M 内存
- idle:剩下要清除的内存
- sys:系统映射的内存
- released:释放的系统内存
- consumed:申请的系统内存
-
gc 1 表示第 1 次 gc
-
@0.001s 表示程序执行的总时间
-
11% 表示垃圾回收时间占用总的运行时间百分比
-
0.007+1.5+0.004 ms clock 表示工作线程完成 GC 的 stop-the-world,sweeping,marking 和 waiting 的时间
-
0.089+1.5/2.8/0.27+0.054 ms cpu 垃圾回收占用 cpu 时间
-
4->4->3 MB 表示堆的大小,gc 后堆的大小,存活堆的大小
-
5 MB goal 整体堆的大小
-
12 P 使用的处理器数量
-
scvg: inuse: 4, idle: 57, sys: 62, released: 57, consumed: 4 (MB) 表示系统内存回收信息
-
采用图形化的方式查看:https://github.com/davecheney/gcvis
GODEBUG=gctrace=1 go test -v *.go -bench=. -run=none -benchtime 3m |& gcvis
线上 trace
在线上业务中添加net/http/pprof后,可通过下列命令采集 20 秒的 trace 信息
curl http://ip:port/debug/pprof/trace?seconds=20 > trace.out
再通过go tool trace trace.out 即可在本地浏览器中查看 trace 信息。
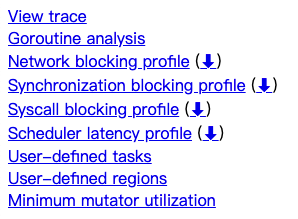
- View trace:查看跟踪
- Goroutine analysis:Goroutine 分析
- Network blocking profile:网络阻塞概况
- Synchronization blocking profile:同步阻塞概况
- Syscall blocking profile:系统调用阻塞概况
- Scheduler latency profile:调度延迟概况
- User defined tasks:用户自定义任务
- User defined regions:用户自定义区域
- Minimum mutator utilization:最低 Mutator 利用率
GC 相关的信息可以在 View trace 中看到
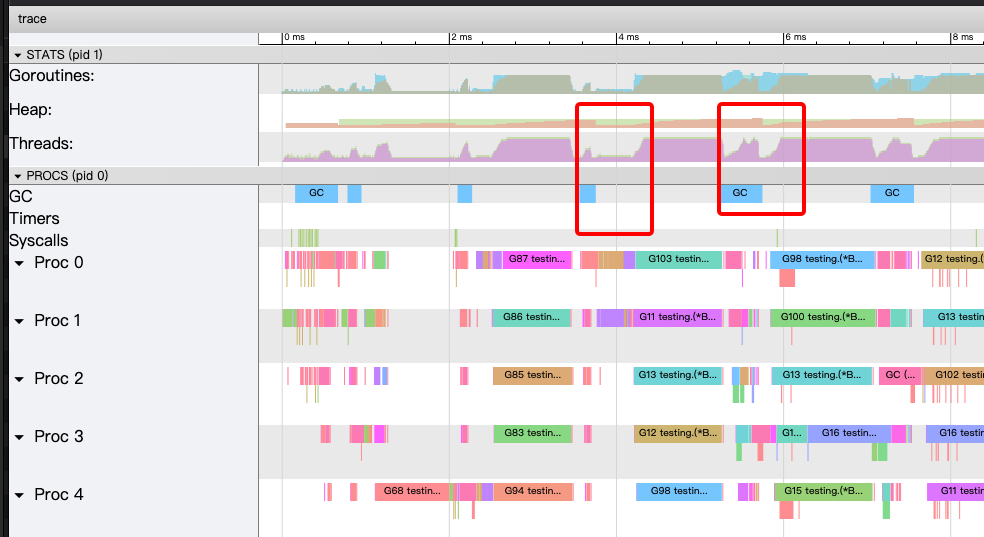
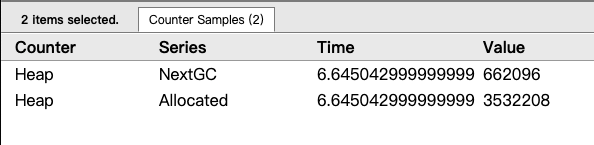
可通过点击 heap 的色块区域,查看 heap 信息。
点击 GC 对应行的蓝色色块,查看 GC 耗时及相关回收信息。
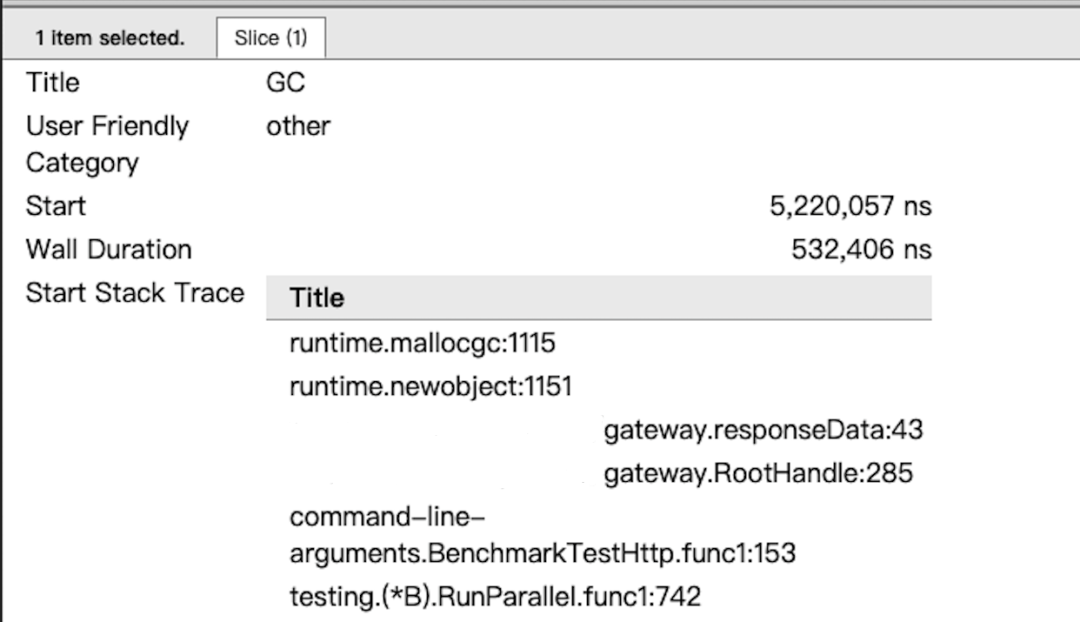
通过这两个信息就可以确认是否存在 GC 问题,以及造成高 GC 的可能原因。
使用问题
trace 的展示仅支持 chrome 浏览器。但是目前常用的 chrome 浏览器屏蔽了 go tool trace 使用的 HTML import 功能。即打开“view trace”时,会出现一片空白。并可以在 console 中看到警告信息:
HTML Imports is deprecated and has now been removed as of M80. See https://www.chromestatus.com/features/5144752345317376 and https://developers.google.com/web/updates/2019/07/web-components-time-to-upgrade for more details.
解决办法
申请 token
- https://developers.chrome.com/origintrials/#/register_trial/2431943798780067841 然后登录
- web origin 处填写 http://localhost:8001 端口只能是 8000 - 8003,支持 http 和 https。(也可以填写 127.0.0.1:8001,依赖于你浏览器中显示的地址,否则对不上的话,还要手动改一下)
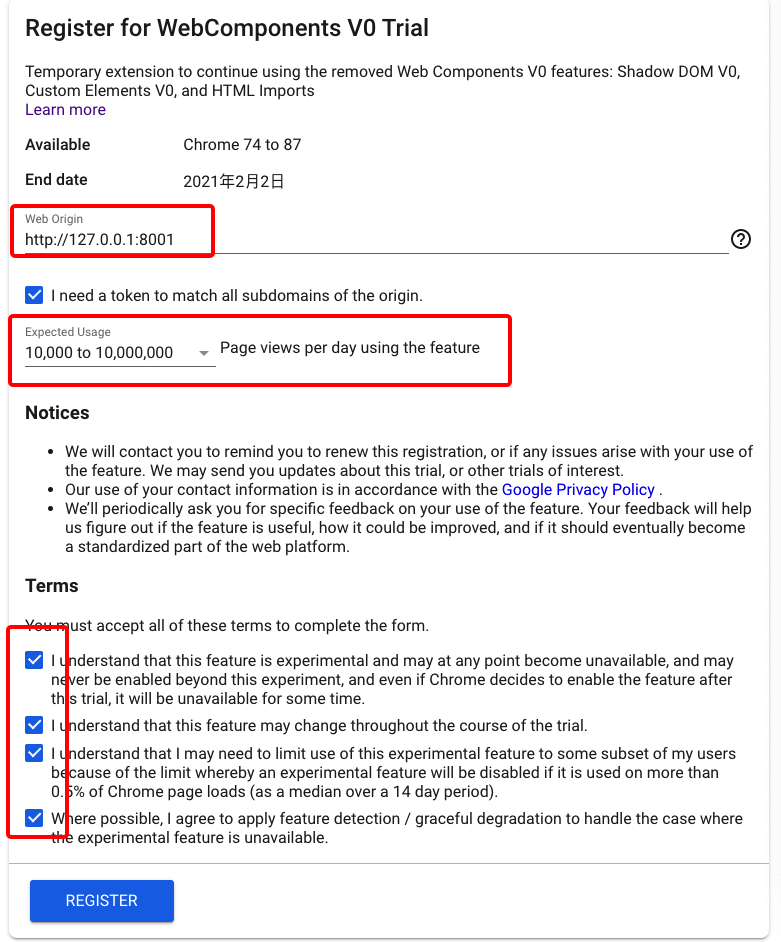
- 点击注册后即可看到 token
修改 trace.go
- 编辑${GOROOT}/src/cmd/trace/trace.go 文件,在文件中找到 templTrace 然后在 标签的下一行添加
<meta http-equiv="origin-trial" content="你复制的token">
重新编译 go
- ${GOROOT}/src 目录,执行 ./all.bash
- 若提示:
ERROR: Cannot find go1.4\bin\go Set GOROOT_BOOTSTRAP to a working Go tree >= Go 1.4则需要先安装一个 go1.4 的版本,再通过它来编译 go。(下载链接https://dl.google.com/go/go1.4-bootstrap-20171003.tar.gz) 在 go1.4/src 下执行./make.bash. 指定 GOROOT_BOOTSTRAP 为 go1.4 的根目录。然后就可以重新编译 go
查看 trace
go tool trace -http=localhost:8001 trace.out
若打开 view trace 还是空白,则检查一下浏览器地址栏中的地址,是否与注册时的一样。即注册用的 localhost 或 127.0.0.1 则地址栏中也要一样。
常见性能瓶颈
业务逻辑
出现无效甚至降低性能的逻辑。常见的有
- 逻辑重复:相同的操作在不同的位置做了多次或循环跳出的条件设置不当。
- 资源未复用:内存频繁申请和释放,数据库链接频繁建立和销毁等。
- 无效代码。
存储
未选择恰当的存储方式,常见的有:
- 临时数据存放到数据库中,导致频繁读写数据库。
- 将复杂的树状结构的数据用 SQL 数据库存储,出现大量冗余列,并且在读写时要进行拆解和拼接。
- 数据库表设计不当,无法有效利用索引查询,导致查询操作耗时高甚至出现大量慢查询。
- 热点数据未使用缓存,导致数据库负载过高,响应速度下降。
并发处理
并发操作的问题主要出现在资源竞争上,常见的有:
- 死锁/活锁导致大量阻塞,性能严重下降。
- 资源竞争激烈:大量的线程或协程抢夺一个锁。
- 临界区过大:将不必要的操作也放入临界区,导致锁的释放速度过慢,引起其他线程或协程阻塞。
golang 部分细节简介
在优化之前,我们需要对 golang 的实现细节有一个简单的了解,才能明白哪些地方有问题,哪些地方可以优化,以及怎么优化。以下内容的详细讲解建议查阅网上优秀的 blog。对语言的底层实现机制最好有个基本的了解,否则有时候掉到坑里都不知道为啥。
协程调度
Golang 调度是非抢占式多任务处理,由协程主动交出控制权。遇到如下条件时,才有可能交出控制权
- I/O,select
- channel
- 等待锁
- 函数调用(是一个切换的机会,是否会切换由调度器决定)
- runtime.Gosched()
因此,若存在较长时间的 for 循环处理,并且循环内没有上述逻辑时,会阻塞住其他的协程调度。在实际编码中一定要注意。
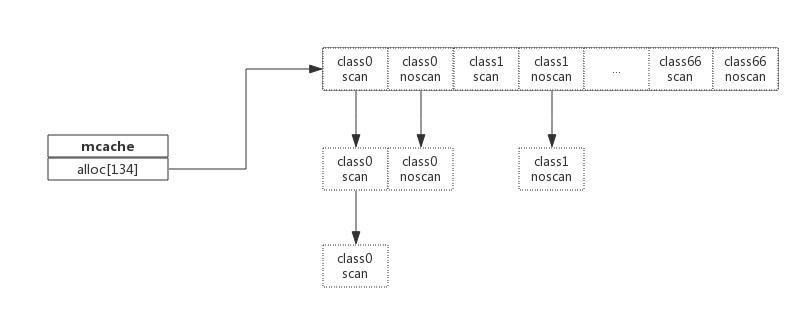
内存管理
Go 为每个逻辑处理器(P)提供了一个称为mcache的本地内存线程缓存。每个 mcache 中持有 67 个级别的 mspan。每个 msapn 又包含两种:scan(包含指针的对象)和 noscan(不包含指针的对象)。在进行垃圾收集时,GC 无需遍历 noscan 对象。
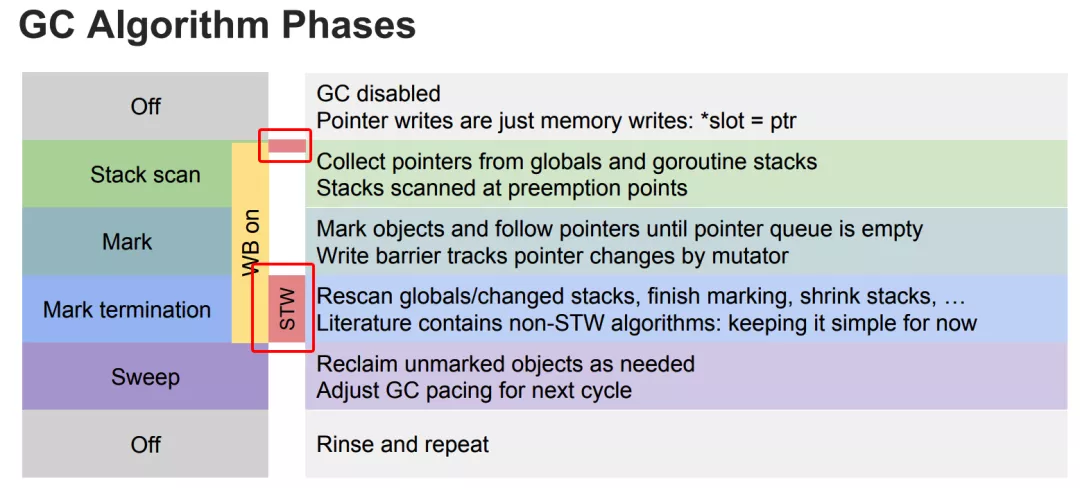
GC 处理
GC 的工作就是确定哪些内存可以释放,它是通过扫描内存查找内存分配的指针来完成这个工作的。GC 触发时机:
- 到达堆阈值:默认情况下,它将在堆大小加倍时运行,可通过 GOGC 来设定更高阈值(不建议变更此配置)
- 到达时间阈值:每两分钟会强制启动一次 GC 循环
为啥要注意 GC,是因为 GC 时出现 2 次 Stop the world,即停止所有协程,进行扫描操作。若是 GC 耗时高,则会严重影响服务器性能。
变量逃逸
注意,golang 中的栈是跟函数绑定的,函数结束时栈被回收。
变量内存回收:
-
如果分配在栈中,则函数执行结束可自动将内存回收;
-
如果分配在堆中,则函数执行结束可交给 GC(垃圾回收)处理;
而变量逃逸就意味着增加了堆中的对象个数,影响 GC 耗时。一般要尽量避免逃逸。
逃逸分析不变性:
- 指向栈对象的指针不能存在于堆中;
- 指向栈对象的指针不能在栈对象回收后存活;
在逃逸分析过程中,凡是发现出现违反上述约定的变量,就将其移到堆中。
逃逸常见的情况:
- 指针逃逸:返回局部变量的地址(不变性 2)
- 栈空间不足
- 动态类型逃逸:如 fmt.Sprintf,json.Marshel 等接受变量为...interface{}函数的调用,会导致传入的变量逃逸。
- 闭包引用
包含指针类型的底层结构
string
type StringHeader struct {
 Data uintptr
 Len  int
}
slice
type SliceHeader struct {
 Data uintptr
 Len  int
 Cap  int
}
map
type hmap struct {
 count     int
 flags     uint8
 B         uint8
 noverflow uint16
 hash0     uint32
 buckets    unsafe.Pointer
 oldbuckets unsafe.Pointer
 nevacuate  uintptr
 extra *mapextra
}
这些是常见会包含指针的对象。尤其是 string,在后台应用中大量出现。并经常会作为 map 的 key 或 value。若数据量较大时,就会引发 GC 耗时上升。同时,我们可以注意到 string 和 slice 非常相似,从某种意义上说它们之间是可以直接互相转换的。这就可以避免 string 和[]byte 之间类型转换时,进行内存拷贝
类型转换优化
func String(b []byte) string {
 return *(*string)(unsafe.Pointer(&b))
}
func Str2Bytes(s string) []byte {
 x := (*[2]uintptr)(unsafe.Pointer(&s))
 h := [3]uintptr{x[0], x[1], x[1]}
 return *(*[]byte)(unsafe.Pointer(&h))
}
性能测试方式
本地测试
将服务处理的核心逻辑,使用 go test 的 benchmark 加 pprof 来测试。建议上线前,就对整个业务逻辑的性能进行测试,提前优化瓶颈。
线上测试
一般 http 服务可以通过常见的测试工具进行压测,如 wrk,locust 等。taf 服务则需要我们自己编写一些测试脚本。同时,要注意的是,压测的目的是定位出服务的最佳性能,而不是盲目的高并发请求测试。因此,一般需要逐步提升并发请求数量,来定位出服务的最佳性能点。
注意:由于 taf 平台具备扩容功能,因此为了更准确的测试,我们应该在测试前关闭要测试节点的自动扩容。
实际项目优化
为了避免影响后端服务,也为了避免后端服务影响网关自身。因此,我们需要在压测前,将对后端服务的调用屏蔽。
- 测试准备:屏蔽远程调用:下游服务调用,健康度上报,统计上报,远程日志。以便关注网关自身性能。
QPS 现状
首先看下当前业务的性能指标,使用 wrk 压测网关服务

可以看出,在总链接数为 70 的时候,QPS 最高,为 13245。
火焰图
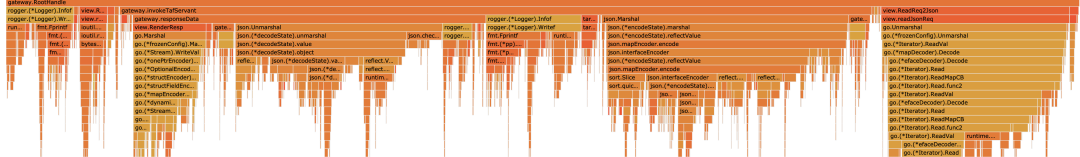
根据火焰图我们定位出 cpu 占比较高的几个方法为:
- json.Marshal
- json.Unmarshal
- rogger.Infof
为了方便测试,将代码改为本地运行,并通过 benchmark 的方式来对比修改前后的差异。
由于正式环境使用的 golang 版本为 1.12,因此本地测试时,也要使用同样的版本。
benchmark
Benchmark 50000000 3669 ns/op 4601 B/op 73 allocs/op
查看 cpu 和 memory 的 profile,发现健康度上报的数据结构填充占比较高。这部分逻辑基于 tars 框架实现。暂时忽略,为避免影响其他测试,先注释掉。再看看 benchmark。
Benchmark 500000 3146 ns/op 2069 B/op 55 allocs/op
优化策略
JSON 优化
先查看 json 解析的部分,看看是否有优化空间
请求处理
//RootHandle view.ReadReq2Json readJsonReq 中进行json解析
type GatewayReqBody struct {
 Header  GatewayReqBodyHeader   `json:"header"`
 Payload map[string]interface{} `json:"payload"`
}
func readJsonReq(data []byte, req *model.GatewayReqBody) error {
 dataMap := make(map[string]interface{})
 err := jsoniter.Unmarshal(data, &dataMap)
 ...
  headerMap, ok := header.(map[string]interface{})
  businessName, ok := headerMap["businessName"]
  qua, ok := headerMap["qua"]
  sessionId, ok := headerMap["sessionId"]
  ...
  payload, ok := dataMap["payload"]
  req.Payload, ok = payload.(map[string]interface{})
}
这个函数本质上将 data 解析为 model.GatewayReqBody 类型的结构体。但是这里却存在 2 个问题
- 使用了复杂的解析方式,先将 data 解析为 map,再通过每个字段的名字来取值,并进行类型转换。
- Req.Playload 解析为一个 map。但又未使用。我们看看后面这个 payload 是用来做啥。确认是否为无效代码。
func invokeTafServant(resp http.ResponseWriter, gatewayHttpReq *model.GatewayHttpReq) {
 ...
  payloadBytes, err := json.Marshal(gatewayHttpReq.ReqBody.Payload)
 if err == nil {
  commonReq.Payload = string(payloadBytes)
 } else {
  responseData(gatewayHttpReq, StatusInternalServerError, "封装json异常", "", resp)
  return
 }
  ...
 }
后续的使用中,我们可以看到,又将这个 payload 转为 string。因此,我们可以确定,上面的 json 解析是没有意义,同时也会浪费资源(payload 数据量一般不小)。
优化方法
-
golang 自带的 json 解析性能较低,这里我们可以替换为
github.com/json-iterator来提升性能 -
在 golang 中,遇到不需要解析的 json 数据,可以将其类型声明为
json.RawMessage. 即,可以将上述 2 个方法优化为
type GatewayReqBody struct {
 Header  GatewayReqBodyHeader `json:"header"`
 Payload json.RawMessage      `json:"payload"`
}
func readJsonReq(data []byte, req *model.GatewayReqBody) error {
 err := jsoniter.Unmarshal(data, req)
 if err != nil {
  return jsonParseErr
 }
 for k, v := range req.Header.Qua {
  req.Header.Qua[k] = v
  if len(req.Header.QuaStr) == 0 {
   req.Header.QuaStr = k + "=" + v
  } else {
   req.Header.QuaStr += "&" + k + "=" + v
  }
 }
 return nil
}
func invokeTafServant(resp http.ResponseWriter, gatewayHttpReq *model.GatewayHttpReq) {
 commonReq.Payload = string(gatewayHttpReq.ReqBody.Payload)
}
- 这里注意!出现了 string 和[]byte 之间的类型转换.为了避免内存拷贝,这里将 string()改为上面的类型转换优化中所定义的转换函数,即
commonReq.Payload = encode.String(gatewayHttpReq.ReqBody.Payload)
回包处理
type GatewayRespBody struct {
 Header  GatewayRespBodyHeader  `json:"header"`
 Payload map[string]interface{} `json:"payload"`
}

func responseData(gatewayReq *model.GatewayHttpReq, code int32, message string, payload string, resp http.ResponseWriter) {
 jsonPayload := make(map[string]interface{})

 if len(payload) != 0 {
  err := json.Unmarshal([]byte(payload), &jsonPayload)
  if err != nil {
   ...
  }
 }

 body := model.GatewayRespBody{
  Header: model.GatewayRespBodyHeader{
   Code:    code,
   Message: message,
  },
  Payload: jsonPayload,
 }
  data, err := view.RenderResp("json", &body)
  ...
  resp.WriteHeader(http.StatusOK)
 resp.Write(data)
}
同样的,这里的 jsonPayload,也是出现了不必要的 json 解析。我们可以改为
type GatewayRespBody struct {
 Header  GatewayRespBodyHeader  `json:"header"`
 Payload json.RawMessage `json:"payload"`
}

body := model.GatewayRespBody{
  Header: model.GatewayRespBodyHeader{
   Code:    code,
   Message: message,
  },
  Payload: encode.Str2Bytes(payload),
 }
然后在 view.RenderResp 方法中
func RenderResp(format string, resp interface{}) ([]byte, error) {
 if "json" == format {
  return jsoniter.Marshal(resp)
 }
 return nil, errors.New("format error")
}
benchmark
Benchmark 500000 3326 ns/op 2842 B/op 50 allocs/op
虽然对象 alloc 减少了,但单次操作内存使用增加了,且性能下降了。这就有点奇怪了。我们来对比一下 2 个情况下的 pprof。
逃逸分析及处理
go tool pprof -base
-
cpu 差异
   flat  flat%   sum%        cum   cum%
     0.09s  1.17%  1.17%      0.40s  5.20%  runtime.mallocgc
     0.01s  0.13%  1.30%      0.35s  4.55%  /vendor/github.com/json-iterator/go.(*Iterator).readObjectStart
0 0% 1.30% 0.35s 4.55% /vendor/github.com/json-iterator/go.(*twoFieldsStructDecoder).Decode -
mem 差异
      flat  flat%   sum%        cum   cum%
  478.96MB 20.33% 20.33%   279.94MB 11.88%  gateway.RootHandle
         0     0% 20.33%   279.94MB 11.88%  command-line-arguments.BenchmarkTestHttp.func1
         0     0% 20.33%   279.94MB 11.88%  testing.(*B).RunParallel.func1
可以看出 RootHandle 多了 478.96M 的内存使用。通过 list RootHandle 对比 2 个情况下的内存使用。发现修改后的 RootHandle 中多出了这一行:475.46MB 475.46MB 158: gatewayHttpReq := model.GatewayHttpReq{} 这一般意味着变量 gatewayHttpReq 出现了逃逸。
-
go build -gcflags "-m -m" gateway/*.go
gateway/logic.go:270:26: &gatewayHttpReq escapes to heap可以看到确实出现了逃逸。这个对应的代码为
err = view.ReadReq2Json(&gatewayHttpReq),而造成逃逸的本质是因为上面改动了函数 readJsonReq(动态类型逃逸,即函数参数为 interface 类型,无法在编译时确定具体类型的)func readJsonReq(data []byte, req *model.GatewayReqBody) error {
err := jsoniter.Unmarshal(data, req)
...
}因此,这里需要特殊处理一下,改为
func readJsonReq(data []byte, req *model.GatewayReqBody) error {
	var tmp model.GatewayReqBody
	err := jsoniter.Unmarshal(data, &tmp)
	...
}
benchmark
Benchmark 500000 2994 ns/op 1892 B/op 50 allocs/op
可以看到堆内存使用明显下降。性能也提升了。再看一下 pprof,寻找下个瓶颈。
cpu profile
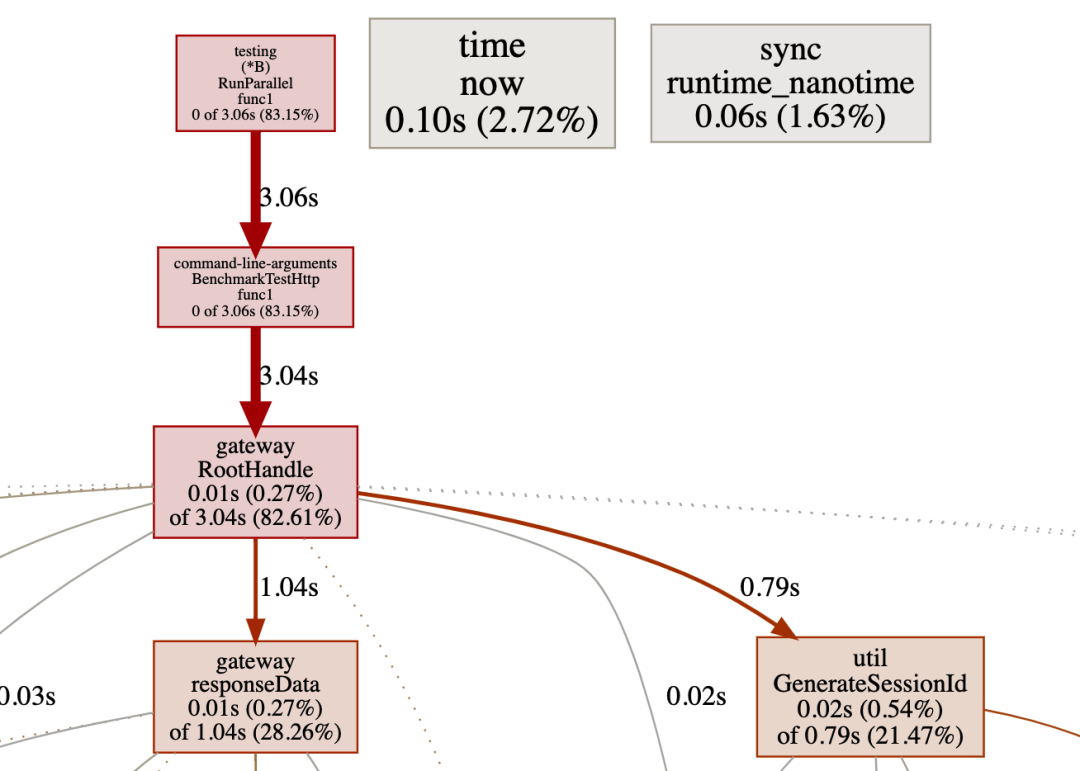
抛开 responeseData(他内部主要是日志打印占比高),占比较高的为 util.GenerateSessionId,先来看看这个怎么优化。
随机字符串生成
var letterRunes = []rune("0123456789abcdefghijklmnopqrstuvwxyzABCDEFGHIJKLMNOPQRSTUVWXYZ")
func RandStringRunes(n int) string {
 b := make([]rune, n)
 for i := range b {
  b[i] = letterRunes[rand.Intn(len(letterRunes))]
 }
 return string(b)
}
目前的生成方式使用的类型是 rune,但其实用 byte 就够了。另外,letterRunes 是 62 个字符,即最大需要 6 位的 index 就可以遍历完成了。而随机数获取的是 63 位。即每个随机数,其实可以产生 10 个随机字符。而不用每个字符都获取一次随机数。所以我们改为
const (
 letterBytes   = "0123456789abcdefghijklmnopqrstuvwxyzABCDEFGHIJKLMNOPQRSTUVWXYZ"
 letterIdxBits = 6
 letterIdxMask = 1<<letterIdxBits - 1
 letterIdxMax  = 63 / letterIdxBits
)
func RandStringRunes(n int) string {
 b := make([]byte, n)
 for i, cache, remain := n-1, rand.Int63(), letterIdxMax; i >= 0; {
  if remain == 0 {
   cache, remain = rand.Int63(), letterIdxMax
  }
  if idx := int(cache & letterIdxMask); idx < len(letterBytes) {
   b[i] = letterBytes[idx]
   i--
  }
  cache >>= letterIdxBits
  remain--
 }
 return string(b)
}
benchmark
Benchmark 1000000 1487 ns/op 1843 B/op 50 allocs/op
类型转换及字符串拼接
一般情况下,都会说将 string 和[]byte 的转换改为 unsafe;以及在字符串拼接时,用 byte.Buffer 代替 fmt.Sprintf。但是网关这里的情况比较特殊,字符串的操作基本集中在打印日志的操作。而 tars 的日志打印本身就是通过 byte.Buffer 拼接的。所以这可以避免。另外,由于日志打印量大,使用 unsafe 转换[]byte 为 string 带来的收益,往往会因为逃逸从而影响 GC,反正会影响性能。因此,不同的场景下,不能简单的套用一些优化方法。需要通过压测及结果分析来判断具体的优化策略。
优化结果
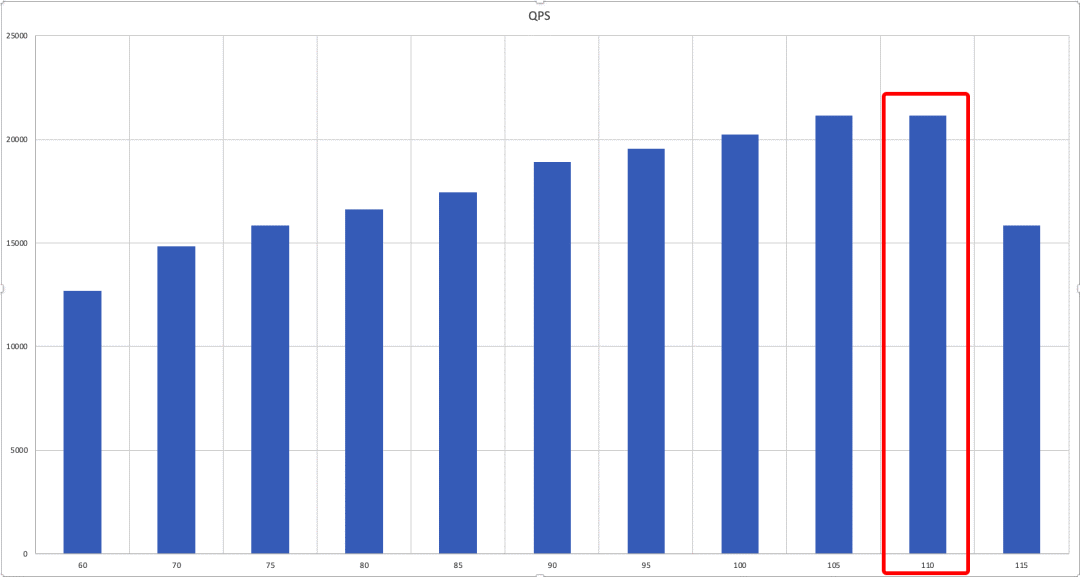
可以看到优化后,最大链接数为 110,最高 QPS 为21153.35。对比之前的13245,大约提升 60%。
后续
从 pprof 中可以看到日志打印,远程日志,健康上报等信息占用较多 cpu 资源,且导致多个数据逃逸(尤其是日志打印)。过多的日志基本等于没有日志。后续可考虑裁剪日志,仅保留出错时的上下文信息。
总结
- 性能查看工具 pprof,trace 及压测工具 wrk 或其他压测工具的使用要比较了解。
- 代码逻辑层面的走读非常重要,要尽量避免无效逻辑。
- 对于 golang 自身库存在缺陷的,可以寻找第三方库或自己改造。
- golang 版本尽量更新,这次的测试是在 golang1.12 下进行的。而 go1.13 甚至 go1.14 在很多地方进行了改进。比如 fmt.Sprintf,sync.Pool 等。替换成新版本应该能进一步提升性能。
- 本地 benchmark 结果不等于线上运行结果。尤其是在使用缓存来提高处理速度时,要考虑 GC 的影响。
- 传参数或返回值时,尽量按 golang 的设计哲学,少用指针,多用值对象,避免引起过多的变量逃逸,导致 GC 耗时暴涨。struct 的大小一般在 2K 以下的拷贝传值,比使用指针要快(可针对不同的机器压测,判断各自的阈值)。
- 值类型在满足需要的情况下,越小越好。能用 int8,就不要用 int64。
- 资源尽量复用,在 golang1.13 以上,可以考虑使用 sync.Pool 缓存会重复申请的内存或对象。或者自己使用并管理大块内存,用来存储小对象,避免 GC 影响(如本地缓存的场景)。
-
实践:
http://127.0.0.1:61024/debug/pprof/goroutine?debug=2

goroutine 1500 [running]:
runtime/pprof.writeGoroutineStacks({0x11fd8a0, 0xc0000ccb60})
	C:/Program Files/Go/src/runtime/pprof/pprof.go:692 +0x85
runtime/pprof.writeGoroutine({0x11fd8a0, 0xc0000ccb60}, 0x2)
	C:/Program Files/Go/src/runtime/pprof/pprof.go:681 +0x4b
runtime/pprof.(*Profile).WriteTo(0x16fc0c0, {0x11fd8a0, 0xc0000ccb60}, 0xc?)
	C:/Program Files/Go/src/runtime/pprof/pprof.go:330 +0x1bb
net/http/pprof.handler.ServeHTTP({0xc000261ab1, 0x9}, {0x1202128, 0xc0000ccb60}, 0x8f82a5?)
	C:/Program Files/Go/src/net/http/pprof/pprof.go:253 +0x57f
net/http/pprof.Index({0x1202128?, 0xc0000ccb60}, 0xc000489100)
	C:/Program Files/Go/src/net/http/pprof/pprof.go:371 +0x3b2
net/http.HandlerFunc.ServeHTTP(0x108d8a8, {0x1202128, 0xc0000ccb60}, 0x0?)
	C:/Program Files/Go/src/net/http/server.go:2109 +0x4e
net/http.(*ServeMux).ServeHTTP(0xc000261abb?, {0x1202128, 0xc0000ccb60}, 0xc000489100)
	C:/Program Files/Go/src/net/http/server.go:2487 +0xc6
net/http.serverHandler.ServeHTTP({0xc0005ca780?}, {0x1202128, 0xc0000ccb60}, 0xc000489100)
	C:/Program Files/Go/src/net/http/server.go:2947 +0x642
net/http.(*conn).serve(0xc0003f6d20, {0x1202b40, 0xc00009a3f0})
	C:/Program Files/Go/src/net/http/server.go:1991 +0xbe5
created by net/http.(*Server).Serve
	C:/Program Files/Go/src/net/http/server.go:3102 +0x838

goroutine 1 [syscall, 11 minutes, locked to thread]:
syscall.SyscallN(0x7ffb560d9290?, {0xc00035fb80?, 0x3?, 0x0?})
	C:/Program Files/Go/src/runtime/syscall_windows.go:557 +0x109
syscall.Syscall(0xc0003e4f00?, 0x0?, 0x0?, 0x0?, 0x0?)
	C:/Program Files/Go/src/runtime/syscall_windows.go:495 +0x3b
golang.org/x/sys/windows.StartServiceCtrlDispatcher(0xc00035fc40)
	C:/Users/U/go/pkg/mod/golang.org/x/sys@v0.0.0-20220808155132-1c4a2a72c664/windows/zsyscall_windows.go:1306 +0xa5
golang.org/x/sys/windows/svc.Run({0xc0003fe658, 0x8}, {0x11fd520?, 0x1c948b8})
	C:/Users/U/go/pkg/mod/golang.org/x/sys@v0.0.0-20220808155132-1c4a2a72c664/windows/svc/service.go:292 +0x171
main.runService({0xc0003fe658, 0x8})
	D:/app/cmd/main_windows.go:181 +0x11d
main.main()
	D:/app/cmd/main_windows.go:137 +0xbb5

goroutine 17 [select, 11 minutes, locked to thread]:
golang.org/x/sys/windows/svc.serviceMain(0x1, 0x331bd88)
	C:/Users/U/go/pkg/mod/golang.org/x/sys@v0.0.0-20220808155132-1c4a2a72c664/windows/svc/service.go:244 +0x676

goroutine 18 [chan receive, 11 minutes]:
github.com/natefinch/lumberjack.(*Logger).millRun(0xc000044720)
	C:/Users/U/go/pkg/mod/github.com/natefinch/lumberjack@v2.0.0+incompatible/lumberjack.go:379 +0x66
created by github.com/natefinch/lumberjack.(*Logger).mill.func1
	C:/Users/U/go/pkg/mod/github.com/natefinch/lumberjack@v2.0.0+incompatible/lumberjack.go:390 +0xef

goroutine 6 [select]:
main.(*winservice).Execute(0xc00006e000?, {0xc000114110, 0x1, 0x1}, 0xc000472000, 0x0?)
	D:/app/cmd/main_windows.go:213 +0x289
golang.org/x/sys/windows/svc.serviceMain.func2()
	C:/Users/U/go/pkg/mod/golang.org/x/sys@v0.0.0-20220808155132-1c4a2a72c664/windows/svc/service.go:232 +0x95
created by golang.org/x/sys/windows/svc.serviceMain
	C:/Users/U/go/pkg/mod/golang.org/x/sys@v0.0.0-20220808155132-1c4a2a72c664/windows/svc/service.go:231 +0x4d6

goroutine 15 [select]:
google.golang.org/grpc.(*ccBalancerWrapper).watcher(0xc000118440)
	C:/Users/U/go/pkg/mod/google.golang.org/grpc@v1.48.0/balancer_conn_wrappers.go:112 +0x156
created by google.golang.org/grpc.newCCBalancerWrapper
	C:/Users/U/go/pkg/mod/google.golang.org/grpc@v1.48.0/balancer_conn_wrappers.go:73 +0x4bb

goroutine 9 [IO wait]:
internal/poll.runtime_pollWait(0x29b65148, 0x72)
	C:/Program Files/Go/src/runtime/netpoll.go:305 +0x89
internal/poll.(*pollDesc).wait(0xc0000ba1b8, 0x36d0138?, 0x0)
	C:/Program Files/Go/src/internal/poll/fd_poll_runtime.go:84 +0xbd
internal/poll.execIO(0xc0000ba018, 0xc00082b9e8)
	C:/Program Files/Go/src/internal/poll/fd_windows.go:175 +0x28c
internal/poll.(*FD).acceptOne(0xc0000ba000, 0x7a0, {0xc000099680, 0x2, 0x2}, 0xc0000ba018)
	C:/Program Files/Go/src/internal/poll/fd_windows.go:942 +0xda
internal/poll.(*FD).Accept(0xc0000ba000, 0xc00082bc50)
	C:/Program Files/Go/src/internal/poll/fd_windows.go:976 +0x308
net.(*netFD).accept(0xc0000ba000)
	C:/Program Files/Go/src/net/fd_windows.go:139 +0x75
net.(*TCPListener).accept(0xc0000b2030)
	C:/Program Files/Go/src/net/tcpsock_posix.go:142 +0x45
net.(*TCPListener).Accept(0xc0000b2030)
	C:/Program Files/Go/src/net/tcpsock.go:288 +0x68
net/http.(*Server).Serve(0xc0001f80f0, {0x1201f18, 0xc0000b2030})
	C:/Program Files/Go/src/net/http/server.go:3070 +0x5a7
net/http.(*Server).ListenAndServe(0xc0001f80f0)
	C:/Program Files/Go/src/net/http/server.go:2999 +0xc5
net/http.ListenAndServe(...)
	C:/Program Files/Go/src/net/http/server.go:3255
main.runApp.func2()
	D:/app/cmd/main_windows.go:404 +0x105
created by main.runApp
	D:/app/cmd/main_windows.go:403 +0x245

goroutine 1750 [syscall, locked to thread]:
syscall.SyscallN(0x7ffb55922e40?, {0xc00094d808?, 0x3?, 0x0?})
	C:/Program Files/Go/src/runtime/syscall_windows.go:557 +0x109
syscall.Syscall(0xc00003f620?, 0xc00094d890?, 0x456253?, 0x2000?, 0x30002?)
	C:/Program Files/Go/src/runtime/syscall_windows.go:495 +0x3b
syscall.WaitForSingleObject(0xc00058d0a0?, 0xffffffff)
	C:/Program Files/Go/src/syscall/zsyscall_windows.go:1145 +0xa8
os.(*Process).wait(0xc0002619e0)
	C:/Program Files/Go/src/os/exec_windows.go:18 +0x78
os.(*Process).Wait(...)
	C:/Program Files/Go/src/os/exec.go:132
os/exec.(*Cmd).Wait(0xc0008514a0)
	C:/Program Files/Go/src/os/exec/exec.go:599 +0xc9
os/exec.(*Cmd).Run(0x0?)
	C:/Program Files/Go/src/os/exec/exec.go:437 +0x65
os/exec.(*Cmd).CombinedOutput(0xc0008514a0)
	C:/Program Files/Go/src/os/exec/exec.go:707 +0x20a
app/internal/biz._pingByCmd.func2()
	D:/app/internal/biz/utils.go:68 +0x1ba
app/internal/biz._pingByCmd({0xc0003fe4c2, 0xe})
	D:/app/internal/biz/utils.go:86 +0xdd
app/internal/biz.pongMixed({0xc0003fe4c2, 0xe}, 0x4?)
	D:/app/internal/biz/utils.go:101 +0x65
app/internal/biz.bizPong({0xc0003fe4c2, 0xe}, 0xc00077e370?)
	D:/app/internal/biz/utils.go:113 +0x197
app/internal/biz.WatchPingOnce.func3(0x2)
	D:/app/internal/biz/watchPing.go:80 +0x1cc
created by app/internal/biz.WatchPingOnce
	D:/app/internal/biz/watchPing.go:69 +0x3cb

goroutine 10 [sleep]:
time.Sleep(0x1dcd650000)
	C:/Program Files/Go/src/runtime/time.go:195 +0x13c
main.glob..func4()
	D:/app/cmd/main.go:37 +0x3d
main.runApp.func3()
	D:/app/cmd/main_windows.go:412 +0x55
created by main.runApp
	D:/app/cmd/main_windows.go:409 +0x2b6

goroutine 11 [semacquire, 3 minutes]:
sync.runtime_Semacquire(0xc0003fe558?)
	C:/Program Files/Go/src/runtime/sema.go:62 +0x25
sync.(*WaitGroup).Wait(0xc0003fe550)
	C:/Program Files/Go/src/sync/waitgroup.go:139 +0xad
app/internal/biz.WatchPingOnce()
	D:/app/internal/biz/watchPing.go:90 +0x59f
main.runApp.func4()
	D:/app/cmd/main_windows.go:418 +0x25
created by main.runApp
	D:/app/cmd/main_windows.go:416 +0x2c5

goroutine 12 [semacquire]:
sync.runtime_SemacquireMutex(0x5dfb75?, 0x80?, 0xc00093ec80?)
	C:/Program Files/Go/src/runtime/sema.go:77 +0x25
sync.(*Mutex).lockSlow(0x1c93fc0)
	C:/Program Files/Go/src/sync/mutex.go:171 +0x225
sync.(*Mutex).Lock(0x1c93fc0)
	C:/Program Files/Go/src/sync/mutex.go:90 +0x65
app/internal/biz._pingByCmd.func2()
	D:/app/internal/biz/utils.go:60 +0x5c
app/internal/biz._pingByCmd({0xc000613e75, 0xb})
	D:/app/internal/biz/utils.go:86 +0xdd
app/internal/biz.pongMixed({0xc000613e75, 0xb}, 0x4?)
	D:/app/internal/biz/utils.go:101 +0x65
app/internal/biz.bizPong({0xc000613e75, 0xb}, 0xc000a2ef00?)
	D:/app/internal/biz/utils.go:113 +0x197
app/internal/biz.OIDToGather()
	D:/app/internal/biz/OIDGet.go:74 +0x74e
main.runApp.func5()
	D:/app/cmd/main_windows.go:425 +0x25
created by main.runApp
	D:/app/cmd/main_windows.go:423 +0x2d1

goroutine 13 [semacquire, 2 minutes]:
sync.runtime_Semacquire(0xc00010c1b8?)
	C:/Program Files/Go/src/runtime/sema.go:62 +0x25
sync.(*WaitGroup).Wait(0xc00010c1b0)
	C:/Program Files/Go/src/sync/waitgroup.go:139 +0xad
app/internal/biz.OIDSNMP()
	D:/app/internal/biz/OIDGet.go:337 +0x9df
main.runApp.func6()
	D:/app/cmd/main_windows.go:433 +0x1f6
created by main.runApp
	D:/app/cmd/main_windows.go:429 +0x2dd

goroutine 14 [semacquire]:
sync.runtime_Semacquire(0xc000612f68?)
	C:/Program Files/Go/src/runtime/sema.go:62 +0x25
sync.(*WaitGroup).Wait(0xc000612f60)
	C:/Program Files/Go/src/sync/waitgroup.go:139 +0xad
app/internal/biz.OIDSaveRet()
	D:/app/internal/biz/OIDGet.go:409 +0x71f
main.runApp.func7()
	D:/app/cmd/main_windows.go:441 +0x25
created by main.runApp
	D:/app/cmd/main_windows.go:439 +0x2e9

goroutine 67 [select, 11 minutes]:
google.golang.org/grpc.(*ccBalancerWrapper).watcher(0xc00049e000)
	C:/Users/U/go/pkg/mod/google.golang.org/grpc@v1.48.0/balancer_conn_wrappers.go:112 +0x156
created by google.golang.org/grpc.newCCBalancerWrapper
	C:/Users/U/go/pkg/mod/google.golang.org/grpc@v1.48.0/balancer_conn_wrappers.go:73 +0x4bb

goroutine 19 [select, 9 minutes]:
google.golang.org/grpc.(*ccBalancerWrapper).watcher(0xc000144140)
	C:/Users/userA/go/pkg/mod/google.golang.org/grpc@v1.48.0/balancer_conn_wrappers.go:112 +0x156
created by google.golang.org/grpc.newCCBalancerWrapper
	C:/Users/U/go/pkg/mod/google.golang.org/grpc@v1.48.0/balancer_conn_wrappers.go:73 +0x4bb

goroutine 2032 [semacquire]:
sync.runtime_SemacquireMutex(0x60?, 0x0?, 0x60?)
	C:/Program Files/Go/src/runtime/sema.go:77 +0x25
sync.(*Mutex).lockSlow(0x1c94e10)
	C:/Program Files/Go/src/sync/mutex.go:171 +0x225
sync.(*Mutex).Lock(0x1c94e10)
	C:/Program Files/Go/src/sync/mutex.go:90 +0x65
sync.(*RWMutex).Lock(0x1c94e10)
	C:/Program Files/Go/src/sync/rwmutex.go:147 +0x3e
app/internal/biz.OIDSNMP.func3.3(0x0)
	D:/app/internal/biz/OIDGet.go:314 +0x9fd
created by app/internal/biz.OIDSNMP.func3
	D:/app/internal/biz/OIDGet.go:217 +0x674

goroutine 1748 [IO wait]:
internal/poll.runtime_pollWait(0x34dae78, 0x72)
	C:/Program Files/Go/src/runtime/netpoll.go:305 +0x89
internal/poll.(*pollDesc).wait(0xc000899ab8, 0x4?, 0x0)
	C:/Program Files/Go/src/internal/poll/fd_poll_runtime.go:84 +0xbd
internal/poll.execIO(0xc000899918, 0x108d368)
	C:/Program Files/Go/src/internal/poll/fd_windows.go:175 +0x28c
internal/poll.(*FD).Read(0xc000899900, {0xc000b746c0, 0x58, 0x58})
	C:/Program Files/Go/src/internal/poll/fd_windows.go:441 +0x44d
net.(*netFD).Read(0xc000899900, {0xc000b746c0, 0x58, 0x58})
	C:/Program Files/Go/src/net/fd_posix.go:55 +0x51
net.(*conn).Read(0xc0001865c8, {0xc000b746c0, 0x58, 0x58})
	C:/Program Files/Go/src/net/net.go:183 +0xb1
app/internal/biz.Pinger({0xc0003fe203, 0xd}, 0x6)
	D:/app/internal/biz/utils.ping.go:155 +0x44a
app/internal/biz.pingByip4Icmp.func1(...)
	D:/app/internal/biz/utils.ping.go:181
app/internal/biz.pingByip4Icmp({0xc0003fe203, 0xd}, 0x6)
	D:/app/internal/biz/utils.ping.go:187 +0x75
app/internal/biz.pongMixed({0xc0003fe203, 0xd}, 0x4?)
	D:/app/internal/biz/utils.go:98 +0x45
app/internal/biz.bizPong({0xc0003fe203, 0xd}, 0xc0009841a0?)
	D:/app/internal/biz/utils.go:113 +0x197
app/internal/biz.WatchPingOnce.func3(0x0)
	D:/app/internal/biz/watchPing.go:80 +0x1cc
created by app/internal/biz.WatchPingOnce
	D:/app/internal/biz/watchPing.go:69 +0x3cb

goroutine 2543 [chan receive]:
app/internal/biz.WatchPingOnce.func3.1()
	D:/app/internal/biz/watchPing.go:84 +0x185
created by app/internal/biz.WatchPingOnce.func3
	D:/app/internal/biz/watchPing.go:82 +0x145

goroutine 1969 [chan receive, 3 minutes]:
app/internal/biz.WatchPingOnce.func3.1()
	D:/app/internal/biz/watchPing.go:84 +0x185
created by app/internal/biz.WatchPingOnce.func3
	D:/app/internal/biz/watchPing.go:82 +0x145

goroutine 2017 [chan receive, 2 minutes]:
app/internal/biz.WatchPingOnce.func3.1()
	D:/app/internal/biz/watchPing.go:84 +0x185
created by app/internal/biz.WatchPingOnce.func3
	D:/app/internal/biz/watchPing.go:82 +0x145

goroutine 85 [IO wait]:
internal/poll.runtime_pollWait(0x29b64ba8, 0x72)
	C:/Program Files/Go/src/runtime/netpoll.go:305 +0x89
internal/poll.(*pollDesc).wait(0xc000459d38, 0x2?, 0x0)
	C:/Program Files/Go/src/internal/poll/fd_poll_runtime.go:84 +0xbd
internal/poll.execIO(0xc000459b98, 0x108d368)
	C:/Program Files/Go/src/internal/poll/fd_windows.go:175 +0x28c
internal/poll.(*FD).Read(0xc000459b80, {0xc000735000, 0x1000, 0x1000})
	C:/Program Files/Go/src/internal/poll/fd_windows.go:441 +0x44d
net.(*netFD).Read(0xc000459b80, {0xc000735000, 0x1000, 0x1000})
	C:/Program Files/Go/src/net/fd_posix.go:55 +0x51
net.(*conn).Read(0xc000186018, {0xc000735000, 0x1000, 0x1000})
	C:/Program Files/Go/src/net/net.go:183 +0xb1
crypto/tls.(*atLeastReader).Read(0xc0005b67b0, {0xc000735000, 0x1000, 0x1000})
	C:/Program Files/Go/src/crypto/tls/conn.go:787 +0x86
bytes.(*Buffer).ReadFrom(0xc0004985f8, {0x11fbd40, 0xc0005b67b0})
	C:/Program Files/Go/src/bytes/buffer.go:202 +0x113
crypto/tls.(*Conn).readFromUntil(0xc000498380, {0x36f63f8?, 0xc000186018}, 0x5)
	C:/Program Files/Go/src/crypto/tls/conn.go:809 +0x1f3
crypto/tls.(*Conn).readRecordOrCCS(0xc000498380, 0x0)
	C:/Program Files/Go/src/crypto/tls/conn.go:616 +0x417
crypto/tls.(*Conn).readRecord(...)
	C:/Program Files/Go/src/crypto/tls/conn.go:582
crypto/tls.(*Conn).Read(0xc000498380, {0xc0005d7000, 0x1000, 0x100010000026f?})
	C:/Program Files/Go/src/crypto/tls/conn.go:1287 +0x29d
bufio.(*Reader).Read(0xc000124b40, {0xc0004904a0, 0x9, 0x9})
	C:/Program Files/Go/src/bufio/bufio.go:237 +0x4f3
io.ReadAtLeast({0x11fbb80, 0xc000124b40}, {0xc0004904a0, 0x9, 0x9}, 0x9)
	C:/Program Files/Go/src/io/io.go:332 +0xde
io.ReadFull(...)
	C:/Program Files/Go/src/io/io.go:351
net/http.http2readFrameHeader({0xc0004904a0?, 0x9?, 0x9?}, {0x11fbb80?, 0xc000124b40?})
	C:/Program Files/Go/src/net/http/h2_bundle.go:1565 +0x96
net/http.(*http2Framer).ReadFrame(0xc000490460)
	C:/Program Files/Go/src/net/http/h2_bundle.go:1829 +0x10f
net/http.(*http2clientConnReadLoop).run(0xc000795f78)
	C:/Program Files/Go/src/net/http/h2_bundle.go:8872 +0x1f9
net/http.(*http2ClientConn).readLoop(0xc0005d4000)
	C:/Program Files/Go/src/net/http/h2_bundle.go:8768 +0x9f
created by net/http.(*http2Transport).newClientConn
	C:/Program Files/Go/src/net/http/h2_bundle.go:7475 +0x14ec

goroutine 2060 [chan receive, 2 minutes]:
app/internal/biz.WatchPingOnce.func3.1()
	D:/app/internal/biz/watchPing.go:84 +0x185
created by app/internal/biz.WatchPingOnce.func3
	D:/app/internal/biz/watchPing.go:82 +0x145

goroutine 1165 [IO wait, 7 minutes]:
internal/poll.runtime_pollWait(0x29b65058, 0x72)
	C:/Program Files/Go/src/runtime/netpoll.go:305 +0x89
internal/poll.(*pollDesc).wait(0xc000581338, 0xc000623ba0?, 0x0)
	C:/Program Files/Go/src/internal/poll/fd_poll_runtime.go:84 +0xbd
internal/poll.execIO(0xc000581198, 0x108d368)
	C:/Program Files/Go/src/internal/poll/fd_windows.go:175 +0x28c
internal/poll.(*FD).Read(0xc000581180, {0xc000532000, 0x1000, 0x1000})
	C:/Program Files/Go/src/internal/poll/fd_windows.go:441 +0x44d
net.(*netFD).Read(0xc000581180, {0xc000532000, 0x1000, 0x1000})
	C:/Program Files/Go/src/net/fd_posix.go:55 +0x51
net.(*conn).Read(0xc00000a398, {0xc000532000, 0x1000, 0x1000})
	C:/Program Files/Go/src/net/net.go:183 +0xb1
net/http.(*connReader).Read(0xc000482de0, {0xc000532000, 0x1000, 0x1000})
	C:/Program Files/Go/src/net/http/server.go:786 +0x23b
bufio.(*Reader).fill(0xc0002b5f20)
	C:/Program Files/Go/src/bufio/bufio.go:106 +0x2ab
bufio.(*Reader).Peek(0xc0002b5f20, 0x4)
	C:/Program Files/Go/src/bufio/bufio.go:144 +0xd2
net/http.(*conn).readRequest(0xc000001400, {0x1202a98, 0xc0000c0c80})
	C:/Program Files/Go/src/net/http/server.go:991 +0x4bb
net/http.(*conn).serve(0xc000001400, {0x1202b40, 0xc00009a3f0})
	C:/Program Files/Go/src/net/http/server.go:1916 +0x5d4
created by net/http.(*Server).Serve
	C:/Program Files/Go/src/net/http/server.go:3102 +0x838

goroutine 2836 [chan receive]:
app/internal/biz.WatchPingOnce.func3.1()
	D:/app/internal/biz/watchPing.go:84 +0x185
created by app/internal/biz.WatchPingOnce.func3
	D:/app/internal/biz/watchPing.go:82 +0x145

goroutine 1827 [chan receive, 3 minutes]:
app/internal/biz.WatchPingOnce.func3.1()
	D:/app/internal/biz/watchPing.go:84 +0x185
created by app/internal/biz.WatchPingOnce.func3
	D:/app/internal/biz/watchPing.go:82 +0x145

goroutine 1673 [chan receive, 3 minutes]:
app/internal/biz.WatchPingOnce.func3.1()
	D:/app/internal/biz/watchPing.go:84 +0x185
created by app/internal/biz.WatchPingOnce.func3
	D:/app/internal/biz/watchPing.go:82 +0x145

goroutine 1243 [chan receive, 3 minutes]:
app/internal/biz.WatchPingOnce.func3.1()
	D:/app/internal/biz/watchPing.go:84 +0x185
created by app/internal/biz.WatchPingOnce.func3
	D:/app/internal/biz/watchPing.go:82 +0x145

goroutine 2092 [semacquire, 2 minutes]:
sync.runtime_Semacquire(0xc000370498?)
	C:/Program Files/Go/src/runtime/sema.go:62 +0x25
sync.(*WaitGroup).Wait(0xc000370490)
	C:/Program Files/Go/src/sync/waitgroup.go:139 +0xad
app/internal/biz.OIDSNMP.func3(0x3)
	D:/app/internal/biz/OIDGet.go:330 +0x996
created by app/internal/biz.OIDSNMP
	D:/app/internal/biz/OIDGet.go:172 +0x685

goroutine 1164 [IO wait, 7 minutes]:
internal/poll.runtime_pollWait(0x29b64f68, 0x72)
	C:/Program Files/Go/src/runtime/netpoll.go:305 +0x89
internal/poll.(*pollDesc).wait(0xc0005295b8, 0x11a?, 0x0)
	C:/Program Files/Go/src/internal/poll/fd_poll_runtime.go:84 +0xbd
internal/poll.execIO(0xc000529418, 0x108d368)
	C:/Program Files/Go/src/internal/poll/fd_windows.go:175 +0x28c
internal/poll.(*FD).Read(0xc000529400, {0xc0004b0000, 0x1000, 0x1000})
	C:/Program Files/Go/src/internal/poll/fd_windows.go:441 +0x44d
net.(*netFD).Read(0xc000529400, {0xc0004b0000, 0x1000, 0x1000})
	C:/Program Files/Go/src/net/fd_posix.go:55 +0x51
net.(*conn).Read(0xc000186158, {0xc0004b0000, 0x1000, 0x1000})
	C:/Program Files/Go/src/net/net.go:183 +0xb1
net/http.(*connReader).Read(0xc0008615c0, {0xc0004b0000, 0x1000, 0x1000})
	C:/Program Files/Go/src/net/http/server.go:786 +0x23b
bufio.(*Reader).fill(0xc000728720)
	C:/Program Files/Go/src/bufio/bufio.go:106 +0x2ab
bufio.(*Reader).ReadSlice(0xc000728720, 0x0?)
	C:/Program Files/Go/src/bufio/bufio.go:372 +0x89
bufio.(*Reader).ReadLine(0xc000728720)
	C:/Program Files/Go/src/bufio/bufio.go:401 +0x36
net/textproto.(*Reader).readLineSlice(0xc000604fc0)
	C:/Program Files/Go/src/net/textproto/reader.go:56 +0xe5
net/textproto.(*Reader).ReadLine(...)
	C:/Program Files/Go/src/net/textproto/reader.go:37
net/http.readRequest(0xc000186158?)
	C:/Program Files/Go/src/net/http/request.go:1036 +0x8e
net/http.(*conn).readRequest(0xc0003b1c20, {0x1202a98, 0xc000702a40})
	C:/Program Files/Go/src/net/http/server.go:994 +0x5aa
net/http.(*conn).serve(0xc0003b1c20, {0x1202b40, 0xc00009a3f0})
	C:/Program Files/Go/src/net/http/server.go:1916 +0x5d4
created by net/http.(*Server).Serve
	C:/Program Files/Go/src/net/http/server.go:3102 +0x838

goroutine 124 [chan receive, 3 minutes]:
app/internal/biz.WatchPingOnce.func3.1()
	D:/app/internal/biz/watchPing.go:84 +0x185
created by app/internal/biz.WatchPingOnce.func3
	D:/app/internal/biz/watchPing.go:82 +0x145

goroutine 2794 [IO wait]:
internal/poll.runtime_pollWait(0x29b64c98, 0x72)
	C:/Program Files/Go/src/runtime/netpoll.go:305 +0x89
internal/poll.(*pollDesc).wait(0xc000899338, 0x1c94850?, 0x0)
	C:/Program Files/Go/src/internal/poll/fd_poll_runtime.go:84 +0xbd
internal/poll.execIO(0xc000899198, 0x108d368)
	C:/Program Files/Go/src/internal/poll/fd_windows.go:175 +0x28c
internal/poll.(*FD).Read(0xc000899180, {0xc0008b8000, 0x1000, 0x1000})
	C:/Program Files/Go/src/internal/poll/fd_windows.go:441 +0x44d
net.(*netFD).Read(0xc000899180, {0xc0008b8000, 0x1000, 0x1000})
	C:/Program Files/Go/src/net/fd_posix.go:55 +0x51
net.(*conn).Read(0xc000b00030, {0xc0008b8000, 0x1000, 0x1000})
	C:/Program Files/Go/src/net/net.go:183 +0xb1
net/http.(*connReader).Read(0xc00027f740, {0xc0008b8000, 0x1000, 0x1000})
	C:/Program Files/Go/src/net/http/server.go:786 +0x23b
bufio.(*Reader).fill(0xc000729b60)
	C:/Program Files/Go/src/bufio/bufio.go:106 +0x2ab
bufio.(*Reader).ReadSlice(0xc000729b60, 0x0?)
	C:/Program Files/Go/src/bufio/bufio.go:372 +0x89
bufio.(*Reader).ReadLine(0xc000729b60)
	C:/Program Files/Go/src/bufio/bufio.go:401 +0x36
net/textproto.(*Reader).readLineSlice(0xc00027f770)
	C:/Program Files/Go/src/net/textproto/reader.go:56 +0xe5
net/textproto.(*Reader).ReadLine(...)
	C:/Program Files/Go/src/net/textproto/reader.go:37
net/http.readRequest(0xc000b00030?)
	C:/Program Files/Go/src/net/http/request.go:1036 +0x8e
net/http.(*conn).readRequest(0xc000aaa640, {0x1202a98, 0xc000c46980})
	C:/Program Files/Go/src/net/http/server.go:994 +0x5aa
net/http.(*conn).serve(0xc000aaa640, {0x1202b40, 0xc00009a3f0})
	C:/Program Files/Go/src/net/http/server.go:1916 +0x5d4
created by net/http.(*Server).Serve
	C:/Program Files/Go/src/net/http/server.go:3102 +0x838

goroutine 2610 [chan receive]:
app/internal/biz.WatchPingOnce.func3.1()
	D:/app/internal/biz/watchPing.go:84 +0x185
created by app/internal/biz.WatchPingOnce.func3
	D:/app/internal/biz/watchPing.go:82 +0x145

goroutine 2468 [chan receive, 2 minutes]:
app/internal/biz.WatchPingOnce.func3.1()
	D:/app/internal/biz/watchPing.go:84 +0x185
created by app/internal/biz.WatchPingOnce.func3
	D:/app/internal/biz/watchPing.go:82 +0x145

goroutine 2046 [chan receive, 2 minutes]:
app/internal/biz.WatchPingOnce.func3.1()
	D:/app/internal/biz/watchPing.go:84 +0x185
created by app/internal/biz.WatchPingOnce.func3
	D:/app/internal/biz/watchPing.go:82 +0x145

goroutine 2642 [chan receive]:
app/internal/biz.WatchPingOnce.func3.1()
	D:/app/internal/biz/watchPing.go:84 +0x185
created by app/internal/biz.WatchPingOnce.func3
	D:/app/internal/biz/watchPing.go:82 +0x145

goroutine 2721 [semacquire]:
sync.runtime_SemacquireMutex(0xcf75d5?, 0x0?, 0x0?)
	C:/Program Files/Go/src/runtime/sema.go:77 +0x25
sync.(*Mutex).lockSlow(0x1c94e10)
	C:/Program Files/Go/src/sync/mutex.go:171 +0x225
sync.(*Mutex).Lock(0x1c94e10)
	C:/Program Files/Go/src/sync/mutex.go:90 +0x65
sync.(*RWMutex).Lock(0x1c94e10)
	C:/Program Files/Go/src/sync/rwmutex.go:147 +0x3e
app/internal/biz.OIDSaveRet.func3(0x0)
	D:/app/internal/biz/OIDGet.go:404 +0x3f6
created by app/internal/biz.OIDSaveRet
	D:/app/internal/biz/OIDGet.go:383 +0x41b

goroutine 1710 [chan receive, 3 minutes]:
app/internal/biz.WatchPingOnce.func3.1()
	D:/app/internal/biz/watchPing.go:84 +0x185
created by app/internal/biz.WatchPingOnce.func3
	D:/app/internal/biz/watchPing.go:82 +0x145

goroutine 96 [chan receive, 3 minutes]:
app/internal/biz.WatchPingOnce.func3.1()
	D:/app/internal/biz/watchPing.go:84 +0x185
created by app/internal/biz.WatchPingOnce.func3
	D:/app/internal/biz/watchPing.go:82 +0x145

goroutine 2777 [chan receive]:
app/internal/biz.WatchPingOnce.func3.1()
	D:/app/internal/biz/watchPing.go:84 +0x185
created by app/internal/biz.WatchPingOnce.func3
	D:/app/internal/biz/watchPing.go:82 +0x145

goroutine 2724 [chan receive]:
app/internal/biz.WatchPingOnce.func3.1()
	D:/app/internal/biz/watchPing.go:84 +0x185
created by app/internal/biz.WatchPingOnce.func3
	D:/app/internal/biz/watchPing.go:82 +0x145

goroutine 2063 [chan receive, 2 minutes]:
app/internal/biz.WatchPingOnce.func3.1()
	D:/app/internal/biz/watchPing.go:84 +0x185
created by app/internal/biz.WatchPingOnce.func3
	D:/app/internal/biz/watchPing.go:82 +0x145

goroutine 2545 [chan receive]:
app/internal/biz.WatchPingOnce.func3.1()
	D:/app/internal/biz/watchPing.go:84 +0x185
created by app/internal/biz.WatchPingOnce.func3
	D:/app/internal/biz/watchPing.go:82 +0x145

goroutine 2245 [semacquire]:
sync.runtime_SemacquireMutex(0x60?, 0x0?, 0x60?)
	C:/Program Files/Go/src/runtime/sema.go:77 +0x25
sync.(*Mutex).lockSlow(0x1c94e10)
	C:/Program Files/Go/src/sync/mutex.go:171 +0x225
sync.(*Mutex).Lock(0x1c94e10)
	C:/Program Files/Go/src/sync/mutex.go:90 +0x65
sync.(*RWMutex).Lock(0x1c94e10)
	C:/Program Files/Go/src/sync/rwmutex.go:147 +0x3e
app/internal/biz.OIDSNMP.func3.3(0x1)
	D:/app/internal/biz/OIDGet.go:314 +0x9fd
created by app/internal/biz.OIDSNMP.func3
	D:/app/internal/biz/OIDGet.go:217 +0x674

goroutine 2068 [chan receive, 2 minutes]:
app/internal/biz.WatchPingOnce.func3.1()
	D:/app/internal/biz/watchPing.go:84 +0x185
created by app/internal/biz.WatchPingOnce.func3
	D:/app/internal/biz/watchPing.go:82 +0x145

goroutine 1678 [chan receive, 3 minutes]:
app/internal/biz.WatchPingOnce.func3.1()
	D:/app/internal/biz/watchPing.go:84 +0x185
created by app/internal/biz.WatchPingOnce.func3
	D:/app/internal/biz/watchPing.go:82 +0x145

goroutine 1777 [chan receive, 3 minutes]:
app/internal/biz.WatchPingOnce.func3.1()
	D:/app/internal/biz/watchPing.go:84 +0x185
created by app/internal/biz.WatchPingOnce.func3
	D:/app/internal/biz/watchPing.go:82 +0x145

goroutine 2785 [syscall, locked to thread]:
syscall.SyscallN(0xc000029b2f?, {0xc000a09a70?, 0x8c4c71?, 0x8c4c57?})
	C:/Program Files/Go/src/runtime/syscall_windows.go:557 +0x109
syscall.Syscall6(0xc00003f350?, 0x0?, 0x451373?, 0x451373?, 0xc000b6c870?, 0xc0000460b8?, 0xc0005d4000?, 0x48b315?)
	C:/Program Files/Go/src/runtime/syscall_windows.go:501 +0x50
syscall.readFile(0x0?, {0xc00085d430, 0x3d0, 0x800000?}, 0xc000a09be4, 0x0)
	C:/Program Files/Go/src/syscall/zsyscall_windows.go:1024 +0x130
syscall.ReadFile(0x0?, {0xc00085d430, 0x3d0, 0x3d0}, 0xc000a09be4, 0x100000000?)
	C:/Program Files/Go/src/syscall/syscall_windows.go:400 +0x6b
syscall.Read(0xc0008995c0?, {0xc00085d430, 0x3d0, 0x3d0})
	C:/Program Files/Go/src/syscall/syscall_windows.go:379 +0x65
internal/poll.(*FD).Read(0xc000899400, {0xc00085d430, 0x3d0, 0x3d0})
	C:/Program Files/Go/src/internal/poll/fd_windows.go:427 +0x27a
os.(*File).read(...)
	C:/Program Files/Go/src/os/file_posix.go:31
os.(*File).Read(0xc0001865b0, {0xc00085d430, 0x3d0, 0x3d0})
	C:/Program Files/Go/src/os/file.go:118 +0xc8
bytes.(*Buffer).ReadFrom(0xc000995140, {0x11fd9a0, 0xc0001865b0})
	C:/Program Files/Go/src/bytes/buffer.go:202 +0x113
io.copyBuffer({0x11fbc00, 0xc000995140}, {0x11fd9a0, 0xc0001865b0}, {0x0, 0x0, 0x0})
	C:/Program Files/Go/src/io/io.go:413 +0x1c6
io.Copy(...)
	C:/Program Files/Go/src/io/io.go:386
os/exec.(*Cmd).writerDescriptor.func1()
	C:/Program Files/Go/src/os/exec/exec.go:407 +0x65
os/exec.(*Cmd).Start.func1(0xc000598860)
	C:/Program Files/Go/src/os/exec/exec.go:544 +0x36
created by os/exec.(*Cmd).Start
	C:/Program Files/Go/src/os/exec/exec.go:543 +0xe95

goroutine 1772 [chan receive, 3 minutes]:
app/internal/biz.WatchPingOnce.func3.1()
	D:/app/internal/biz/watchPing.go:84 +0x185
created by app/internal/biz.WatchPingOnce.func3
	D:/app/internal/biz/watchPing.go:82 +0x145

goroutine 1749 [semacquire]:
sync.runtime_SemacquireMutex(0x4b0025?, 0x7f?, 0x1c93fc0?)
	C:/Program Files/Go/src/runtime/sema.go:77 +0x25
sync.(*Mutex).lockSlow(0x1c93fc0)
	C:/Program Files/Go/src/sync/mutex.go:171 +0x225
sync.(*Mutex).Lock(0x1c93fc0)
	C:/Program Files/Go/src/sync/mutex.go:90 +0x65
app/internal/biz._pingByCmd.func2()
	D:/app/internal/biz/utils.go:60 +0x5c
app/internal/biz._pingByCmd({0xc0003fe375, 0xb})
	D:/app/internal/biz/utils.go:86 +0xdd
app/internal/biz.pongMixed({0xc0003fe375, 0xb}, 0x4?)
	D:/app/internal/biz/utils.go:101 +0x65
app/internal/biz.bizPong({0xc0003fe375, 0xb}, 0xc0007000f0?)
	D:/app/internal/biz/utils.go:113 +0x197
app/internal/biz.WatchPingOnce.func3(0x1)
	D:/app/internal/biz/watchPing.go:80 +0x1cc
created by app/internal/biz.WatchPingOnce
	D:/app/internal/biz/watchPing.go:69 +0x3cb

goroutine 2179 [semacquire, 2 minutes]:
sync.runtime_Semacquire(0xc000bda948?)
	C:/Program Files/Go/src/runtime/sema.go:62 +0x25
sync.(*WaitGroup).Wait(0xc000bda940)
	C:/Program Files/Go/src/sync/waitgroup.go:139 +0xad
app/internal/biz.OIDSNMP.func3(0x2)
	D:/app/internal/biz/OIDGet.go:330 +0x996
created by app/internal/biz.OIDSNMP
	D:/app/internal/biz/OIDGet.go:172 +0x685

goroutine 129 [chan receive, 3 minutes]:
app/internal/biz.WatchPingOnce.func3.1()
	D:/app/internal/biz/watchPing.go:84 +0x185
created by app/internal/biz.WatchPingOnce.func3
	D:/app/internal/biz/watchPing.go:82 +0x145

goroutine 1760 [chan receive, 3 minutes]:
app/internal/biz.WatchPingOnce.func3.1()
	D:/app/internal/biz/watchPing.go:84 +0x185
created by app/internal/biz.WatchPingOnce.func3
	D:/app/internal/biz/watchPing.go:82 +0x145

goroutine 2056 [chan receive, 2 minutes]:
app/internal/biz.WatchPingOnce.func3.1()
	D:/app/internal/biz/watchPing.go:84 +0x185
created by app/internal/biz.WatchPingOnce.func3
	D:/app/internal/biz/watchPing.go:82 +0x145

goroutine 2089 [semacquire, 2 minutes]:
sync.runtime_Semacquire(0xc0005dc758?)
	C:/Program Files/Go/src/runtime/sema.go:62 +0x25
sync.(*WaitGroup).Wait(0xc0005dc750)
	C:/Program Files/Go/src/sync/waitgroup.go:139 +0xad
app/internal/biz.OIDSNMP.func3(0x1)
	D:/app/internal/biz/OIDGet.go:330 +0x996
created by app/internal/biz.OIDSNMP
	D:/app/internal/biz/OIDGet.go:172 +0x685

goroutine 2455 [chan receive, 2 minutes]:
app/internal/biz.WatchPingOnce.func3.1()
	D:/app/internal/biz/watchPing.go:84 +0x185
created by app/internal/biz.WatchPingOnce.func3
	D:/app/internal/biz/watchPing.go:82 +0x145

goroutine 2213 [semacquire, 2 minutes]:
sync.runtime_Semacquire(0xc000478778?)
	C:/Program Files/Go/src/runtime/sema.go:62 +0x25
sync.(*WaitGroup).Wait(0xc000478770)
	C:/Program Files/Go/src/sync/waitgroup.go:139 +0xad
app/internal/biz.OIDSNMP.func3(0x7)
	D:/app/internal/biz/OIDGet.go:330 +0x996
created by app/internal/biz.OIDSNMP
	D:/app/internal/biz/OIDGet.go:172 +0x685

goroutine 2248 [semacquire]:
sync.runtime_SemacquireMutex(0x60?, 0x0?, 0x60?)
	C:/Program Files/Go/src/runtime/sema.go:77 +0x25
sync.(*Mutex).lockSlow(0x1c94e10)
	C:/Program Files/Go/src/sync/mutex.go:171 +0x225
sync.(*Mutex).Lock(0x1c94e10)
	C:/Program Files/Go/src/sync/mutex.go:90 +0x65
sync.(*RWMutex).Lock(0x1c94e10)
	C:/Program Files/Go/src/sync/rwmutex.go:147 +0x3e
app/internal/biz.OIDSNMP.func3.3(0x0)
	D:/app/internal/biz/OIDGet.go:314 +0x9fd
created by app/internal/biz.OIDSNMP.func3
	D:/app/internal/biz/OIDGet.go:217 +0x674

goroutine 2716 [chan receive]:
github.com/natefinch/lumberjack.(*Logger).millRun(0xc0000446c0)
	C:/Users/U/go/pkg/mod/github.com/natefinch/lumberjack@v2.0.0+incompatible/lumberjack.go:379 +0x66
created by github.com/natefinch/lumberjack.(*Logger).mill.func1
	C:/Users/U/go/pkg/mod/github.com/natefinch/lumberjack@v2.0.0+incompatible/lumberjack.go:390 +0xef

goroutine 2250 [semacquire]:
sync.runtime_SemacquireMutex(0x48ff00?, 0x0?, 0xc000821820?)
	C:/Program Files/Go/src/runtime/sema.go:77 +0x25
sync.(*Mutex).lockSlow(0x1c94e10)
	C:/Program Files/Go/src/sync/mutex.go:171 +0x225
sync.(*Mutex).Lock(0x1c94e10)
	C:/Program Files/Go/src/sync/mutex.go:90 +0x65
sync.(*RWMutex).Lock(0x1c94e10)
	C:/Program Files/Go/src/sync/rwmutex.go:147 +0x3e
app/internal/biz.OIDSNMP.func3.3(0x1)
	D:/app/internal/biz/OIDGet.go:314 +0x9fd
created by app/internal/biz.OIDSNMP.func3
	D:/app/internal/biz/OIDGet.go:217 +0x674

goroutine 2218 [semacquire]:
sync.runtime_SemacquireMutex(0xfd9bc0?, 0x1?, 0x93cf05?)
	C:/Program Files/Go/src/runtime/sema.go:77 +0x25
sync.(*Mutex).lockSlow(0x1c93fb8)
	C:/Program Files/Go/src/sync/mutex.go:171 +0x225
sync.(*Mutex).Lock(0x1c93fb8)
	C:/Program Files/Go/src/sync/mutex.go:90 +0x65
app/internal/biz.OIDSNMP.func3.3(0x0)
	D:/app/internal/biz/OIDGet.go:318 +0xba5
created by app/internal/biz.OIDSNMP.func3
	D:/app/internal/biz/OIDGet.go:217 +0x674

goroutine 2763 [chan receive]:
app/internal/biz.WatchPingOnce.func3.1()
	D:/app/internal/biz/watchPing.go:84 +0x185
created by app/internal/biz.WatchPingOnce.func3
	D:/app/internal/biz/watchPing.go:82 +0x145

goroutine 2396 [chan receive, 2 minutes]:
app/internal/biz.WatchPingOnce.func3.1()
	D:/app/internal/biz/watchPing.go:84 +0x185
created by app/internal/biz.WatchPingOnce.func3
	D:/app/internal/biz/watchPing.go:82 +0x145

goroutine 2853 [IO wait]:
internal/poll.runtime_pollWait(0x29b64e78, 0x72)
	C:/Program Files/Go/src/runtime/netpoll.go:305 +0x89
internal/poll.(*pollDesc).wait(0xc000b5abb8, 0x2?, 0x0)
	C:/Program Files/Go/src/internal/poll/fd_poll_runtime.go:84 +0xbd
internal/poll.execIO(0xc000b5aa18, 0x108d368)
	C:/Program Files/Go/src/internal/poll/fd_windows.go:175 +0x28c
internal/poll.(*FD).Read(0xc000b5aa00, {0xc0005ca791, 0x1, 0x1})
	C:/Program Files/Go/src/internal/poll/fd_windows.go:441 +0x44d
net.(*netFD).Read(0xc000b5aa00, {0xc0005ca791, 0x1, 0x1})
	C:/Program Files/Go/src/net/fd_posix.go:55 +0x51
net.(*conn).Read(0xc0000c21c8, {0xc0005ca791, 0x1, 0x1})
	C:/Program Files/Go/src/net/net.go:183 +0xb1
net/http.(*connReader).backgroundRead(0xc0005ca780)
	C:/Program Files/Go/src/net/http/server.go:678 +0x79
created by net/http.(*connReader).startBackgroundRead
	C:/Program Files/Go/src/net/http/server.go:674 +0x1a7

goroutine 2422 [chan receive, 2 minutes]:
app/internal/biz.WatchPingOnce.func3.1()
	D:/app/internal/biz/watchPing.go:84 +0x185
created by app/internal/biz.WatchPingOnce.func3
	D:/app/internal/biz/watchPing.go:82 +0x145

goroutine 2220 [semacquire]:
sync.runtime_SemacquireMutex(0x60?, 0x0?, 0x60?)
	C:/Program Files/Go/src/runtime/sema.go:77 +0x25
sync.(*Mutex).lockSlow(0x1c94e10)
	C:/Program Files/Go/src/sync/mutex.go:171 +0x225
sync.(*Mutex).Lock(0x1c94e10)
	C:/Program Files/Go/src/sync/mutex.go:90 +0x65
sync.(*RWMutex).Lock(0x1c94e10)
	C:/Program Files/Go/src/sync/rwmutex.go:147 +0x3e
app/internal/biz.OIDSNMP.func3.3(0x0)
	D:/app/internal/biz/OIDGet.go:314 +0x9fd
created by app/internal/biz.OIDSNMP.func3
	D:/app/internal/biz/OIDGet.go:217 +0x674

goroutine 2230 [semacquire]:
sync.runtime_SemacquireMutex(0x60?, 0x80?, 0x60?)
	C:/Program Files/Go/src/runtime/sema.go:77 +0x25
sync.(*Mutex).lockSlow(0x1c94e10)
	C:/Program Files/Go/src/sync/mutex.go:171 +0x225
sync.(*Mutex).Lock(0x1c94e10)
	C:/Program Files/Go/src/sync/mutex.go:90 +0x65
sync.(*RWMutex).Lock(0x1c94e10)
	C:/Program Files/Go/src/sync/rwmutex.go:147 +0x3e
app/internal/biz.OIDSNMP.func3.3(0x1)
	D:/app/internal/biz/OIDGet.go:314 +0x9fd
created by app/internal/biz.OIDSNMP.func3
	D:/app/internal/biz/OIDGet.go:217 +0x674

goroutine 2434 [chan receive]:
app/internal/biz.WatchPingOnce.func3.1()
	D:/app/internal/biz/watchPing.go:84 +0x185
created by app/internal/biz.WatchPingOnce.func3
	D:/app/internal/biz/watchPing.go:82 +0x145

goroutine 2435 [chan receive, 2 minutes]:
app/internal/biz.WatchPingOnce.func3.1()
	D:/app/internal/biz/watchPing.go:84 +0x185
created by app/internal/biz.WatchPingOnce.func3
	D:/app/internal/biz/watchPing.go:82 +0x145
			go func() {
				for {
					biz.WatchPingOnce()
					time.Sleep(32 * time.Second)
				}
			}()
	for i := 0; i < workersTotal; i++ {
		go func(i int) {
			defer wg.Done()
			capacity := HostTotal
			start := i * batchNum
			end := start + batchNum
			if end > capacity {
				end = capacity
			}
			list := ListHost[start:end]
			for _, v := range list {
				originIp := v.Host
				pong := bizPong(originIp, 4)
				watchPingContainer.Store(originIp, pong)
				go func() {
					log.SRELog.Debug("originIp ", originIp, utils.RuntimeInfo(), utils.MemStats())
					<-time.After(256 * time.Second)
					watchPingContainer.Delete(originIp)
				}()
			}
		}(i)
	}
优化:
将
	go func() {
					log.SRELog.Debug("originIp ", originIp, utils.RuntimeInfo(), utils.MemStats())
					<-time.After(256 * time.Second)
					watchPingContainer.Delete(originIp)
				}()
移出,有原来的不定个,变为1个
小结:
1、内存消耗分析 list peek 定位到函数
控制go程数量,数量上限应该是固定的,不是随数据库数据条数而变化。
https://mp.weixin.qq.com/s/_LovnIqJYAuDpTm2QmUgrA
使用pprof和go-torch排查golang的性能问题
最近线上服务压力很大,api的p99有点扛不住。
广告业务对延时的要求普遍比较严格,有些adx设置的超时时间低至100ms,因此亟需找出性能热点。
根据对目前系统情况的估计(和metrics埋点数据),大致估计问题出在广告的正排环节。
使用 pprof 也证明了这一块确实是热点:
$ go tool pprof http://$IP:$PORT/debug/pprof/profile...(pprof) top 10Showing nodes accounting for 25.50s, 32.63% of 78.14s totalDropped 1533 nodes (cum <= 0.39s)Showing top 10 nodes out of 284flat flat% sum% cum cum%4.56s 5.84% 5.84% 4.87s 6.23% syscall.Syscall4.03s 5.16% 10.99% 4.03s 5.16% runtime.aeshashbody3.50s 4.48% 15.47% 6.01s 7.69% git.xxx.org/xxx/target.NewFilter2.78s 3.56% 19.03% 3.73s 4.77% runtime.mapaccess2_fast642.63s 3.37% 22.40% 4.52s 5.78% runtime.mapiternext2.08s 2.66% 25.06% 2.16s 2.76% runtime.heapBitsForObject1.65s 2.11% 27.17% 1.93s 2.47% runtime.mapaccess1_fast641.57s 2.01% 29.18% 2.96s 3.79% runtime.mapaccess21.43s 1.83% 31.01% 2.06s 2.64% runtime.runqgrab1.27s 1.63% 32.63% 1.27s 1.63% runtime.epollwait(pprof) pngGenerating report in profile001.png (使用生成的线框图查看耗时)
其中第三行 NewFilter 就是正排过滤函数。因为一些历史原因,系统里不是所有定向条件都使用了倒排,正排实现起来毕竟简单、容易理解,而一旦开了这个口子,就会有越来越多正排加进来,推测是这个原因导致了性能的逐渐衰退。
经过讨论,D同学花了一周多的时间,逐个梳理重写。在Libra(字节跳动内部的ABTest平台,参考谷歌分层实验框架方案)上开实验,平均耗时 -9%,从统计数据上来说,实验组比对照组有了显著的改进,但从最终结果上,整体的p95、p99超时都出现了进一步恶化。
这说明真正的问题不在于正排的计算,优化的思路出现了偏差。
考虑到晚高峰期间的cpu占用率也只是刚超过50%,也就是说有可能性能问题在于锁,但pprof的 block 和 mutex 都是空的,没有线索。
猜测问题有可能在日志,代码里确实用得不少。日志用的是 github.com/ngaut/logging 库,每一次调用都会用到两个全局mutex。但通过调整log level 为error级别,大幅减少了日志量,并没有看到性能的改善。
经过搜索,发现 uber 基于 pprof 开发了一个神器 go-torch,可以生成火焰图。安装好 go-torch 及依赖 FlameGraph 以后执行:
$ go-torch -u http://$IP:$PORT -f cpu.svgINFO[14:52:23] Run pprof command: go tool pprof -raw -seconds 30 http://$IP:$PORT/debug/pprof/profileINFO[14:52:54] Writing svg to cpu.svg
用 Chrome 打开 cpu.svg,人肉排查:
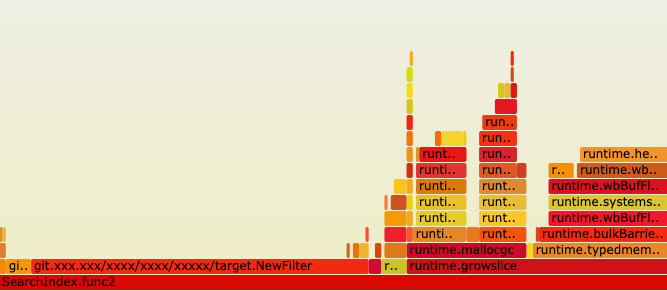
可以看到,在NewFilter旁边竟然还有一个耗时接近的 runtime.growslice ,结合实际代码(略作简化),可以推测是 slice 的初始化长度不足。
matchAds := make([]*ad, 0, 4096)adsBitMap.GetList(func(seq int) {if NewFilter(ctx, ad) {matchAds = append(matchAds, adlist[seq])}})// 顺便提一下,bitmap是一个uint64数组,GetList(f) 是将每一个等于1的bit索引传给 f// GetList方法里面用了cpu的BSF指令来提高性能。
实际上最终定向后得到的广告往往在数万甚至数十万的级别,而 go 的 slice 扩容在超过1024个元素以后是1.25倍,可想而知会出现大量的内存分配和拷贝,导致性能随着广告数量的增加逐渐恶化。最近的广告数量也确实有了大幅的上升 —— 逻辑上形成了闭环。
经过优化,使用更大的初始化长度,并且使用 sync.Pool 来进一步减少内存分配,最终上线后p95和p99都下降了超过50%,效果显著。
参考文章:
golang 使用pprof和go-torch做性能分析
https://www.cnblogs.com/li-peng/p/9391543.html
Go语言性能优化工具pprof文本输出的含义_梁喜健_新浪博客 http://blog.sina.com.cn/s/blog_48c95a190102xtse.html
https://mp.weixin.qq.com/s/4Vn1Rq82wOFiLdEmjXU0fw
go pprof与线上事故:一次成功的定位与失败的复现
go tool pprof http://127.0.0.1:123/debug/pprof/heap
使用list命令直接可以查看到具体是哪一行分配了多少内存
list Output annotated source for functions matching regexp
pdf Outputs a graph in PDF format
peek Output callers/callees of functions matching regexp
(pprof) list new
Total: 1.02MB
ROUTINE ======================== google.golang.org/grpc/internal/transport.newFramer in /home/shawn/go/pkg/mod/google.golang.org/grpc@v1.29.1/internal/transport/http_util.go
         0   528.17kB (flat, cum) 50.74% of Total
         .          .    658:   if writeBufferSize < 0 {
         .          .    659:           writeBufferSize = 0
         .          .    660:   }
         .          .    661:   var r io.Reader = conn
         .          .    662:   if readBufferSize > 0 {
         .   528.17kB    663:           r = bufio.NewReaderSize(r, readBufferSize)
         .          .    664:   }
         .          .    665:   w := newBufWriter(conn, writeBufferSize)
         .          .    666:   f := &framer{
         .          .    667:           writer: w,
         .          .    668:           fr:     http2.NewFramer(w, r),
ROUTINE ======================== google.golang.org/grpc/internal/transport.newHTTP2Client in /home/shawn/go/pkg/mod/google.golang.org/grpc@v1.29.1/internal/transport/http2_client.go
         0   528.17kB (flat, cum) 50.74% of Total
         .          .    244:           localAddr:             conn.LocalAddr(),
         .          .    245:           authInfo:              authInfo,
         .          .    246:           readerDone:            make(chan struct{}),
         .          .    247:           writerDone:            make(chan struct{}),
         .          .    248:           goAway:                make(chan struct{}),
         .   528.17kB    249:           framer:                newFramer(conn, writeBufSize, readBufSize, maxHeaderListSize),
         .          .    250:           fc:                    &trInFlow{limit: uint32(icwz)},
         .          .    251:           scheme:                scheme,
         .          .    252:           activeStreams:         make(map[uint32]*Stream),
         .          .    253:           isSecure:              isSecure,
         .          .    254:           perRPCCreds:           perRPCCreds,
(pprof)


(pprof) peek new
Showing nodes accounting for 1040.92kB, 100% of 1040.92kB total
----------------------------------------------------------+-------------
      flat  flat%   sum%        cum   cum%   calls calls% + context
----------------------------------------------------------+-------------
                                          528.17kB   100% |   google.golang.org/grpc/internal/transport.newHTTP2Client
         0     0%     0%   528.17kB 50.74%                | google.golang.org/grpc/internal/transport.newFramer
                                          528.17kB   100% |   bufio.NewReaderSize (inline)
----------------------------------------------------------+-------------
                                          528.17kB   100% |   google.golang.org/grpc/internal/transport.NewClientTransport
         0     0%     0%   528.17kB 50.74%                | google.golang.org/grpc/internal/transport.newHTTP2Client
                                          528.17kB   100% |   google.golang.org/grpc/internal/transport.newFramer
----------------------------------------------------------+-------------
(pprof)
         list         Output annotated source for functions matching regexp
         pdf          Outputs a graph in PDF format
         peek         Output callers/callees of functions matching regexp
然后我们在用go tool pprof -alloc_space http://127.0.0.1:8080/debug/pprof/heap命令链接程序来查看 内存对象分配的相关情况。然后输入top来查看累积分配内存较多的一些函数调用:
(pprof) top
523.38GB of 650.90GB total (80.41%)
Dropped 342 nodes (cum <= 3.25GB)
Showing top 10 nodes out of 106 (cum >= 28.02GB)
      flat  flat%   sum%        cum   cum%
  147.59GB 22.68% 22.68%   147.59GB 22.68%  runtime.rawstringtmp
  129.23GB 19.85% 42.53%   129.24GB 19.86%  runtime.mapassign
   48.23GB  7.41% 49.94%    48.23GB  7.41%  bytes.makeSlice
   46.25GB  7.11% 57.05%    71.06GB 10.92%  encoding/json.Unmarshal
   31.41GB  4.83% 61.87%   113.86GB 17.49%  net/http.readRequest
   30.55GB  4.69% 66.57%   171.20GB 26.30%  net/http.(*conn).readRequest
   22.95GB  3.53% 70.09%    22.95GB  3.53%  net/url.parse
   22.70GB  3.49% 73.58%    22.70GB  3.49%  runtime.stringtoslicebyte
   22.70GB  3.49% 77.07%    22.70GB  3.49%  runtime.makemap
   21.75GB  3.34% 80.41%    28.02GB  4.31%  context.WithCancel
可以看出string-[]byte相互转换、分配map、bytes.makeSlice、encoding/json.Unmarshal等调用累积分配的内存较多。 此时我们就可以review代码,如何减少这些相关的调用,或者优化相关代码逻辑。
2、
内存使用 内存泄漏
golang 内存分析/动态追踪 — 源代码 https://lrita.github.io/2017/05/26/golang-memory-pprof/
golang pprof
当你的golang程序在运行过程中消耗了超出你理解的内存时,你就需要搞明白,到底是 程序中哪些代码导致了这些内存消耗。此时golang编译好的程序对你来说是个黑盒,该 如何搞清其中的内存使用呢?幸好golang已经内置了一些机制来帮助我们进行分析和追 踪。
此时,通常我们可以采用golang的pprof来帮助我们分析golang进程的内存使用。
pprof 实例
通常我们采用http api来将pprof信息暴露出来以供分析,我们可以采用net/http/pprof 这个package。下面是一个简单的示例:
// pprof 的init函数会将pprof里的一些handler注册到http.DefaultServeMux上
// 当不使用http.DefaultServeMux来提供http api时,可以查阅其init函数,自己注册handler
import _ "net/http/pprof"

go func() {
    http.ListenAndServe("0.0.0.0:8080", nil)
}()
此时我们可以启动进程,然后访问http://localhost:8080/debug/pprof/可以看到一个简单的 页面,页面上显示: 注意: 以下的全部数据,包括go tool pprof 采集到的数据都依赖进程中的pprof采样率,默认512kb进行 一次采样,当我们认为数据不够细致时,可以调节采样率runtime.MemProfileRate,但是采样率越低,进 程运行速度越慢。
/debug/pprof/

profiles:
0         block
136840    goroutine
902       heap
0         mutex
40        threadcreate

full goroutine stack dump
上面简单暴露出了几个内置的Profile统计项。例如有136840个goroutine在运行,点击相关链接 可以看到详细信息。
当我们分析内存相关的问题时,可以点击heap项,进入http://127.0.0.1:8080/debug/pprof/heap?debug=1 可以查看具体的显示:
heap profile: 3190: 77516056 [54762: 612664248] @ heap/1048576
1: 29081600 [1: 29081600] @ 0x89368e 0x894cd9 0x8a5a9d 0x8a9b7c 0x8af578 0x8b4441 0x8b4c6d 0x8b8504 0x8b2bc3 0x45b1c1
#    0x89368d    github.com/syndtr/goleveldb/leveldb/memdb.(*DB).Put+0x59d
#    0x894cd8    xxxxx/storage/internal/memtable.(*MemTable).Set+0x88
#    0x8a5a9c    xxxxx/storage.(*snapshotter).AppendCommitLog+0x1cc
#    0x8a9b7b    xxxxx/storage.(*store).Update+0x26b
#    0x8af577    xxxxx/config.(*config).Update+0xa7
#    0x8b4440    xxxxx/naming.(*naming).update+0x120
#    0x8b4c6c    xxxxx/naming.(*naming).instanceTimeout+0x27c
#    0x8b8503    xxxxx/naming.(*naming).(xxxxx/naming.instanceTimeout)-fm+0x63

......

# runtime.MemStats
# Alloc = 2463648064
# TotalAlloc = 31707239480
# Sys = 4831318840
# Lookups = 2690464
# Mallocs = 274619648
# Frees = 262711312
# HeapAlloc = 2463648064
# HeapSys = 3877830656
# HeapIdle = 854990848
# HeapInuse = 3022839808
# HeapReleased = 0
# HeapObjects = 11908336
# Stack = 655949824 / 655949824
# MSpan = 63329432 / 72040448
# MCache = 38400 / 49152
# BuckHashSys = 1706593
# GCSys = 170819584
# OtherSys = 52922583
# NextGC = 3570699312
# PauseNs = [1052815 217503 208124 233034 1146462 456882 1098525 530706 551702 419372 768322 596273 387826 455807 563621 587849 416204 599143 572823 488681 701731 656358 2476770 12141392 5827253 3508261 1715582 1295487 908563 788435 718700 0 0 0 0 0 0 0 0 0 0 0 0 0 0 0 0 0 0 0 0 0 0 0 0 0 0 0 0 0 0 0 0 0 0 0 0 0 0 0 0 0 0 0 0 0 0 0 0 0 0 0 0 0 0 0 0 0 0 0 0 0 0 0 0 0 0 0 0 0 0 0 0 0 0 0 0 0 0 0 0 0 0 0 0 0 0 0 0 0 0 0 0 0 0 0 0 0 0 0 0 0 0 0 0 0 0 0 0 0 0 0 0 0 0 0 0 0 0 0 0 0 0 0 0 0 0 0 0 0 0 0 0 0 0 0 0 0 0 0 0 0 0 0 0 0 0 0 0 0 0 0 0 0 0 0 0 0 0 0 0 0 0 0 0 0 0 0 0 0 0 0 0 0 0 0 0 0 0 0 0 0 0 0 0 0 0 0 0 0 0 0 0 0 0 0 0 0 0 0 0 0 0 0 0 0 0 0 0 0 0 0 0 0 0 0 0 0 0 0 0 0 0 0 0 0]
# NumGC = 31
# DebugGC = false
其中显示的内容会比较多,但是主体分为2个部分: 第一个部分打印为通过runtime.MemProfile()获取的runtime.MemProfileRecord记录。 其含义为:
heap profile: 3190(inused objects): 77516056(inused bytes) [54762(alloc objects): 612664248(alloc bytes)] @ heap/1048576(2*MemProfileRate)
1: 29081600 [1: 29081600] (前面4个数跟第一行的一样,此行以后是每次记录的,后面的地址是记录中的栈指针)@ 0x89368e 0x894cd9 0x8a5a9d 0x8a9b7c 0x8af578 0x8b4441 0x8b4c6d 0x8b8504 0x8b2bc3 0x45b1c1
#    0x89368d    github.com/syndtr/goleveldb/leveldb/memdb.(*DB).Put+0x59d 栈信息
第二部分就比较好理解,打印的是通过runtime.ReadMemStats()读取的runtime.MemStats信息。 我们可以重点关注一下
Sys进程从系统获得的内存空间,虚拟地址空间。HeapAlloc进程堆内存分配使用的空间,通常是用户new出来的堆对象,包含未被gc掉的。HeapSys进程从系统获得的堆内存,因为golang底层使用TCmalloc机制,会缓存一部分堆内存,虚拟地址空间。PauseNs记录每次gc暂停的时间(纳秒),最多记录256个最新记录。NumGC记录gc发生的次数。
相信,对pprof不了解的用户看了以上内容,很难获得更多的有用信息。因此我们需要引用更多工具来帮助 我们更加简单的解读pprof内容。
go tool
我们可以采用go tool pprof -inuse_space http://127.0.0.1:8080/debug/pprof/heap命令连接到进程中 查看正在使用的一些内存相关信息,此时我们得到一个可以交互的命令行。
我们可以看数据top10来查看正在使用的对象较多的10个函数入口。通常用来检测有没有不符合预期的内存 对象引用。
(pprof) top10
1355.47MB of 1436.26MB total (94.38%)
Dropped 371 nodes (cum <= 7.18MB)
Showing top 10 nodes out of 61 (cum >= 23.50MB)
      flat  flat%   sum%        cum   cum%
  512.96MB 35.71% 35.71%   512.96MB 35.71%  net/http.newBufioWriterSize
  503.93MB 35.09% 70.80%   503.93MB 35.09%  net/http.newBufioReader
  113.04MB  7.87% 78.67%   113.04MB  7.87%  runtime.rawstringtmp
   55.02MB  3.83% 82.50%    55.02MB  3.83%  runtime.malg
   45.01MB  3.13% 85.64%    45.01MB  3.13%  xxxxx/storage.(*Node).clone
   26.50MB  1.85% 87.48%    52.50MB  3.66%  context.WithCancel
   25.50MB  1.78% 89.26%    83.58MB  5.82%  runtime.systemstack
   25.01MB  1.74% 91.00%    58.51MB  4.07%  net/http.readRequest
      25MB  1.74% 92.74%    29.03MB  2.02%  runtime.mapassign
   23.50MB  1.64% 94.38%    23.50MB  1.64%  net/http.(*Server).newConn
然后我们在用go tool pprof -alloc_space http://127.0.0.1:8080/debug/pprof/heap命令链接程序来查看 内存对象分配的相关情况。然后输入top来查看累积分配内存较多的一些函数调用:
(pprof) top
523.38GB of 650.90GB total (80.41%)
Dropped 342 nodes (cum <= 3.25GB)
Showing top 10 nodes out of 106 (cum >= 28.02GB)
      flat  flat%   sum%        cum   cum%
  147.59GB 22.68% 22.68%   147.59GB 22.68%  runtime.rawstringtmp
  129.23GB 19.85% 42.53%   129.24GB 19.86%  runtime.mapassign
   48.23GB  7.41% 49.94%    48.23GB  7.41%  bytes.makeSlice
   46.25GB  7.11% 57.05%    71.06GB 10.92%  encoding/json.Unmarshal
   31.41GB  4.83% 61.87%   113.86GB 17.49%  net/http.readRequest
   30.55GB  4.69% 66.57%   171.20GB 26.30%  net/http.(*conn).readRequest
   22.95GB  3.53% 70.09%    22.95GB  3.53%  net/url.parse
   22.70GB  3.49% 73.58%    22.70GB  3.49%  runtime.stringtoslicebyte
   22.70GB  3.49% 77.07%    22.70GB  3.49%  runtime.makemap
   21.75GB  3.34% 80.41%    28.02GB  4.31%  context.WithCancel
可以看出string-[]byte相互转换、分配map、bytes.makeSlice、encoding/json.Unmarshal等调用累积分配的内存较多。 此时我们就可以review代码,如何减少这些相关的调用,或者优化相关代码逻辑。
当我们不明确这些调用时是被哪些函数引起的时,我们可以输入top -cum来查找,-cum的意思就是,将函数调用关系 中的数据进行累积,比如A函数调用的B函数,则B函数中的内存分配量也会累积到A上面,这样就可以很容易的找出调用链。
(pprof) top20 -cum
322890.40MB of 666518.53MB total (48.44%)
Dropped 342 nodes (cum <= 3332.59MB)
Showing top 20 nodes out of 106 (cum >= 122316.23MB)
      flat  flat%   sum%        cum   cum%
         0     0%     0% 643525.16MB 96.55%  runtime.goexit
 2184.63MB  0.33%  0.33% 620745.26MB 93.13%  net/http.(*conn).serve
         0     0%  0.33% 435300.50MB 65.31%  xxxxx/api/server.(*HTTPServer).ServeHTTP
 5865.22MB  0.88%  1.21% 435300.50MB 65.31%  xxxxx/api/server/router.(*httpRouter).ServeHTTP
         0     0%  1.21% 433121.39MB 64.98%  net/http.serverHandler.ServeHTTP
         0     0%  1.21% 430456.29MB 64.58%  xxxxx/api/server/filter.(*chain).Next
   43.50MB 0.0065%  1.21% 429469.71MB 64.43%  xxxxx/api/server/filter.TransURLTov1
         0     0%  1.21% 346440.39MB 51.98%  xxxxx/api/server/filter.Role30x
31283.56MB  4.69%  5.91% 175309.48MB 26.30%  net/http.(*conn).readRequest
         0     0%  5.91% 153589.85MB 23.04%  github.com/julienschmidt/httprouter.(*Router).ServeHTTP
         0     0%  5.91% 153589.85MB 23.04%  github.com/julienschmidt/httprouter.(*Router).ServeHTTP-fm
         0     0%  5.91% 153540.85MB 23.04%  xxxxx/api/server/router.(*httpRouter).Register.func1
       2MB 0.0003%  5.91% 153117.78MB 22.97%  xxxxx/api/server/filter.Validate
151134.52MB 22.68% 28.58% 151135.02MB 22.68%  runtime.rawstringtmp
         0     0% 28.58% 150714.90MB 22.61%  xxxxx/api/server/router/naming/v1.(*serviceRouter).(git.intra.weibo.com/platform/vintage/api/server/router/naming/v1.service)-fm
         0     0% 28.58% 150714.90MB 22.61%  xxxxx/api/server/router/naming/v1.(*serviceRouter).service
         0     0% 28.58% 141200.76MB 21.18%  net/http.Redirect
132334.96MB 19.85% 48.44% 132342.95MB 19.86%  runtime.mapassign
      42MB 0.0063% 48.44% 125834.16MB 18.88%  xxxxx/api/server/router/naming/v1.heartbeat
         0     0% 48.44% 122316.23MB 18.35%  xxxxxx/config.(*config).Lookup
如上所示,我们就很容易的查找到这些函数是被哪些函数调用的。
根据代码的调用关系,filter.TransURLTov1会调用filter.Role30x,但是他们之间的cum%差值有12.45%,因此 我们可以得知filter.TransURLTov1内部自己直接分配的内存量达到了整个进程分配内存总量的12.45%,这可是一个 值得大大优化的地方。
然后我们可以输入命令web,其会给我们的浏览器弹出一个.svg图片,其会把这些累积关系画成一个拓扑图,提供给 我们。或者直接执行go tool pprof -alloc_space -cum -svg http://127.0.0.1:8080/debug/pprof/heap > heap.svg来生 成heap.svg图片。
下面我们取一个图片中的一个片段进行分析:
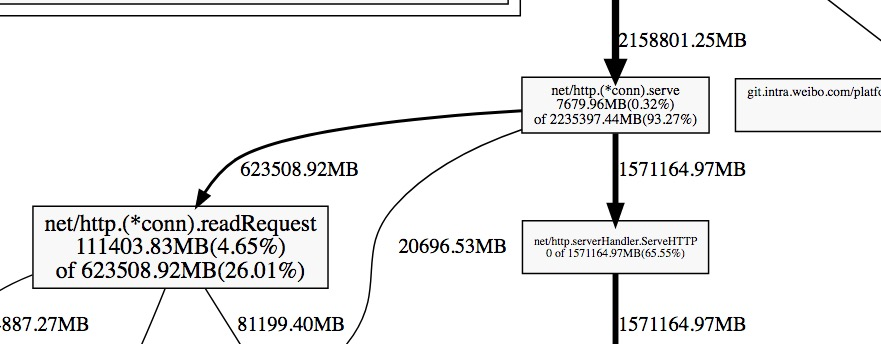
每一个方块为pprof记录的一个函数调用栈,指向方块的箭头上的数字是记录的该栈累积分配的内存向,从方块指出的 箭头上的数字为该函数调用的其他函数累积分配的内存。他们之间的差值可以简单理解为本函数除调用其他函数外,自 身分配的。方块内部的数字也体现了这一点,其数字为:(自身分配的内存 of 该函数累积分配的内存)。
--inuse/alloc_space --inuse/alloc_objects区别
通常情况下:
- 用
--inuse_space来分析程序常驻内存的占用情况; - 用
--alloc_objects来分析内存的临时分配情况,可以提高程序的运行速度。
go-torch
除了直接使用go tool pprof外,我们还可以使用更加直观了火焰图 。因此我们可以直接使用go-torch来生成golang程序的火焰图,该工具也直接 依赖pprof/go tool pprof等。该工具的相关安装请看该项目的介绍。该软件的a4daa2b 以后版本才支持内存的profiling。
我们可以使用
go-torch -alloc_space http://127.0.0.1:8080/debug/pprof/heap --colors=mem
go-torch -inuse_space http://127.0.0.1:8080/debug/pprof/heap --colors=mem
注意:-alloc_space/-inuse_space参数与-u/-b等参数有冲突,使用了-alloc_space/-inuse_space后请将pprof的 资源直接追加在参数后面,而不要使用-u/-b参数去指定,这与go-torch的参数解析问题有关,看过其源码后既能明白。 同时还要注意,分析内存的URL一定是heap结尾的,因为默认路径是profile的,其用来分析cpu相关问题。
通过上面2个命令,我们就可以得到alloc_space/inuse_space含义的2个火焰图,例如 alloc_space.svg/inuse_space.svg。 我们可以使用浏览器观察这2张图,这张图,就像一个山脉的截面图,从下而上是每个函数的调用栈,因此山的高度跟函数 调用的深度正相关,而山的宽度跟使用/分配内存的数量成正比。我们只需要留意那些宽而平的山顶,这些部分通常是我们 需要优化的地方。
testing
当我们需要对go test中某些test/benchmark进行profiling时,我们可以使用类似的方法。例如我们可以先使用go test 内置的参数生成pprof数据,然后借助go tool pprof/go-torch来分析。
- 生成cpu、mem的pprof文件
go test -bench=BenchmarkStorageXXX -cpuprofile cpu.out -memprofile mem.out - 此时会生成一个二进制文件和2个pprof数据文件,例如
storage.test cpu.out mem.out - 然后使用go-torch来分析,二进制文件放前面
#分析cpu
go-torch storage.test cpu.out
#分析内存
go-torch --colors=mem -alloc_space storage.test mem.out
go-torch --colors=mem -inuse_space storage.test mem.out
优化建议
Debugging performance issues in Go programs 提供了一些常用的优化建议:
1 将多个小对象合并成一个大的对象
2 减少不必要的指针间接引用,多使用copy引用
例如使用bytes.Buffer代替*bytes.Buffer,因为使用指针时,会分配2个对象来完成引用。
3 局部变量逃逸时,将其聚合起来
这一点理论跟1相同,核心在于减少object的分配,减少gc的压力。 例如,以下代码
for k, v := range m {
	k, v := k, v   // copy for capturing by the goroutine
	go func() {
		// use k and v
	}()
}
可以修改为:
for k, v := range m {
	x := struct{ k, v string }{k, v}   // copy for capturing by the goroutine
	go func() {
		// use x.k and x.v
	}()
}
修改后,逃逸的对象变为了x,将k,v2个对象减少为1个对象。
4 []byte的预分配
当我们比较清楚的知道[]byte会到底使用多少字节,我们就可以采用一个数组来预分配这段内存。 例如:
type X struct {
    buf      []byte
    bufArray [16]byte // Buf usually does not grow beyond 16 bytes.
}

func MakeX() *X {
    x := &X{}
    // Preinitialize buf with the backing array.
    x.buf = x.bufArray[:0]
    return x
}
5 尽可能使用字节数少的类型
当我们的一些const或者计数字段不需要太大的字节数时,我们通常可以将其声明为int8类型。
6 减少不必要的指针引用
当一个对象不包含任何指针(注意:strings,slices,maps 和chans包含隐含的指针),时,对gc的扫描影响很小。 比如,1GB byte 的slice事实上只包含有限的几个object,不会影响垃圾收集时间。 因此,我们可以尽可能的减少指针的引用。
7 使用sync.Pool来缓存常用的对象
注意
go1.9、go1.9.2之间的版本go tool pprof引入了一个BUG,会导致上面的内存分析命令失败。 下面给出一种修复办法:
cd $GOROOT/src/cmd/vendor/github.com/google
rm pprof
git clone https://github.com/google/pprof.git #确保在版本`e82ee9addc1b6c8e1d667ed6de0194241e1e03b5`之后
rm $GOROOT/pkg/darwin_amd64/cmd/vendor/github.com/google/pprof
cd $GOROOT/src/cmd/pprof
go build
mv pprof $GOROOT/pkg/tool/darwin_amd64/pprof
参考
- profiling-go-programs
- Optimising Go allocations using pprof
- Debugging performance issues in Go programs
- Debugging performance issues in Go programs 翻译(貌似是机器翻译的,语义不是很通顺)
- Golang Slices And The Case Of The Missing Memory
Debugging performance issues in Go* programs https://software.intel.com/content/www/us/en/develop/blogs/debugging-performance-issues-in-go-programs.html
Debug Go Like a Pro. From profiling to debugging and… | by Tyler Finethy | Better Programming | Medium https://medium.com/better-programming/debug-go-like-a-pro-213d4d74e940
From profiling to debugging and everything in between
Once you understand the basics, Golang can make you more productive than ever before. But what do you do when things go wrong?
You may not know this, but Go natively includes pprof for recording and visualizing run-time profiling data. Third-party tools like delve add support for line-by-line debugging. Leak and race detectors can defend against non-deterministic behavior.
If you haven’t seen or used these tools before, they will quickly become powerful additions to your arsenal of Golang tools.
Why Don’t I Just Print Everything?
I’ve met a lot of developers who rarely open the debugger when they run into an issue with their code. I don’t think that’s wrong. If you’re writing unit tests, linting your code, and refactoring along the way, then the quick-and-dirty approach can work for a majority of cases.
Conversely, I’ve been in the throes of troubleshooting problems and realized it’s quicker to pepper in some breakpoints and open an interactive debugger than continually add assertions and print statements.
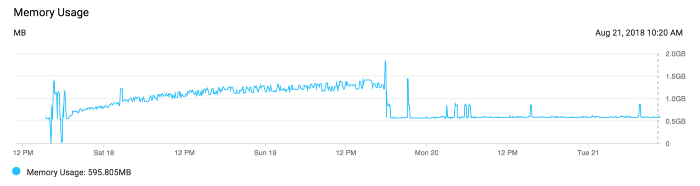
For example, one day I was looking at the memory graph for a web application I helped maintain. Every day the total memory usage slowly increased to the point that the server needed to be restarted to remain stable. This is a classic example of a memory leak.
The quick-and-dirty approach suggests that we read through the code ensuring spawned goroutines exit, allocated variables get garbage collected, connections properly close, etc. Instead, we profiled the application and found the memory leak in a matter of minutes. An elusive, single statement caused it — usually the case for this class of error.
This overview will introduce you to some of the tools I use almost every day to solve problems like this one.
Profiling Recording and Visualization
To get started, let's take a basic Golang web server with a graceful shutdown and send some artificial traffic. Then we’ll use the pprof tool to gather as much information as possible.
// main.go
package main

import (
    "fmt"
    "log"
    "net/http"
    "time"
)
func handler(w http.ResponseWriter, r *http.Request) {
    fmt.Fprintf(w, "Hello World!\n")
}

func main() {
    srv := http.Server{
        Addr:         ":8080",
        ReadTimeout:  time.Minute,
        WriteTimeout: time.Minute,
    }
    http.HandleFunc("/", handler)
    done := make(chan os.Signal, 1)
    signal.Notify(done, os.Interrupt, syscall.SIGINT, syscall.SIGTERM)

    go func() {
        srv.ListenAndServe()
    }()
    <-done
    err := srv.Shutdown(context.Background())
    if err != nil {
        log.Fatal(err)
    }
}
We can ensure this works by doing:
$ go run main.go &
$ curl localhost:8080
Hello World!
Now we can profile the CPU by including this snippet:
...
f, err := os.Create("cpu.prof")
if err != nil {
    log.Fatal(err)
}
err = pprof.StartCPUProfile(f)
if err != nil {
    log.Fatal(err)
}
defer pprof.StopCPUProfile()
...
We’ll use a load testing tool to exercise the web server thoroughly to simulate normal to heavy traffic. I used the testing tool vegeta to accomplish this:
$ echo "GET http://localhost:8080" | vegeta attack -duration=5s
Hello world!
...
When we shut down the go web server, we’ll see a file, cpu.prof, that contains the CPU profile. This profile can then be visualized with the pprof tool:
$ go tool pprof cpu.prof
Type: cpu
Time: Jan 16, 2020 at 4:51pm (EST)
Duration: 9.43s, Total samples = 50ms ( 0.53%)
Entering interactive mode (type "help" for commands, "o" for options)
(pprof) top 10
Showing nodes accounting for 50ms, 100% of 50ms total
Showing top 10 nodes out of 24
      flat  flat%   sum%        cum   cum%
      20ms 40.00% 40.00%       20ms 40.00%  syscall.syscall
...
This is good a good start, but Go can do better. We want to profile our application as it receives traffic, that way we don’t have to rely on simulated traffic or add additional code to write profiles to file. Adding the net/http/pprof import will automatically add additional handlers to our web server:
import _ "net/http/pprof"
With that added, we can hit the /debug/pprof/ route through our web browser and see the pprof page teeming with information.
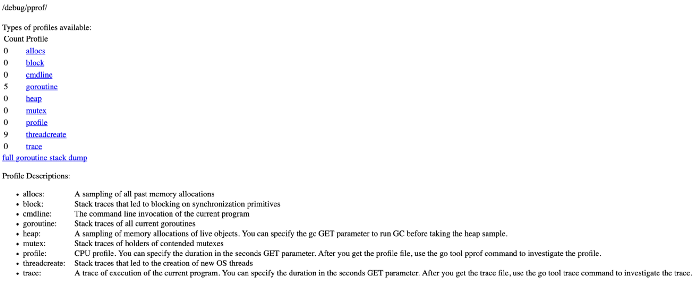
We can get the same information as before by running the command:
$ go tool pprof -top http://localhost:8080/debug/pprof/heap
You can also:
- Generate images based off of the type of profile.
- Create Flame Graphs to visualize the time spent by the application.
- Track Goroutines to detect leaks before they cause degraded service.
Note that for production web servers, we rarely want to avoid exposing this information to the world and should instead bind them to a different internal port.
Delve the Interactive Debugger
Delve is advertised as:
… a simple, full featured debugging tool for Go. Delve should be easy to invoke and easy to use. Chances are if you’re using a debugger, things aren’t going your way. With that in mind, Delve should stay out of your way as much as possible.
To that end, it works really well when you have an issue that’s taking just a little too long to figure out.
Getting started with the tool is fairly easy, just follow the installation steps. Add a runtime.Breakpoint() statement and run your code using dlv:
$ dlv debug main.go
Type 'help' for list of commands.
(dlv) continue
Once you hit the breakpoint you’ll see the block of code, for example in the webserver above I put the it in the handler:
> main.handler() ./main.go:20 (PC: 0x1495476)
    15:         _ "net/http/pprof"
    16: )
    17:
    18: func handler(w http.ResponseWriter, r *http.Request) {
    19:         runtime.Breakpoint()
=>  20:         fmt.Fprintf(w, "Hello World!\n")
    21: }
    22:
    23: func main() {
    24:         srv := http.Server{
    25:                 Addr:         ":8080",
(dlv)
Now you can go line by line using the next or n command or dig deeper into a function using the step or s command.
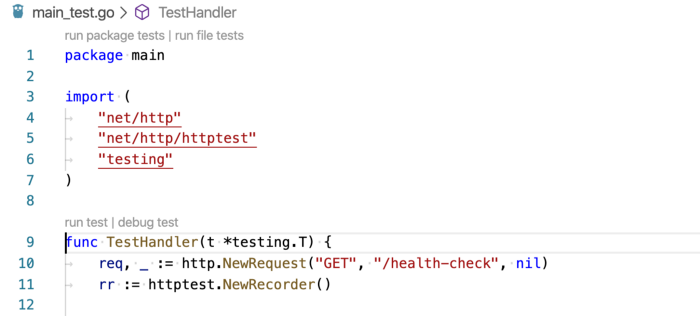
If you’re a fan of a nice UI and clicking buttons instead of using your keyboard, VS Code has great delve support. When writing unit tests using the native testing library, you’ll see a button to debug test which will initialize delve and let you step through the code via VS Code in an interactive session.
For more information on debugging Go code using VS Code check out the Microsoft wiki on it.
Delve can make adding breakpoints, testing assertions, and diving deep into packages a breeze. Don’t be afraid to use it the next time you get stuck on a problem and want to know more about what’s happening.
Leak and Race Detectors
The last topic I’m going to cover is how to add Golang leak and race detectors to your tests. If you haven’t encountered a race condition or experienced a Goroutine memory leak, consider yourself lucky.
In 2017 Uber open-sourced the goleak package, which is a simple tool to check that marks the given TestingT as failed if any extra goroutines are found by Find.
It looks like this:
func TestA(t *testing.T) {
   defer goleak.VerifyNone(t)
   // test logic here.
}
While you’re doing complex asynchronous work, you can ensure that you both avoid regressions and follow the fifth tenet of The Zen of Go:
Before you launch a goroutine,know when it will stop.
Finally, after ensuring you have no Goleaks, you’ll want to protect against race conditions. Thankfully the data race detector is built-in. Consider the example from the race detector’s documentation:
func main() {
	c := make(chan bool)
	m := make(map[string]string)
	go func() {
		m["1"] = "a" // First conflicting access.
		c <- true
	}()
	m["2"] = "b" // Second conflicting access.
	<-c
	for k, v := range m {
		fmt.Println(k, v)
	}
}
This is a data race that can lead to crashes and memory corruption. Running this snippet with the -race flag leads to a panic with a helpful error message:
go run -race main.go
==================
WARNING: DATA RACE
Write at 0x00c0000e2210 by goroutine 8:
  runtime.mapassign_faststr()
      /usr/local/Cellar/go/1.13.6/libexec/src/runtime/map_faststr.go:202 +0x0
  main.main.func1()
      /PATH/main.go:19 +0x5dPrevious write at 0x00c0000e2210 by main goroutine:
  runtime.mapassign_faststr()
      /usr/local/Cellar/go/1.13.6/libexec/src/runtime/map_faststr.go:202 +0x0
  main.main()
      /PATH/main.go:22 +0xc6Goroutine 8 (running) created at:
  main.main()
      /PATH/main.go:18 +0x97
==================
2 b
1 a
Found 1 data race(s)
While you can use the flag during execution of your code, it’s most helpful to add to your go test command to detect races as you write tests.
Conclusion
These are just some of the great tools available in the Golang ecosystem to aid in observing, debugging, and preventing production failures in your codebases. If you’re looking to go further I recommend taking a look at:
- Distributed tracing like Open-tracing Go.
- Time-series monitoring using a tool like Prometheus.
- Structured logging using logrus.
For more information on any of the tools listed above check out the resources section for full documentation and manuals.
func main() {
c := make(chan bool)
m := make(map[string]string)
go func() {
m["1"] = "a" // First conflicting access.
c <- true
}()
m["2"] = "b" // Second conflicting access.
<-c
for k, v := range m {
fmt.Println(k, v)
}
}


 浙公网安备 33010602011771号