
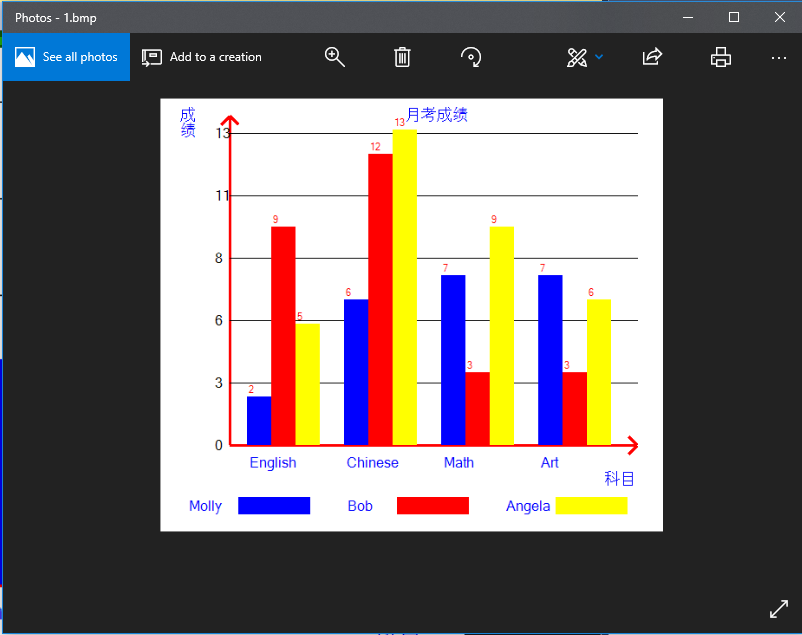
C#用GDI+解析Json文件绘制Chart


using System.Collections.Generic;
namespace Chart
{
    public class Program
    {
        static void Main(string[] args)
        {
            Chart chart = new Chart();
            ChartType chartType = ChartType.Histogram;
            string path = @"..\..\JSON.json";
            DataSource dataSource = new JsonDataSource();
            List<Composition> Compositions = dataSource.GetDataList(path);
            chart.Compositions.AddRange(Compositions);
            chart.Draw(chartType);
            chart.Save();
        }
    }
}
using System;
using System.Collections.Generic;
using System.Diagnostics;
using System.Drawing;
namespace Chart
{
    public class Chart
    {
        private Bitmap bmp = new Bitmap(600, 600);
        List<Composition> composition = new List<Composition>();
        public List<Composition> Compositions { get { return composition; } }
        private float width;

        private float Width
        {
            get
            {
                int sum = 0;
                foreach (var composition in Compositions)
                {
                    sum += composition.DataPoints.Count + 1;
                }
                width = (float)420 / sum;
                return width;
            }
        }

        public void Draw(ChartType chartType)
        {
            Series series;

            switch (chartType)
            {
                case ChartType.LineChart:
                    series = new LineSeries();
                    break;

                case ChartType.Histogram:
                    series = new HistogramSeries();
                    break;

                case ChartType.PieChart:
                    series = new PieSeries();
                    break;

                default:
                    throw new ArgumentOutOfRangeException("Nonexistent ChartType!");
            }

            foreach (var comPosition in Compositions)
            {
                series.Legend.Add(comPosition.Name);
            }

            Platform platform = new Windows(bmp);

            series.Draw(Width, platform, Compositions);
        }

        public void Save()
        {
            bmp.Save(@"..\..\1.bmp");
            Process.Start(@"..\..\1.bmp");
        }
    }
}
using System.Collections;
using System.Collections.Generic;
using System.Drawing;
namespace Chart
{
    public abstract class Series
    {
        ArrayList legend = new ArrayList();
        public ArrayList Legend { get { return legend; } set { } }

        protected PointF PointFormLarge;
        protected PointF PointFormSmall;

        private void DrawChart(Platform g)
        {
            g.FillRectangle(g.WBrush, 20, 20, 580, 500);
        }

        protected abstract void DrawCore(float width, Platform g, List<Composition> Compositions);

        public void Draw(float width, Platform g, List<Composition> Compositions)
        {
            PointFormLarge = new PointF(width * Compositions.Count + width, 0);
            PointFormSmall = new PointF(width, 0);
            DrawChart(g);
            DrawCore(width, g, Compositions);
        }
    }
}
using System.Collections.Generic;
using System.Drawing;
using System;
namespace Chart
{
    public class HistogramSeries : Series
    {

        private void DrawAxes(Platform g)
        {
            g.DrawLine(g.Rpen, new Point(100, 40), new Point(100, 420));
            g.DrawLine(g.Rpen, new Point(100, 40), new Point(90, 50));
            g.DrawLine(g.Rpen, new Point(100, 40), new Point(110, 50));
            g.DrawLine(g.Rpen, new Point(100, 420), new Point(570, 420));
            g.DrawLine(g.Rpen, new Point(570, 420), new Point(560, 410));
            g.DrawLine(g.Rpen, new Point(570, 420), new Point(560, 430));

            g.DrawString("月考成绩", g.LargeFont, g.Bbrush, new RectangleF(300, 30, 170, 50));
            g.DrawString("科目", g.LargeFont, g.Bbrush, new RectangleF(530, 450, 100, 40));
            g.DrawString("成绩", g.LargeFont, g.Bbrush, new RectangleF(40, 30, 40, 40));

            for (int i = 0; i < 5; i++)
            {
                g.DrawLine(g.BlackPen, new Point(100, 60 + 72 * i), new Point(570, 60 + 72 * i));
            }
        }

        private void DrawLegend(Platform g)
        {
            int LegendWidth = 250 / (Legend.Count - 1);
            int StringX = 50;
            int LegendX = StringX + 60;
            int k = 0;
            foreach (string legend in Legend)
            {
                switch (k)
                {
                    case 0:
                        g.Brush = Brushes.Blue;
                        break;
                    case 1:
                        g.Brush = Brushes.Red;
                        break;
                    case 2:
                        g.Brush = Brushes.Yellow;
                        break;
                    case 3:
                        g.Brush = Brushes.Green;
                        break;
                }
                g.DrawString(legend, g.LargeFont, Brushes.Blue, StringX, 480);
                Rectangle rect = new Rectangle(LegendX, 480, LegendWidth * 2 / 3, 20);
                g.FillRectangle(g.Brush, rect);

                StringX += 550 / Legend.Count;
                LegendX = StringX + 60;
                k++;
            }
        }


        protected override void DrawCore(float width, Platform g, List<Composition> Compositions)
        {
            DrawAxes(g);
            DrawLegend(g);
            foreach (var datapoint in Compositions[0].DataPoints)
            {
                g.DrawString(datapoint.XValue, g.LargeFont, g.Bbrush, 120, 430);
                g.TranslateTransform(PointFormLarge.X, PointFormLarge.Y);
            }
            g.ResetTransform();

            int YValueMax = 0;
            foreach (var composition in Compositions)
            {
                if (YValueMax <= composition.Max)
                {
                    YValueMax = composition.Max;
                }
            }

            g.YRatioScale = 370 / YValueMax;


            for (int i = 0; i <= 5; i++)
            {
                g.DrawString(Math.Ceiling(360/5/ g.YRatioScale*(5-i)).ToString(), g.LargeFont, g.BlackBrush, new RectangleF(80, 50 + 72 * i, 50, 50));
            }


            void DrawRectangle(float x, float y, float Width, float height, Composition composition)
            {
                Rectangle rect = new Rectangle((int)x, (int)y, (int)width, (int)height);
                g.FillRectangle(composition.BrushColor, rect);
            }
            int j = 1;
            foreach (var composition in Compositions)
            {
                Compositions[0].BrushColor = Brushes.Blue;
                Compositions[1].BrushColor = Brushes.Red;
                Compositions[2].BrushColor = Brushes.Yellow;
                foreach (var datapoint in composition.DataPoints)
                {
                    DrawRectangle(120, 420 - datapoint.YValue * g.YRatioScale, width, datapoint.YValue * g.YRatioScale, composition);
                    g.DrawString(datapoint.YValue.ToString(), g.SmallFont, Brushes.Red, 120, 420 - datapoint.YValue * g.YRatioScale - 15);
                    g.TranslateTransform(PointFormLarge.X, PointFormLarge.Y);
                }
                g.ResetTransform();
                for (int i = 0; i < j; i++)
                {
                    g.TranslateTransform(PointFormSmall.X, PointFormSmall.Y);
                }
                j++;
            }
            g.ResetTransform();
        }
    }
}
using System.Drawing;
namespace Chart
{
    public abstract class Platform
    {
        public abstract void FillRectangle(Brush b, int x, int y, int width, int height);
        public abstract void DrawLine(Pen pen, Point pt1, Point pt2);
        public abstract void DrawString(string s, Font font, Brush brush, RectangleF layoutRectangle);
        public abstract void DrawString(string s, Font font, Brush brush, float x, float y);
        public abstract void FillRectangle(Brush brush, Rectangle rect);
        public abstract void TranslateTransform(float dx, float dy);
        public abstract void ResetTransform();

        private Brush wbrush = Brushes.White;
        private Brush bbrush = Brushes.Blue ;
        private Brush blackBrush = Brushes.Black;
        private Brush brush ;
        Pen rpen = new Pen(Color.Red, 3);
        Pen blackPen = new Pen(Color .Black ,1);
        Font largeFont = new Font("黑体", 12);
        Font smallFont = new Font("黑体", 8);
        private float yRatioScale;

        public Brush WBrush { get => wbrush; set => wbrush = value; }
        public Pen Rpen { get => rpen; set => rpen = value; }
        public Font LargeFont { get => largeFont; set => largeFont = value; }
        public Font SmallFont { get => smallFont; set => smallFont = value; }
        public Brush Bbrush { get => bbrush; set => bbrush = value; }
        internal float YRatioScale { get => yRatioScale; set => yRatioScale = value; }
        public Brush Brush { get => brush; set => brush = value; }
        public Pen BlackPen { get => blackPen; set => blackPen = value; }
        public Brush BlackBrush { get => blackBrush; set => blackBrush = value; }
    }
}
using System.Drawing;

namespace Chart
{
    public class Windows : Platform
    {
        private readonly Graphics graphics;

        public Windows(Bitmap bmp)
        {
            graphics = Graphics.FromImage(bmp);
        }

        public override void FillRectangle(Brush b, int x, int y, int width, int height)
        {
            graphics.FillRectangle(b, x, y, width, height);
        }
        public override void DrawLine(Pen pen, Point pt1, Point pt2)
        {
            graphics.DrawLine(pen, pt1, pt2);
        }
        public override void DrawString(string s, Font font, Brush brush, RectangleF layoutRectangle)
        {
            graphics.DrawString(s, font, brush, layoutRectangle);
        }
        public override void DrawString(string s, Font font, Brush brush, float x, float y)
        {
            graphics.DrawString(s, font, brush, x, y);
        }
        public override void FillRectangle(Brush brush, Rectangle rect)
        {
            graphics.FillRectangle(brush, rect);
        }
        public override void TranslateTransform(float dx, float dy)
        {
            graphics.TranslateTransform(dx, dy);
        }
        public override void ResetTransform()
        {
            graphics.ResetTransform();
        }
    }
}
using System.Collections.Generic;
using System.Drawing;
namespace Chart
{
    public class Composition
    {
        private List<DataPoint> dataPoints;
        private string name;
        private Brush brushColor;
        private int max;

        public List<DataPoint> DataPoints { get => dataPoints; set => dataPoints = value; }
        public string Name { get => name; set => name = value; }
        public Brush BrushColor { get => brushColor; set => brushColor = value; }

        public int Max              //Linq中提供的计算List最大值的方法是集合中的元素即为可比较的数值类型,DataPoint不是,所以这里的方法自定义
        {
            get
            {
                foreach (var datapoint in DataPoints)
                {
                    if (datapoint.YValue >= max)
                    {
                        max = datapoint.YValue;
                    }
                }
                return max;
            }
        }
    }
}
namespace Chart
{
    public class DataPoint
    {
        private string xValue;
        private int yValue;

        public int YValue { get => yValue; set => yValue = value; }
        public string XValue { get => xValue; set => xValue = value; }
    }
}
using System.Collections.Generic;
using System.IO;
namespace Chart
{
    public abstract class DataSource
    {
        protected abstract List<Composition> GetDataListCore(string path);

        public List<Composition> GetDataList(string path)
        {
            if (!File.Exists(path))
            {
                throw new FileNotFoundException(path);
            }
            return GetDataListCore(path);
        }
    }
}
using Newtonsoft.Json;
using System.Collections.Generic;
using System.IO;
namespace Chart
{
    public class JsonDataSource : DataSource
    {
        protected override List<Composition> GetDataListCore(string path)
        {
          return  JsonConvert.DeserializeObject<List<Composition>>(File.ReadAllText(path));
        }
    }
}
[
  {
    "Name": "Molly",
    "DataPoints": [
      {
        "XValue": "English",
        "YValue": 2
      },
      {
        "XValue": "Chinese",
        "YValue": 6
      },
      {
        "XValue": "Math",
        "YValue": 7
      },
      {
        "XValue": "Art",
        "YValue": 7
      }
    ]
  },
  {
    "Name": "Bob",
    "DataPoints": [
      {
        "XValue": "English",
        "YValue": 9
      },
      {
        "XValue": "Math",
        "YValue": 12
      },
      {
        "XValue": "Art",
        "YValue": 3
      },
      {
        "XValue": "Chinese",
        "YValue": 3
      }
    ]
  },
  {
    "Name": "Angela",
    "DataPoints": [
      {
        "XValue": "English",
        "YValue": 5
      },
      {
        "XValue": "Math",
        "YValue": 13
      },
      {
        "XValue": "Art",
        "YValue": 9
      },
      {
        "XValue": "Chinese",
        "YValue": 6
      }
    ]
  }

]
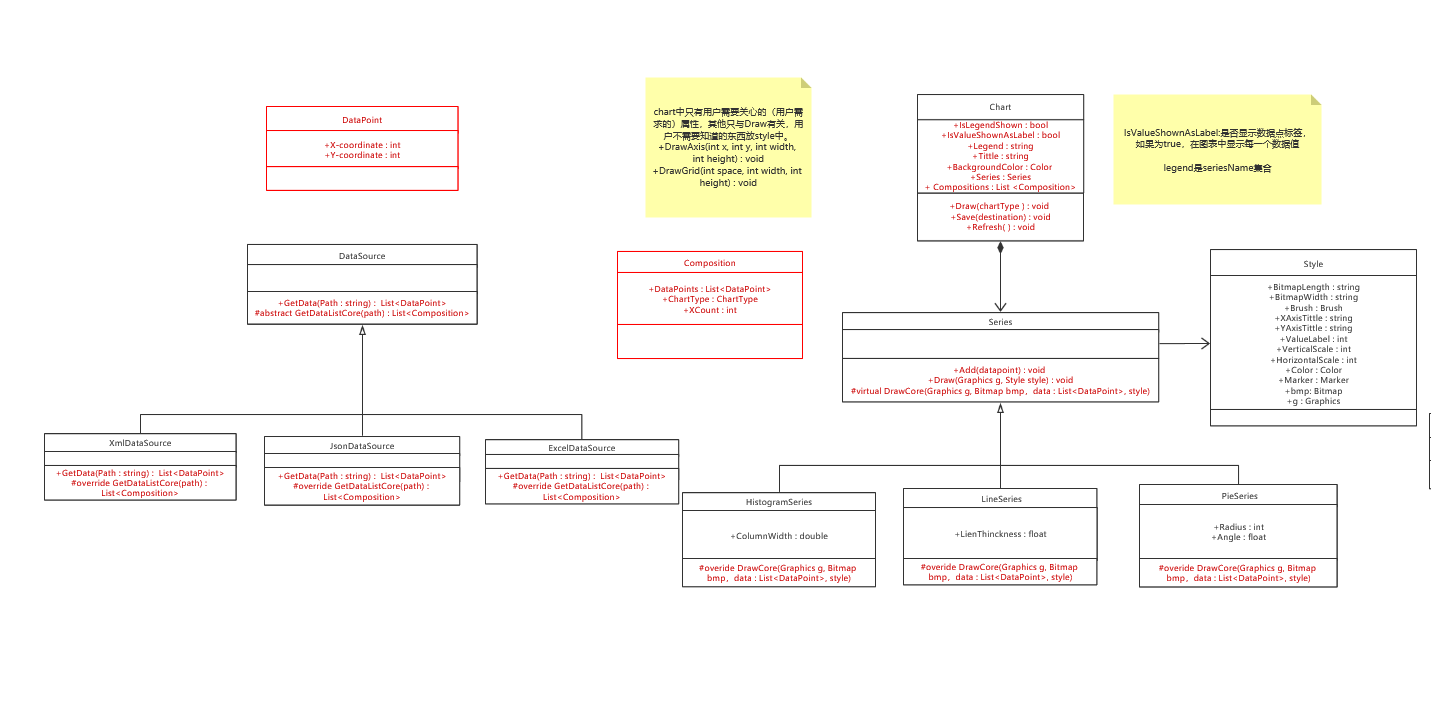
以下附上这个程序设计的UML类图
https://www.processon.com/view/link/5b4dbd93e4b00b08ad2085d7

 浙公网安备 33010602011771号