
如何使用siege测试服务器性能
siege是一款开源的压力测试工具,可以根据配置对一个WEB站点进行多用户的并发访问,记录每个用户所有请求过程的相应时间,并在一定数量的并发访问下重复进行。
1 安装
# make sure you have the ssl libs installed(http://digitalleafblower.com/?p=166)
yum install mod_ssl openssl
git clone https://github.com/JoeDog/siege.git
cat INSTALL  # 步骤
./utils/bootstrap
./configure --with-ssl=/usr/bin/openssl
make
make install
export PATH=$PATH:/usr/local/bin
验证:siege -V
2 get请求测试:
siege -c 100 -r 10 -f someScript.url
-c是并发量,-r是重复次数。并发量乘重复次数就是总的请求次数。
url文件就是一个文本,每行都是一个url,它会从里面随机访问的。
类似ab的纯并发压力测试:
siege -c 100 -r 10 http://www.google.com
(http://www.blogjava.net/iamtin/archive/2007/10/24/how_to_use_siege.html)
测试tornado程序性能:
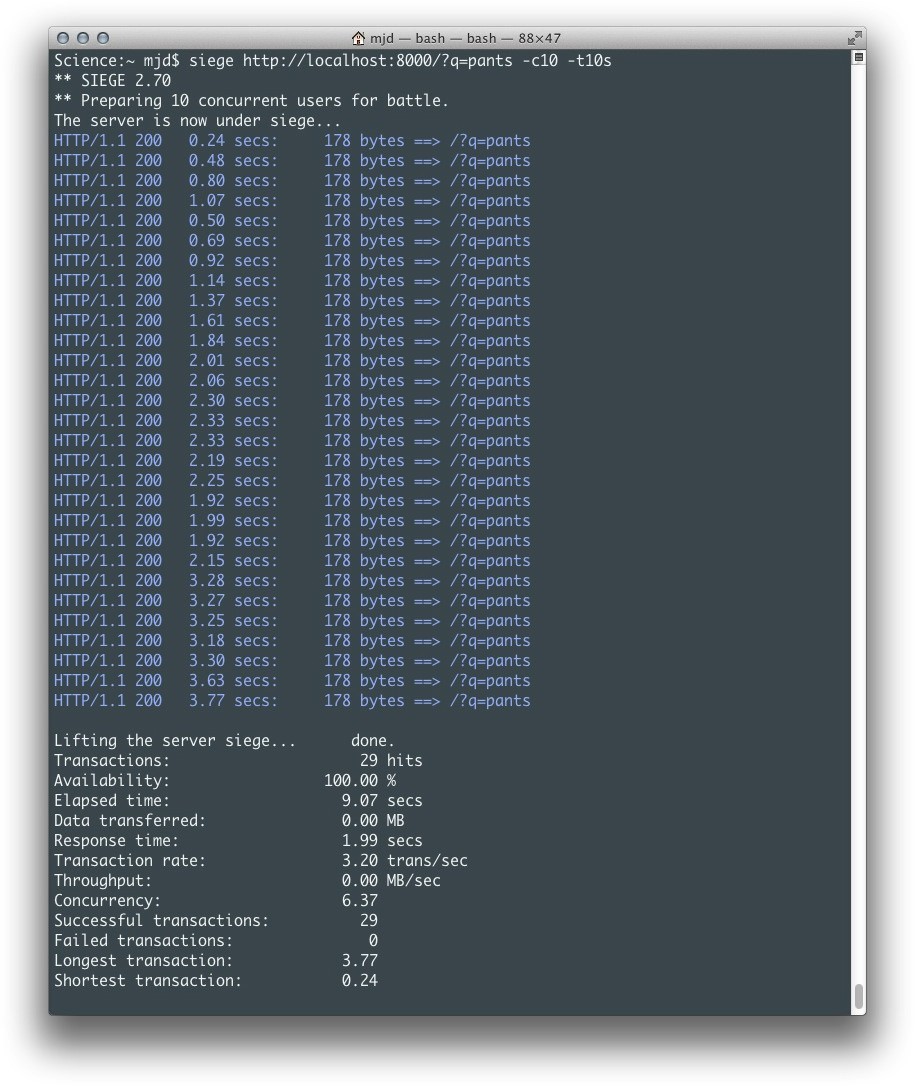
$ siege -c 1000 -t 10s 'http://mysite.cn:8090'

xxx

Lifting the server siege...
Transactions:           4191 hits
Availability:         100.00 %
Elapsed time:           9.12 secs
Data transferred:       871.92 MB
Response time:            0.50 secs
Transaction rate:       459.54 trans/sec
Throughput:          95.60 MB/sec
Concurrency:          231.10
Successful transactions:        4203
Failed transactions:             0
Longest transaction:          6.56
Shortest transaction:         0.04
3 post请求测试
siege -c 500 -r 1 '10.23.54.151:19595/v1/db/nova/service_get_all POST <./postfile.json
content_type被正确设置为application/json,服务器正常处理返回。原来siege只能通过文件的扩展名来确定content type格式
(http://blog.csdn.net/xuriwuyun/article/details/12711927)
# 默认Content-type: application/x-www-form-urlencoded
# -g GET, pull down HTTP headers and display the transaction.
siege -c 1000 -t 10s 'http://mysite.cn:8090/login-is POST node=xxx&password=xxx' -g
# map the file extension to the appropriate content-type
# Content-type: application/json
siege -c 10 "http://mysite:8001/query_code POST <./querycode.json"  -t 10s
4 其他web压力测试工具
siege简单易用,其缺点在于统计结果过于粗糙。
如果想知道请求的平均时间、连接、处理、等待时间等信息,可以用apache自带的AB工具(Apache Benchmark)
# 163yum源
cd /etc/yum.repos.d

#备份系统自带的yum源

mv CentOS-Base.repo CentOS-Base.repo.bk

#下载163网易的yum源:

#centos7.x:

wget http://mirrors.163.com/.help/CentOS7-Base-163.repo

#centos6.x:

wget http://mirrors.163.com/.help/CentOS6-Base-163.repo

#更新完yum源后,执行下边命令更新yum配置,使操作立即生效

yum makecache
ref(https://yq.aliyun.com/ziliao/115638)
安装好Apache,就自带AB了
yum install httpd
参数很多,一般我们用 -c 和 -n 参数就可以了. 例如:
./ab -c 1000 -n 1000 http://127.0.0.1/index.php
输出的关键参数包括但不限于:
Requests per second: 122.12 [#/sec] (mean)
//大家最关心的指标之一,相当于 LR 中的 每秒事务数 ,后面括号中的 mean 表示这是一个平均值
Time per request: 8188.731 [ms] (mean)
//大家最关心的指标之二,相当于 LR 中的 平均事务响应时间 ,后面括号中的 mean 表示这是一个平均值
Time per request: 8.189 [ms] (mean, across all concurrent requests)
//每个请求实际运行时间的平均值
Transfer rate: 162.30 [Kbytes/sec] received
//平均每秒网络上的流量,可以帮助排除是否存在网络流量过大导致响应时间延长的问题
Connection Times (ms)
min mean[+/-sd] median max // 最小值、平均数、中位数、最大值
Connect: 4 646 1078.7 89 3291
Processing: 165 992 493.1 938 4712
Waiting: 118 934 480.6 882 4554
Total: 813 1638 1338.9 1093 7785
ref(http://www.cnblogs.com/shipengzhi/archive/2012/10/09/2716766.html)
作者:kakashis
联系方式:fengshenjiev[AT]gmail.com
本文版权归作者所有,欢迎转载,演绎或用于商业目的,但是必须说明本文出处(包含链接)。

 浙公网安备 33010602011771号