


heatmap聚类图中的trick
今天在做基因的聚类分析,碰到了意想不到的情况。
library('gplots')
 mydist = function(x){
    dist(x,method = 'euclidean')
  }
  myclust = function(y){
    hclust(y,method='ward')
  }
  mycol = greenred(24)
  HM = heatmap.2(Exp_Data_Diff_Max_Probes,
            scale = 'row',
            distfun=mydist,
            hclustfun=myclust,
            trace='none', col = mycol)

但是,当比较热图(HM)里面的聚类树形图和自己通过函数画出来的树形图却发现并不一样!
  plot(as.hclust(HM$colDendrogram))
  plot(colclust <-myclust(mydist(t(Exp_Data_Diff_Max_Probes))))

通过查找源码,终于发现,热图函数中的树形图多出了一步:reorder
   Colv = colMeans(Exp_Data_Diff_Max_Probes,na.rm = T)
   ddc = reorder(as.dendrogram(colclust),Colv)
   colInd = order.dendrogram(ddc)
   colInd  #the reordered cluster has the same order of heatmap
Reorder 的作用在R的help文档中是说:“ a dendrogram where each node has a further attribute value with its corresponding weight. " "There're many different orderings of a dendrogram that are consistent with the structure imposed. This function takes a dendrogram and a vector of values and reorders the dendrogram in the order of the supplied vector, maintaining the constraints on the dendrogram." 确实,reorder并不改变树形图中形成的簇,只是让簇间和簇内的元素进行了reorder!
In the help document of reorder, type in the example codes:
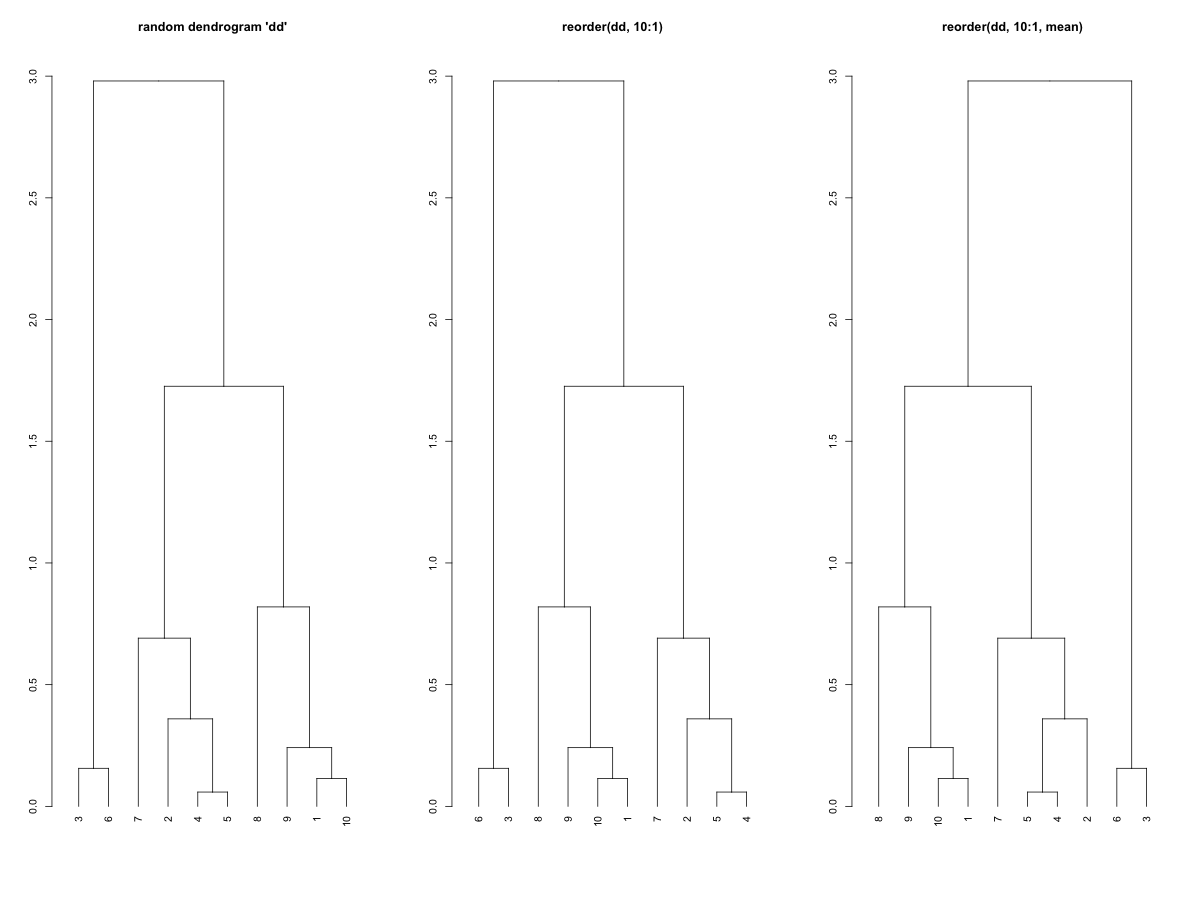
require(graphics)

set.seed(123)
x <- rnorm(10)
hc <- hclust(dist(x))
dd <- as.dendrogram(hc)
dd.reorder <- reorder(dd, 10:1)

op <- par(mfrow = c(1,3))
plot(dd, main = "random dendrogram 'dd'")
plot(dd.reorder, main = "reorder(dd, 10:1)")
plot(reorder(dd, 10:1, agglo.FUN = mean), main = "reorder(dd, 10:1, mean)")

par(op)
posted on 2013-04-04 07:25 Forever_YCC 阅读(1932) 评论(0) 收藏 举报


 浙公网安备 33010602011771号