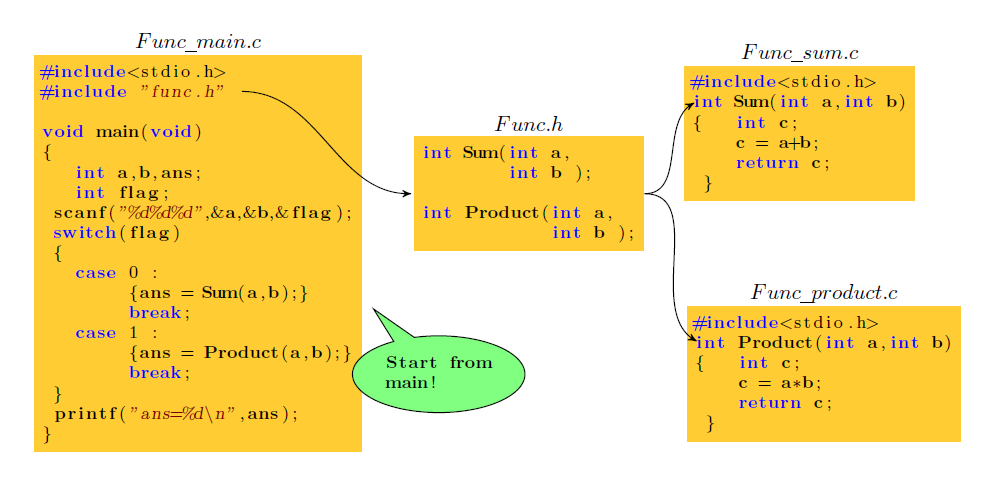
Latex中画出函数文件的调用关系拓扑图
流程图,思维导图,拓扑图通常能把我们遇到的一些复杂的关系结构用图形的方式展现出来。在Latex中要想画这样的拓扑图,有一个很好用的绘图工具包 pgf/tikz 。
1.pgf/tikz的安装:pgf/tikz 绘图工具用到的宏是 \usepackage{tikz} 。如果你的Latex并不带有这个宏包,那就需要参考[1]中进行安装。也可以直接下载使用带有这个宏包的新版本 CTeX_2.9.2.164_Full。
2.pgf/tikz的使用:参考[2]pgf/tikz使用说明,这里详细介绍了pgf/tikz的各种用法。
利用Latex绘制函数关系的图
\documentclass{report}
\usepackage{pgf}
\usepackage{tikz}
\usepackage{listings}
\usepackage{xcolor}
\usepackage{graphicx}

\usetikzlibrary{shapes.callouts}
\usetikzlibrary{arrows,decorations.pathmorphing, backgrounds, positioning, fit, petri, automata}
\definecolor{yellow1}{rgb}{1,0.8,0.2}
\lstset{
    basicstyle=\footnotesize,
    framexleftmargin=1.5mm,
    keywordstyle=\color{blue}\bfseries,
    identifierstyle=\bf,
    commentstyle=\it\color[RGB]{96,96,96},
    stringstyle=\rmfamily\slshape\color[RGB]{128,0,0},
    showstringspaces=false
}

\begin{document}
\begin{tikzpicture}
[remember picture, note/.style={ellipse callout, fill=#1},
->,>=stealth',shorten >=1pt,auto,node distance=2.8cm,semithick]

\tikzstyle{every state}=[rectangle,fill=yellow1,draw=none,text=black]

%创建对象:\node(对象属性)   (对象名称)  at (对象坐标) {对象内容};
\node[state]         (fun_main) at (-32, 16)        {
\begin{lstlisting}[language={C}]
#include<stdio.h>
#include "func.h"

void main(void)
{
   int a,b,ans;
   int flag;
 scanf("%d%d%d",&a,&b,&flag);
 switch(flag)
 {
   case 0 :
        {ans = Sum(a,b);}
        break;
   case 1 :
        {ans = Product(a,b);}
        break;
 }
 printf("ans=%d\n",ans);
}
\end{lstlisting}
};
\node[state,fill=none]         (filename_main) at ([yshift=0.2cm]fun_main.north)        {$Func\underline{\hspace{0.5em}}main.c$};

\node[state]         (fun0) at (-26.5, 17)        {
\begin{lstlisting}[language={C}]
int Sum(int a,
        int b );

int Product(int a,
            int b );
\end{lstlisting}
};
\node[state,fill=none]         (file0) at ([yshift=0.2cm]fun0.north)        {$Func.h$};

\node[state]         (fun1) at (-22, 18)        {
\begin{lstlisting}[language={C}]
#include<stdio.h>
int Sum(int a,int b)
{   int c;
    c = a+b;
    return c;
 }
\end{lstlisting}
};
\node[state,fill=none]         (file1) at ([yshift=0.2cm]fun1.north)        {$Func\underline{\hspace{0.5em}}sum.c$};

\node[state]         (fun2) at (-21.6, 14)        {
\begin{lstlisting}[language={C}]
#include<stdio.h>
int Product(int a,int b)
{   int c;
    c = a*b;
    return c;
 }
\end{lstlisting}
};
\node[state,fill=none]         (file2) at ([yshift=0.2cm]fun2.north)        {$Func\underline{\hspace{0.5em}}product.c$};

%\node[标注填充颜色,相对标注对象坐标,边框] (标注对象名称) at (标注对象的坐标) {内容};
\node[note=green!50, callout relative pointer={(-0.5,0.5)}, draw] (note_name)at (-28,14) {
\begin{lstlisting}[language={C}]
Start from
main!
\end{lstlisting}
};


%箭头:([横平移,纵平移]箭头端点相对对象1的位置) (out:箭头出射角度,int:箭头入射角度) ([横平移,纵平移]箭头端点相对对象2的位置);
\draw[->] ([xshift=-2.0cm,yshift=-0.6cm]fun_main.north east) to[out=0,in=180]  ([xshift=0cm,yshift=0cm]fun0.west);
\draw[->] (fun0.east) to[out=0,in=210]  ([xshift=0.2cm,yshift=-0.6cm]fun1.north west);
\draw[->] (fun0.east) to[out=0,in=150]  ([xshift=0.2cm,yshift=-0.6cm]fun2.north west);
\end{tikzpicture}
\end{document}
排版出来的效果如下
参考:
[1] http://blog.csdn.net/mathsoperator/article/details/6747170
[2] http://mirror.lzu.edu.cn/CTAN/graphics/pgf/base/doc/pgfmanual.pdf
[3] Latex论坛,http://tex.stackexchange.com/
[4] Latex的一些奇技淫巧 - 颐和园工人的文章 - 知乎 https://zhuanlan.zhihu.com/p/493767981
[5] 关系图: https://www.mathcha.io/
[6] 关系图latex代码在线生成: https://q.uiver.app/
[7] Latex如何实现下面的关系图? - 知乎 https://www.zhihu.com/question/514898404

 浙公网安备 33010602011771号