
SQL Server自动化运维系列——监控性能指标脚本(Power Shell)
需求描述
一般在生产环境中,有时候需要自动的检测指标值状态,如果发生异常,需要提前预警的,比如发邮件告知,本篇就介绍如果通过Power shell实现状态值监控
监控值范围
根据经验,作为DBA一般需要监控如下系统能行指标
  cpu:

    \Processor(_Total)\% Processor Time
    \Processor(_Total)\% Privileged Time

    \SQLServer:SQL Statistics\Batch Requests/sec
    \SQLServer:SQL Statistics\SQL Compilations/sec
    \SQLServer:SQL Statistics\SQL Re-Compilations/sec
    \System\Processor Queue Length
    \System\Context Switches/sec

  Memory:

    \Memory\Available Bytes
    \Memory\Pages/sec
    \Memory\Page Faults/sec
    \Memory\Pages Input/sec
    \Memory\Pages Output/sec
    \Process(sqlservr)\Private Bytes
    \SQLServer:Buffer Manager\Buffer cache hit ratio
    \SQLServer:Buffer Manager\Page life expectancy
    \SQLServer:Buffer Manager\Lazy writes/sec
    \SQLServer:Memory Manager\Memory Grants Pending
    \SQLServer:Memory Manager\Target Server Memory (KB)
    \SQLServer:Memory Manager\Total Server Memory (KB)

  Disk:

    \PhysicalDisk(_Total)\% Disk Time
    \PhysicalDisk(_Total)\Current Disk Queue Length
    \PhysicalDisk(_Total)\Avg. Disk Queue Length
    \PhysicalDisk(_Total)\Disk Transfers/sec
    \PhysicalDisk(_Total)\Disk Bytes/sec
    \PhysicalDisk(_Total)\Avg. Disk sec/Read
    \PhysicalDisk(_Total)\Avg. Disk sec/Write

  SQL Server:

    \SQLServer:Access Methods\FreeSpace Scans/sec
    \SQLServer:Access Methods\Full Scans/sec
    \SQLServer:Access Methods\Table Lock Escalations/sec
    \SQLServer:Access Methods\Worktables Created/sec
    \SQLServer:General Statistics\Processes blocked
    \SQLServer:General Statistics\User Connections
    \SQLServer:Latches\Total Latch Wait Time (ms)
    \SQLServer:Locks(_Total)\Lock Timeouts (timeout > 0)/sec
    \SQLServer:Locks(_Total)\Lock Wait Time (ms)
    \SQLServer:Locks(_Total)\Number of Deadlocks/sec
    \SQLServer:SQL Statistics\Batch Requests/sec
    \SQLServer:SQL Statistics\SQL Re-Compilations/sec
上述指标含义,可以参照我上一篇文章:SQL Server需要监控哪些计数器
监控脚本
$server = "(local)"
$uid = "sa"
$db="master"
$pwd="password"
$mailprfname = "SendEmail"
$recipients = "787449667@qq.com"
$subject = "数据库指标异常了!"
$computernamexml = "f:\computername.xml"
$alter_cpuxml = "f:\alter_cpu.xml"
function GetServerName($xmlpath)
{
    $xml = [xml] (Get-Content $xmlpath)
    $return = New-Object Collections.Generic.List[string]
    for($i = 0;$i -lt $xml.computernames.ChildNodes.Count;$i++)
    {
        if ( $xml.computernames.ChildNodes.Count -eq 1)
        {
            $cp = [string]$xml.computernames.computername
        }
        else
        {
            $cp = [string]$xml.computernames.computername[$i]
        }
        $return.Add($cp.Trim())
    }
    $return
}

function GetAlterCounter($xmlpath)
{
    $xml = [xml] (Get-Content $xmlpath)
    $return = New-Object Collections.Generic.List[string]
    $list = $xml.counters.Counter
    $list
}

function CreateAlter($message)
{
    $SqlConnection = New-Object System.Data.SqlClient.SqlConnection
    $CnnString ="Server = $server; Database = $db;User Id = $uid; Password = $pwd"
    $SqlConnection.ConnectionString = $CnnString
    $CC = $SqlConnection.CreateCommand();
    if (-not ($SqlConnection.State -like "Open")) { $SqlConnection.Open() }

    $cc.CommandText=" EXEC msdb..sp_send_dbmail
             @profile_name  = '$mailprfname'
            ,@recipients = '$recipients'
            ,@body = '$message'
            ,@subject = '$subject'
"
    $cc.ExecuteNonQuery()|out-null
    $SqlConnection.Close();
}

$names = GetServerName($computernamexml)
$pfcounters = GetAlterCounter($alter_cpuxml)
foreach($cp in $names)
{
    $p = New-Object Collections.Generic.List[string]
    $report = ""
    foreach ($pfc in $pfcounters)
    {
        $b = ""
        $counter ="\\"+$cp+$pfc.get_InnerText().Trim()
        $p.Add($counter)

    }
    $count = Get-Counter $p
    for ($i = 0; $i -lt $count.CounterSamples.Count; $i++)
    {
        $v = $count.CounterSamples.Get($i).CookedValue
        $pfc = $pfcounters[$i]
        #$pfc.get_InnerText()
        $b = ""
        $lg = ""
        if($pfc.operator -eq "lt")
        {
            if ($v -ge [double]$pfc.alter)
                {$b = "alter"
                $lg = "Greater Than"}
        }
        elseif ($pfc.operator -eq "gt")
        {
            if( $v -le [double]$pfc.alter)
                {$b = "alter"
                $lg = "Less Than"}
        }
        if($b -eq "alter")
        {
            $path = "\\"+$cp+$pfc.get_InnerText()

            $item = "{0}:{1};{2} Threshold:{3}" -f $path,$v.ToString(),$lg,$pfc.alter.Trim()
            $report += $item + "`n"
        }

    }
    if($report -ne "")
    {
        #生产警告 参数 计数器,阀值,当前值
        CreateAlter $report
    }
}
其中涉及到2个配置文件:computernamexml,alter_cpuxml分别如下:
<computernames>
        <computername>
                wuxuelei-pc
        </computername>
</computernames>
<Counters>
        <Counter alter = "10" operator = "gt" >\Processor(_Total)\% Processor Time</Counter>
        <Counter alter = "10" operator = "gt" >\Processor(_Total)\% Privileged Time</Counter>
        <Counter alter = "10" operator = "gt" >\SQLServer:SQL Statistics\Batch Requests/sec</Counter>
        <Counter alter = "10" operator = "gt" >\SQLServer:SQL Statistics\SQL Compilations/sec</Counter>
        <Counter alter = "10" operator = "gt" >\SQLServer:SQL Statistics\SQL Re-Compilations/sec</Counter>
        <Counter alter = "10" operator=  "lt" >\System\Processor Queue Length</Counter>
        <Counter alter = "10" operator=  "lt" >\System\Context Switches/sec</Counter>
</Counters>
其中 alter 就是阀值,如第一条,如果 阀值 > 性能计数器值,就会发出警告。
其实这种自定义配置的方式,实现了灵活多变的自动化监控标准:
1、比如可以检测磁盘空间大小
2、检测运行峰值状态
3、定时的根据历史运行值,更改生产系统中的阀值大小,也就是所谓的运行基线
警告实现方式
1、SQL Agent配置Job方式实现
2、计划任务
以上两种配置方式,可以灵活掌握,操作还是蛮简单的,如果不会,可自行google。当然,如果不想干预正常的生产系统,可以添加一个Server专门用来自动化运维检测来用,实现远程监控。
后续文章中会分析关于Power Shell的远程调用,并且能实现事故当前状态下,自动化截图....自动Send Email......为DBA现场取证第一手材料...方便诊断问题...
效果图如下
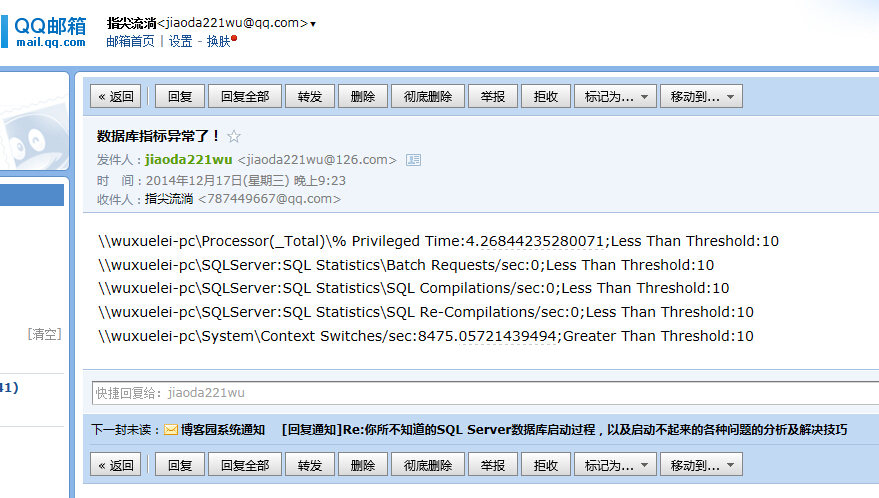
以上只提供实现方式,如需要内容更新,自己灵活更新。

 浙公网安备 33010602011771号