
Project2 Percolation in Grids 网格渗透

Project 2
Percolation in Grids
网格渗透
Introduction 介绍
Imagine a landscape filled with patches of dry grass. A fire has started at one end and it jumps from one patch to another. What is the probability that the fire manages to cross the entire area?
Imagine a system composed of randomly distributed insulating and metallic materials. What is the probability that the system is an electric conductor?
Imagine a porous landscape with water on the surface. What is the probability that the water will be able to drain to the bottom?
· 设想一片风景由干草地组成。火焰从一块干草区域开始并从一个区域跳到另一个区域。火焰能够通过整个区域的概率是多少?
· 设想系统由随机健在的绝缘金属材料组成。系统是电导体的概率是多少?
· 设想一个表面有水和多孔的场景。水能够流到底部的概率是多少?
All three problems can be modeled by a process called percolation. In its simplest form, percolation is modeled by an n×n grid containing blocked and open sites and the probability that a site is open is p. We say the grid percolates if there exists a sequence of open sites connecting an open site on the top row of the grid with an open site on the bottom row of the grid. The figure below shows two 2-dimensional grids generated with probability p=0.42. The left one percolates and the right one does not (light gray indicates a blocked site, blue/darkest shade indicates open sites that can be reached from the top row).
这三个问题都可以用一个称为渗透的过程进行模拟。最简单的方式是,渗透模型设置为n×n的网络,它包含了阻塞和开放点,并设一个点开放的概率为p。如果存在一个开放点序列连接了网格顶部与底部的开放点,我们称该网格是渗透的。下面的图展示概率p=0.42的2维网格。左边的网格渗透而右边的网格不能渗透(浅灰色表示一个阻塞点,而蓝色/最暗的阴影表示能够从顶部到达的开放点)。
 |  |
| Does percolate | Does not percolate |
The question scientists ask is “What is the smallest probability q at which a grid generated with probability q will percolate?”
科学家们想要知道的是“按概率q生成的网格能发生渗透,那么概率q的最小值是多少?”
Objectives 目的
The majority of percolation problems have no mathematical solution and thus percolation is a natural problem for computational experimentation. The objective of this project is to write two function implementing two conceptually different algorithms for flow through a 2-d grid and to experimentally determine the probability at which a grid percolates. You will also compare the running time of the two functions.
大多数渗透问题没有数学解决方法,因此渗透问题是计算实验的一个自然问题。这一项目的目的是编写两个函数,实现概念上不同的两个算法,这两个算法用来对一个2维网格进行渗透实验,并实验性判定网格渗透的概率。同时你会比较两个函数的运行时间。
The project uses a significant portion of the material covered already as described in the next section. You will (i) use nested lists to represent and manipulate 2-dimensional grids, (ii) write a recursive and a non-recursive function for exploring the grid to detect percolation, and (iii) experience the benefit of writing small and reusable modules and developing code incrementally.
这一项目使用了已覆盖的材料的重要部分,如下一部分所描述的那样。你将(i)使用嵌套列表来表示和操作2维网格(ii)体验编写小的并可重用的模块的好处,并递增地开发代码。
Getting Started 入门指南
You have already written a number of functions useful for this project. Note that you can use your solutions or the ones we provide (in file (percolation_provided.py)(解读该文件的传送门在此). You will be making use of the following:
你已经为该项目编写了一些有用的函数。注意,你可以用你的解决方案,或用我们提供的解决方案(在percolation_provided.py文件中)。你将用到下面的函数:
printgrid(grid): prints the grid represented by the nested list, one row per line (this module may be helpful in testing and debugging your code)
printgrid(grid):输出用嵌套列表表示的网络,每排代表一行(这一模型可能对测试和调试你的代码有帮助)
readgrid(filename): opens the file filename and returns the contents as a list of list (also helpful in testing and debugging your code)
readgrid(filename):按文件名打开文件,并返回内容的列表清单(对测试和调试代码有帮助)
grid(size,fill=0): returns a grid of dimensions size × size in which every grid location is initialized to fill. The default fill value is 0.
grid(size,fill=0):按size × size返回网格大小,其中每个格子的位置都被初始化填充。默认填充值为0.
visualize(flow_grid, input_grid): visualizes the flow through a grid using VPython
visualize(flow_grid, input_grid):使用Vpython可视化流体经过网格
The 2-dimensional grid will be represented as a list of lists with [0][0] representing the upper left-most position of the grid. Assume input_grid is the grid to be checked for percolation. A location represented in grid input_grid is set to 0 if the corresponding site is open, permitting flow, and it is set to 1 if the site is blocked. For a given probability p, the grid is generated by performing the following for each location [i][j], where i is the row and j is the column:
2维网格用一个列表的列表来表示,[0][0]表示网格最顶部最左边的格子。假设input_grid是将要测试渗透的网格。网格input_grid中表示的一个位置,在相应的点是开放时,设置为0,允许通过,如果点是阻塞的,则设置为1。给定一个概率p,网格根据每个位置[i][j]的下一个位置来产生,其中i表示行,j表示列。
Generate a uniformly distributed random number between 0 and 1.
产生一个均匀分布的0到1间的随机数。
If the random number is less than p, set input_grid[i][j] to 0, otherwise it is set to 1.
Function random_grid(size, p) written in Lab 6 generates such a grid (it is also included in the provided file).
如果随机数比p小,设置input_grid[i][j]为0,否则为1.
由Lab 6编写的函数random_grid(size,p) 产生了这样一个网格(包含了提供的文件)。
A grid percolates if there is a flow from a grid cell in the first row of the grid to a grid cell in the last row of the grid and all cells on the path created by the flow are either horizontally or vertically adjacent. For a grid cell at [i][j], the four adjacent cells are [i-1][j], [i+1][j], [i][j-1], [i][j+1], assuming they exist. Note that different definition of percolation exist in the literature, many motivated by specific applications.
如果从网格第一行的一个单元有一条路径能够到达网格最后一行的一个单元,那么网格是渗透的,而路径上的每个单元或者是水平相邻,或者垂直相邻。对于一个[i][j]单元来说,四个相邻单元是[i-1][j],[i+1][j],[i][j-1],[i][j+1],假设它们是存在的。注意,学术界,渗透有不同的定义,许多是由特殊应用产生的。
You will write two functions, percolation_wave(input_grid, trace=False) and percolation_recursive(input_grid, trace=False). Each function returns a grid flow_grid and a boolean does_percolate. If trace is True, you should call visualize(flow_grid, input_grid) each time the flow_grid changes.
你要编写percolation_wave(input_grid, trace=False) 和percolation_recursive(input_grid, trace=False) 两个函数。每个函数产生一个网格flow_grid和一个布尔数does_percolate。如果路径正确,你应该调用visualize(flow_grid, input_grid) 来观察flow_grid的每次变化。
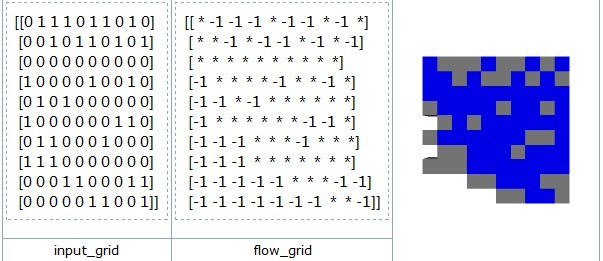
The percolation functions should not change grid input_grid; input_grid should always represent the initial grid generated with probability p. Use a second grid, grid flow_grid, to represent the flow. The values grid flow_grid contains will vary depending on the percolation function. For both, flow_grid[i][j] = -1 if no flow has yet reached location [i][j]. Hence, grid flow_grid is initialized to -1 and its final state will record locations that can be reached by a flow starting in the first row. The figure below shows a grid input_grid, the corresponding grid flow_grid (where flow is indicated by the symbol “*”) , and a visualization using three colors (blue/darkest shade represents the flow).
渗透函数不应该改变input_grid网格;input_grid应该保持按概率p产生时的原始状态。使用第二个网格flow_grid,用来表示流。flow_grid网格包含的值将根据渗透函数的不同而不同。对于这两种方式,如果没有流能够到达位置[i][j],则flow_grid[i][j] = -1。因此,网格flow_grid的值被初始化为-1,且它的最终状态记录了流从第一行能够到达的位置。下面的图展示了一个input_grid及相应的flow_grid(流用符号“*”表示),并用三种颜色对其进行了可视化(蓝色/阴影代表流)。
Wave Exploration of the Grid 水波探测网格
Function percolation_wave(input_grid, trace=False) detects percolation using the idea of expanding wavefronts. This process is illustrated in the figure below. The first wave consists of all the open positions in the top row of the grid. For the shown example, the first wave contains the three open grid locations labeled '0'. The second wave consists of all positions not in the first wave and that can be reached in one step from a position in the first wave. In general, the k-th wave is generated using the (k-1)-st wave and it contains positions not reached earlier. Waves are numbered starting from zero. Note that if a position appears in wave k, there is a path of length k to this position from a location in the top row. (Actually, the path contains k+1 grid locations.) Hence, the wave algorithm can be used to not only detect whether the grid percolates, but it also finds a shortest percolation path.
函数percolation_wave(input_grid, trace=False) 利用扩大波阵面的思想对渗透进行探测。下图说明了这一过程。第一个波包含了网格第一行的所有开放位置。根据展示的例子,第一个波包含了3个开放网格点,并用‘0’标记。第二个波包含了除第一个波以外的所有位置,并且可以由第一个波中一个位置一步到达。通常,第k个波是根据第k-1个波产生的,它包含了之前不能到达的位置。波从0开始,且是有限的。注意,如果一个位置在 波k中出现,则存在一条从第一行的一个位置开始长为k的路径。(事实上,该路径包含了k+1个网格位置。)因此,水波算法不仅可以用来探测网格渗透,而且还可以找到渗透的最短路径。

In your implementation, let function percolation_wave use the grid flow_grid to record the positions reached by the waves (its entries are initialized to -1) and use a list last_wave to record the last wave generated. Note that once a new wave has been determined, the positions reached by last_wave are recorded in the grid visualized. Use a function generate_nextwave to generate the next wave. The parameters of function generate_nextwave are
input_grid: input_grid[i][j] is 1 if position [i][j] is blocked.
flow_grid: flow_grid[i][j] is -1 if position [i][j] has not been visited by a wave; it contains the value k if the k-th wave reached it.
last_wave: a list of (row, col) pairs indicating the grid positions that were in the last wave.
在你的操作中,在percolation_wave函数中使用网格flow_grid来记录水波到达的位置(全部值初始化为-1),并用last_wave列表记录产生的上一个水波。注意,一旦新水波已经确定,上一个水波能够到达的位置将被记录到可视化的网格中。使用generate_nextwave函数产生下一个水波。generate_nextwave函数的参数是
input_grid:如果[i][j]位置阻塞,则input_grid[i][j]值为1。
flow_grid:如果[i][j]位置没有被水波访问到,则flow_grid[i][j]值为-1;如果第k个水波能够到达该位置,则它包含了值k。
last_wave:(行,列)对的列表,表示在上一个水波中的网格位置。
Function generate_nextwave returns the next wave that contains all positions that are adjacent to at least one position in last_wav are not blocked and have not been visited.
generate_nextwave函数返回下一个水波,它包含了了与last_wave中至少一个位置相邻的所有位置,且这些位置没有阻塞也未被访问。
The function terminates when an open position in the last row is reached by a wave (the grid percolates) or no more grid locations can be explored (the grid does not percolate).
当最后一行上有一个开放位置被一个水波到达(网格渗透)或没有其它网格位置能够找到(网格不能渗透),函数执行完毕。
Note: In your implementation, the lists representing waves should not contain duplicate entries. Allowing duplicate entries can result in very slow code (too slow for an effective experimental part).
注意:在你的操作中,表示水波的列表不需要包含所有的二重记录。全部的二重记录会导致代码运行速度很慢(对于有效实验来说太慢)。
Recursive Exploration of the Grid
网格的递归探测
The recursive exploration of a grid uses the following idea: a path through the grid is followed exploring new locations and following the most recently discovered location, as long as there still exists the possibility of detecting percolation. Once it is detected that the path pursued leads to a dead end, it backtracks and pursues the most recent branch it did not yet take. This is in some sense, this approach is the opposite of the wave exploration approach which works its way through the entire grid, wave by wave. Recursion will handle the concept of backtracking for you.
网格的递归探测运用了以下思想:一条通过网格的路径由新发现的位置和接下来最近发现的位置组成,只要探测渗透的概率依然存在。一旦发现被跟踪的路径进入死胡同,则回溯和到最近的一条没有探测过分支,并继续跟踪。从某种意义上来讲,这种方法与水波探测方法是相反的,水波探测是针对整个网格一波接一波进行的。递归将让你加深对回溯法概念的理解。
To implement percolation_recursive, use a function explore which has as parameters a row i and column j, as well as grids input_grid and flow_grid. Assume a cell adjacent to [i][j] can be reached by flow (or that i is the first row), input_grid[i][j]=0 and flow_grid[i][j]= -1. This means no flow has reached location [i][j], the location is not blocked, and flow from the adjacent location can reach it. We record that the flow reaches location [i][j] by setting flow_grid[i][j]=*. Then, function explore considers the neighbors of [i][j] it can flow to, one at a time. For each such neighbor, explore makes a recursive call with the position of the neighbor as the row and column index. Realize that after this recursive call is made, the initial conditions of explore stated above hold.
为执行percolation_recursive,使用一个explore函数来探测,它的参数为行i,列j及网格input_grid和flow_grid。假设一个单元与[i][j]相邻,流能够到达(i也可以为第一行),input_grid[i][j]=0,flow_grid[i][j]=-1。这意味着没有流到达过[i][j]位置,该位置不阻塞,且流能够从相邻的位置到达它。我们通过设置flow_grid[i][j]=*来记录流能够到达位置[i][j]。然后,函数explore考虑流能够到达的[i][j]的相邻位置,每个位置探测一次。对于每个这样的相信位置,explore将其相邻位置看作行列索引,并使用一次递归调用。在递归调用结束后,上面的explore的初始状态保持不变。
The recursive nature of function explore explores paths in the grid allowing flow until it reaches a “dead end” or until it reaches the last row. Once a flow reaches the last row, a flow resulting in percolation has been found and the computation stops. When a dead end is reached, no more recursive calls are made and the recursion returns to where it was called from (recursion handles the backtracking for you).
explore函数的递归特性探测网格中的路径,它允许流继续向前直至遇到“死胡同”或直到最后一行。一旦流到达了最后一行,流引起的渗透就找到了,计算终止。当一个死胡同出现,不再递归调用,并且递归返回它是从哪里开始调用的(递归为你保存的回溯路径)。
The initial call to function explore will be made by percolation_recursive and explore will make future recursive calls. Function percolation_recursive will make more calls to explore if there are free locations in the first row explore cannot reach. Function percolation_recursive will return the correct parameters when explore has completed its work.
对explore函数的初始调用是由percolation_recursive执行的而explore将进行进一步调用。如果第一行存在explore不能到达的空闲位置,函数percolation_recursive会更多的调用explore。当explore执行完毕,函数percolation_recursive将返回正确的参数。
General comments about the functions
函数的简单注释
When designing the percolation functions, consider how to reuse code and what code segments should be placed into a function. Test each function carefully and make sure to visualize the detected flow using function visualize provided. Here is an example of how the functions should be called in a possible testing function.
当设计渗透函数时,要考虑到如何重用代码及哪些代码段需要写入到函数中。仔细测试每个函数并确定能够使用提供的visualize函数将检测的流体可视化。
# a format you may want to use for testing
input_grid = random_grid(50, 0.5)
# Run percolation using wave algorithm
flow_grid, percolates_wave = percolation_wave(input_grid)
visualize(flow_grid, input_grid)
# Run percolation using recursive algorithm
flow_grid, percolates_rec = percolation_recursive(input_grid)
visualize(flow_grid, input_grid)
# the flow_grids generated may look different,
# but correct functions will produce the same Boolean value
Part 1: Using the Wave Percolation Function for Determining the Percolation Probability
第1部分:使用水波渗透函数测定渗透概率
Part 1 of the project consists of writing the function percolation_wave and running experiments to computationally determine the smallest probability q at which a grid generated with probability q percolates. We call this the percolation probability q.
项目第一部分包含了percolation_wave函数的编写及进行实验,计算出一个按概率q产生的网格发生渗透的最小概率q。我们称其为渗透率q。
First write and test function percolation_wave. To computationally determine the percolation probability, use the following setup. One trial consist of determining whether one grid percolates. Consider the following questions:
首先编写并测试函数percolation_wave。为计算得出渗透率,按下面的设置进行。一个实验需要完成确定一个格子是否渗透。考虑下面几个问题:
How many trials are needed to make a prediction on whether a grid generated with probability p percolates?
How many different values of p should be considered to determine the percolation probability q?
需要做多少次实验才能确定一个按概率p产生的网格是否渗透?
需要考虑多少个不同的p值才能确定渗透概率q?
For p=1, the grid will always percolate (there are no blocked locations) and for p=0 the grid will never percolate (all locations are blocked). Intuitively, for values of p close to 1, one expects that the majority of the trials will report percolation and for values of p close to 0 one expects very few percolations.
如果p=1,网络总是渗透(没有阻塞位置),如果p=0,网格不能渗透(所有位置都是阻塞的)。直观来讲,接近1的p值,我们会认为大多数的实验结果是渗透的,而接近0的p值,极少是渗透的。
The goal is to generate a plot whose x-coordinate represents values of p (from 0 to 1) and whose y-coordinate represents q (also from 0 to 1). From the shape of the plot, you will make a prediction of the percolation probability.
目的是产生一个图,它的x座标表示p的值(从0到1),y座标表示q(也是从0到1)。从图的形状来看,你会对渗透作出一个预测。
Every point in the plot is obtained by running a number of trials. For a certain probability p, assume we are making t trials and s of the t randomly generated grids allow percolation. We set q = s/t and (p,q) is a point in the plot. It would be helpful if there were a formula allowing us to plot this function. However, such a formula does not exist.
图中的每个点是根据多次实验得出的。对于某一概率p,假设我们进行t次实验,t个随机产生的网格有s个允许渗透。我们设q=s/t,(p,q)是图中的一个点。如果存在一个准则允许我们图出这个函数,这对我们将很有帮助。然而,这样的准则并不存在。
Experimentally determine the percolation probability for a grid of size n=25. Remember that you need to decide how many values of p to consider and how many experiments to run for each value of p (you should set this quantity t to at leats 10). Plot the graph using Matplotlib or VPython. Place all code generating the plot into a file experiment_n_fixed.py (this file needs to import all files and libraries you use). In addition to the graph, discuss how you decided on the number of trials used and the probabilities p considered. State the observed percolation probability.
实验确定一个n=25的网格的渗透率。记住,你需要决定考虑p值的大小及对于每个p值,实验运行的次数(你应该设置t的大小至少为10)。使用Matplotlib或Vpython画图。把产生图的所有代码放到experiment_n_fixed.py文件(这一文件需要调用你需要用到的所有文件和库)下。除图之外,讨论一下你是怎样确定实验次数和考虑的概率p。说明观察到的渗透率。
Next, consider grid sizes n = 10, 25, 50, and 75 and determine the percolation probabilities (you already know it for n=25). One way to visualize the performance for the different values of n is to make the same curve as above and show all three in one plot. Discuss how the size of the grid seems to impact the percolation probability and the shape of the curves. Place all code generating the curves into file experiment_n_varies.py.
下一步,分别对n=10,25,50,75的网格进行实验,并确定其渗透率(n=25的已经得出)。可视化不同n值的结果的方法之一是同上面所述的一样,画出同样的曲线,并把三条曲线画在同一幅图中。讨论网格的大小是如何影响渗透率的,以及曲线的形状。把产生曲线的所有代码放在experiment_n_varies.py文件中。
Submit a folder containing percolation_wave.py, experiment_n_fixed.py, experiment_n_varies.py, percolation_provided.py, and a text file discussing your results.
上交一个文件夹,其中包含了percolation_wave.py、experiment_n_fixed.py、experiment_n_varies.py、percolation_provided.py和一个讨论实验结果的文本文件。
Part 2: Comparing the Performance of two Percolation Functions
第2部分:比较两个渗透函数的性能
Part 2 of the project consists of writing function percolation_recursive and comparing the running times of the two percolation functions. Before starting to write percolation_recursive, read the description given earlier carefully. Realize that the recursion happens in function explore and that percolation_recursive makes the initial call to explore (it may make more than one call to explore).
第二部分的任务是编写percolation_recursive函数,用其比较两个渗透函数的运行时间。在写percolation_recursive之前,请认真阅读前面给出的描述。实现explore函数中递归,及percolation_recursive对explore的初始调用(可能不止一次调用explore)。
Use the following framework to compare the running times of one execution of the two functions.
n = ...
p = ...
input_grid = random_grid(n, p):
t = time.clock()
flow_grid, percolates_wave = percolation_wave(input_grid, trace=False)
time_wave = time.clock()-t
t = time.clock()
flow_grid, percolates_wave = percolation_recursive(input_grid, trace=False).
time_recur = time.clock()-t
Make sure both functions are operating the same way (both terminate when percolation is first detected, or both detect all percolation paths). Your comparison should report performance on the following scenario:
· set n=75
· consider values of p from 0 to 1 in increments of 0.05 (or smaller)
· for each value of p, generate 10 random grids and record for each algorithm the average running time on the ten grids
This experimental setup produces two lists (or arrays), each containing 20 values (or more for smaller increments). Plot the performance results in an interesting and effectve way and give a brief discussion of your interpretation.
Note:
· We encourage you to use your wave propagation function in the performance comparison. If your code did not work correctly or some other problems arise, you can use the posted wave solution.
· While real applications have significantly larger grid sizes, generating the plot for n=75 may exceed default values Python uses. To increase the setrecursionlimit from the default value use:
setrecursionlimit(30000)
Place the recursive function detecting percolation into file my_percolation_recursive.py. Your performance comparisons should be in a file named my_performace_results.py. Your submission for Part 2 needs to contain these two programs, the wave propagation function, the provided functions file, and a discussion of your performance results. Can you make a conclusion on which approach is more efficient?
Reminder
提示
When you submit your code, always submit all files used by your solutions. This means that if you are using code we provide to the class, you need to submit this code whether you changed it or not. Your project will be run and tested only with the code submitted. Instruction on files names are given above. We will grade both the quality of your code as well as the quality of your experimental study, including the associated write-up answering the given questions.

 浙公网安备 33010602011771号