
echarts在.Net中使用实例(一) 简单的Demo
前言
这个必须要有前言,即便很短,对于有强迫症的人来说不容易啊。言归正传,之前做图一直使用rdlc自带的格式,虽然任务完成,但是一直觉得不太美观,
空余时间开始找其他的插件,终于找到了Highchart和echarts,这一系列主要是针对echarts.
关于Echarts
百度比我更清楚,我就不说了!
echarts的实例参考地址:http://echarts.baidu.com/doc/example.html
echarts的文档参考地址:http://echarts.baidu.com/doc/doc.html
echarts(版本2.2.7)下载地址:http://echarts.baidu.com/build/echarts-2.2.7.zip
实例
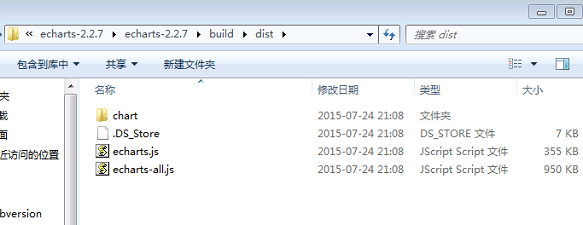
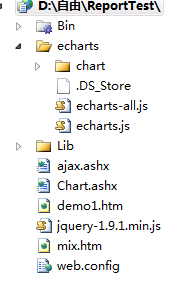
在项目中新建echarts文件夹,并将下载的echarts-2.2.7.zip解压,将build下的dist文件夹中所有的文件拷贝到echarts文件夹中,如下图
根据文档只需要几分钟的功夫,代码如下:


<!DOCTYPE html>
<html>
    <head>
    <meta charset="utf-8" />
    <script type="text/javascript" src="jquery-1.9.1.min.js"></script>
    </head>
    <body>
        <div id="main" style=" height:400px;"></div>
           <script type="text/javascript" src="echarts/echarts.js"></script>
    <script type="text/javascript">
        // 路径配置
        require.config({
            paths: {
                echarts: 'echarts' //echarts路径
            }
        });
        // 使用
        require(
            [
                'echarts', //echarts路径
                'echarts/chart/bar', // 使用柱状图就加载bar模块,按需加载
                 'echarts/chart/line' // 使用柱状图就加载bar模块,按需加载
            ],

            function (ec) {
                // 基于准备好的dom,初始化echarts图表
                var myChart = ec.init(document.getElementById('main'));

                option = {
                    tooltip: {
                        trigger: 'axis'
                    },

                    //右侧工具栏
                   /* toolbox: {
                        show: true,
                        feature: {
                            mark: { show: true },
                            dataView: { show: true, readOnly: false },
                            magicType: { show: true, type: ['line', 'bar'] },
                            restore: { show: true },
                            saveAsImage: { show: true }
                        }
                    },
                    calculable: true,*/
                    legend: {
                        data: ['蒸发量', '降水量', '平均温度']
                    },
                    //横轴信息
                    xAxis: [
                        {
                            type: 'category',
                            data: ['1月', '2月', '3月', '4月', '5月', '6月', '7月', '8月', '9月', '10月', '11月', '12月']
                        }
                    ],
                    //纵轴信息
                    yAxis: [
                            {
                                type: 'value',
                                name: '水量',
                                axisLabel: {
                                    formatter: '{value} ml'
                                }
                            },
                            {
                                type: 'value',
                                name: '温度',
                                axisLabel: {
                                    formatter: '{value} °C'
                                }
                            }
                    ],
                  //数据系列
                    series: [

                                {
                                    name: '蒸发量',
                                    type: 'bar',
                                    data: [2.0, 4.9, 7.0, 23.2, 25.6, 76.7, 135.6, 162.2, 32.6, 20.0, 6.4, 3.3]
                                },
                                {
                                    name: '降水量',
                                    type: 'line',
                                    data: [2.6, 5.9, 9.0, 26.4, 28.7, 70.7, 175.6, 182.2, 48.7, 18.8, 6.0, 2.3]
                                },
                                {
                                    name: '平均温度',
                                    type: 'line',
                                    yAxisIndex: 1,
                                    data: [2.0, 2.2, 3.3, 4.5, 6.3, 10.2, 20.3, 23.4, 23.0, 16.5, 12.0, 6.2]
                                }
                             ]
                };


                // 为echarts对象加载数据
                myChart.setOption(option);
            }
        );
    </script>
    </body>
</html>
效果如下图,效果是不是很棒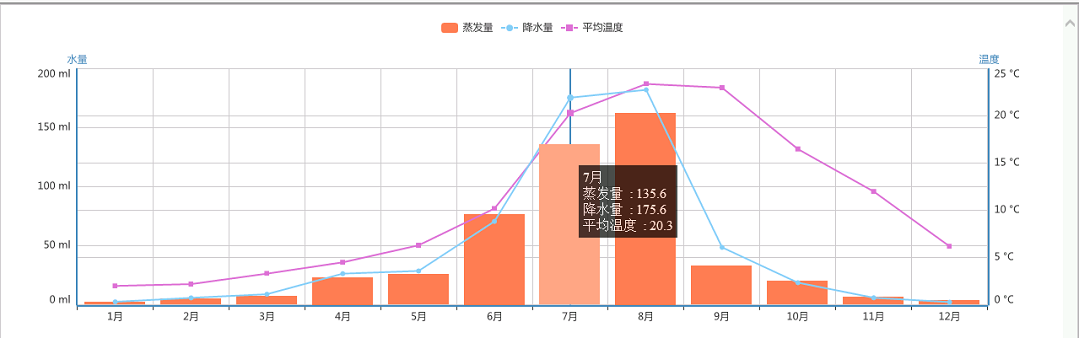
使用ajax动态加载数据,请看下回分解。

 浙公网安备 33010602011771号