


iPhone开发过程中调试多次Release问题 message sent to deallocated
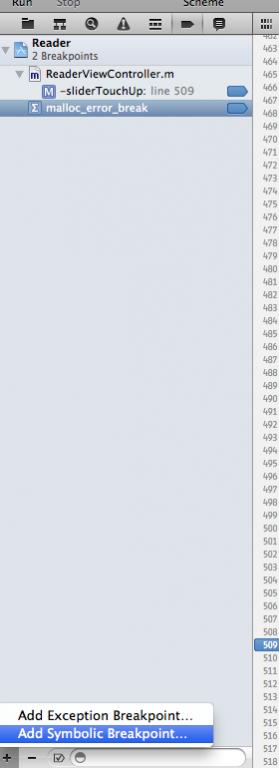
初级:第一步 为程序添加符号断点 malloc_error_break 方法如下。
目标效果:让程序崩溃时跳转到出错到那一行。但是往往达不到这个效果。不行就继续往下看。
At times, while running through your app, you might come across this warning on console:
MyApp(2121,0xb0185000) malloc: *** error for object 0x1068310: double free
*** set a breakpoint in malloc_error_break to debug
Even though you might feel that its not affecting your app, but its still annoying, and might cause some memory related issues as well.
So before going ahead, what is the compiler actually trying to tell you?
Well, its pretty simple, it is trying to tell you that the object at the memory location 0×1068310 is being freed twice, and it is trying to help you by saying that you may set a breakpoint in malloc_error_break to find more about this object.
There may be several reasons for something like this to happen, the foremost reason that I have found is programmers trying to free something that is already in the auto-release pool.
So how to fix this up?
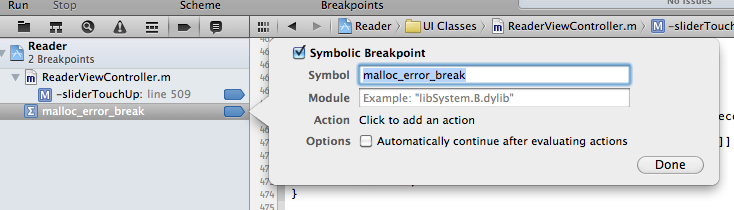
It’s fairly simple, You need to set a “symbolic breakpoint” on malloc_error_break .
Go to Run > Breakpoints > Add Symbolic Breakpoint. Then paste malloc_error_break into the window.
Here are some screenshots to describe the process:

After that activate the breakpoints and simply run. and the app’s execution will stop at the point where it sees you freeing the variable the second time.
参考:http://blog.csdn.net/devday/article/details/6460929
中级:使用 malloc_history 14003 0xb47fc50 在终端中查看
步骤1:设置参数
做如下设置:
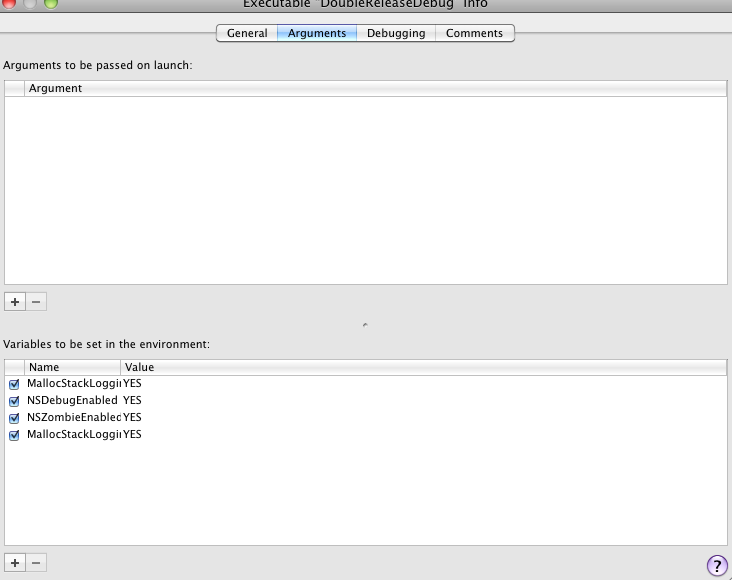
Project -> Edit active executable ->Argument
添加如下四个参数
NSDebugEnabled
NSZombieEnabled
MallocStackLogging
MallocStackLoggingNoCompact
并都设置为YES。具体如下图:
这个时候,如果有如下一段代码:
//重复释放一个变量
NSAutoreleasePool* pool = [[NSAutoreleasePool alloc] init];
NSData* data = [NSData dataWithBytes:"asklaskdxjgr" length:12];
[data release];
[pool release];
再Debug窗口会有如下的提示
2003-03-18 13:01:38.644 autoreleasebug[3939] *** *** Selector 'release'
虽然也能大致判断是哪种类型的变量重复释放了,但信息还不够多,当项目大,源码比较多的时候,也不太方便定位,
在console窗口运行如下命令可以得到更多信息:shell malloc_history <pid> <address>
第二步:在终端(terminal中)输入命令:malloc_history 3939 0xa4e10
就会出现更多的信息:
[dave@host193 Frameworks]$ malloc_history 3939 0xa4e10
Call [2] [arg=32]: thread_a0000dec |0x1000 | start | _start | main |
+[NSData dataWithBytes:length:] | NSAllocateObject | object_getIndexedIvars |
malloc_zone_calloc
这个时候就知道具体哪个函数出先问题了,从这里可以看到main里NSData出现问题了。
参考:iphone 内存管理的一些总结 很棒!
我的经验:
1、在终端中输入命令时,要保持xcode开启,且程序正卡在端点处。
2、我用到命令是 malloc_history <pid> <address> ,返回的结果是:
ALLOC 0xb47fc50-0xb47fc6f [size=32]: thread_416c1a8 |start | main | UIApplicationMain | -[UIApplication _run] | CFRunLoopRunInMode | CFRunLoopRunSpecific | __CFRunLoopRun | __CFRunLoopDoSource1 | __CFRUNLOOP_IS_CALLING_OUT_TO_A_SOURCE1_PERFORM_FUNCTION__ | PurpleEventCallback | _PurpleEventCallback | _UIApplicationHandleEvent | -[UIApplication sendEvent:] | -[UIApplication handleEvent:withNewEvent:] | -[UIApplication _runWithURL:payload:launchOrientation:statusBarStyle:statusBarHidden:] | -[UIApplication _reportAppLaunchFinished] | +[CATransaction flush] | CA::Transaction::commit() | CA::Context::commit_transaction(CA::Transaction*) | CA::Layer::layout_and_display_if_needed(CA::Transaction*) | CA::Layer::layout_if_needed(CA::Transaction*) | -[CALayer layoutSublayers] | -[NSObject performSelector:withObject:] | -[UIView(CALayerDelegate) layoutSublayersOfLayer:] | -[UILayoutContainerView layoutSubviews] | -[UINavigationController __viewWillLayoutSubviews] | -[UINavigationController _startDeferredTransitionIfNeeded:] | -[UINavigationController _startTransition:fromViewController:toViewController:] | -[UINavigationController _updateScrollViewFromViewController:toViewController:] | -[UINavigationController _layoutViewController:] | -[UIViewController loadViewIfRequired] | -[SQHomePageViewController viewDidLoad] | -[SQHomePageViewController requestRecommendList] | -[RecommendList requestRecommendList] | -[SQHomePageAction requestHomePage] | -[SQBaseAction requestUrl:] | -[ASIHTTPRequest startSynchronous] | -[NSRunLoop(NSRunLoop) runMode:beforeDate:] | CFRunLoopRunInMode | CFRunLoopRunSpecific | __CFRunLoopRun | __CFRunLoopDoSources0 | __CFRUNLOOP_IS_CALLING_OUT_TO_A_SOURCE0_PERFORM_FUNCTION__ | _cfstream_shared_signalEventSync | _signalEventSync | ReadStreamClientCallBack | -[ASIHTTPRequest handleNetworkEvent:] | -[ASIHTTPRequest handleStreamComplete] | -[ASIHTTPRequest requestFinished] | -[NSObject(NSThreadPerformAdditions) performSelectorOnMainThread:withObject:waitUntilDone:] | -[NSObject(NSThreadPerformAdditions) performSelector:onThread:withObject:waitUntilDone:modes:] | -[ASIHTTPRequest reportFinished] | __27-[SQBaseAction requestUrl:]_block_invoke | -[SQBaseAction onSuccess:] | -[SQBaseAction validResponse:] | -[SQBaseAction parserJsonWithString:] | -[NSDictionary initWithDictionary:] | -[NSDictionary initWithDictionary:copyItems:] | -[__NSPlaceholderDictionary initWithObjects:forKeys:count:] | +[__NSDictionaryI __new:::::] | __CFAllocateObject2 | class_createInstance | calloc | malloc_zone_calloc
问题定位在红色函数中。
上面这段代码应该是完整地描述了,程序执行的全部过程。包括每一个类和每一个方法。非常有意思。
实际出错代码:
//将json 格式的原始数据转解析成数据字典
-(NSDictionary *)parserJsonWithString:(NSString *)str
{
    NSString *strJson = [self removeEscapeCodeFromString:str];
    SBJsonParser *sbJsonParser = [[[SBJsonParser alloc]init]autorelease];
    NSDictionary *tempDictionary = [[NSDictionary alloc]initWithDictionary:[sbJsonParser objectWithString:strJson]];
    return [tempDictionary autorelease]; //不必release或autorelease将自动释放
}
参考: message sent to deallocated instance 讲解的很详细,值得参考
其它信息:
message sent to deallocated instance问题的解决方法(gdb和lldb)
当出现message sent to deallocated instance的时候,一般伴随牛逼的BAD_ACCESS.是的,是某个对象release了两次。可是那么多的疑似对象,到底是哪一个?

使用xcode环境变量(添加方法请自行google)MallocStackLoggingNoCompact,NSZombieEnabled,MallocStackLogging这三个,值都设置成YES.寻求更详细的错误信息。

message sent to deallocated instance后会有一个内存地址,如:0×6497860,我们需要查看该地址的malloc history.查看方法,在原来的gdb下,使用”info malloc_history 0×6497860“即可显示malloc记录。但是新版的Xcode 不再支持,怎么办呢?秀逗麻袋,我们还有terminal,使用终端的malloc_history命令,如”malloc_history 32009 0×6497860“即可显示。其中的32009是该进程的pid,根据这个malloc记录,可以大致定位出错信息的代码位置。

(插一句,gdb或者lldb进行debug的向导:http://lldb.llvm.org/lldb-gdb.html)

其实,如果代码编写足够高效和有序的话,是不会出现这种烦人的问题的。还是代码重构问题。代码洁癖伤不起啊。
你好,请问pid具体是哪个进程的,通过活动监视器查看么?_是的,activity monitor


 浙公网安备 33010602011771号