MySQL- 5.7 sys schema笔记
performance_schema提供监控策略及大量监控项,包括:元数据锁、进度跟踪、事务、内存使用及存储程序等。但是,performance_schema又过于复杂,操作不便,所以5.7新增了 sys schema,基础数据来自于 performance 跟 information_shcema两个库,本身数据库不存储及集采数据。
1 视图分类
- 主机相关
- innodb相关
- IO相关
- 内存相关
- 连接与会话相关
- 表相关
- 索引相关
- 语句相关
- 用户相关
- 等待信息
2 日常应用
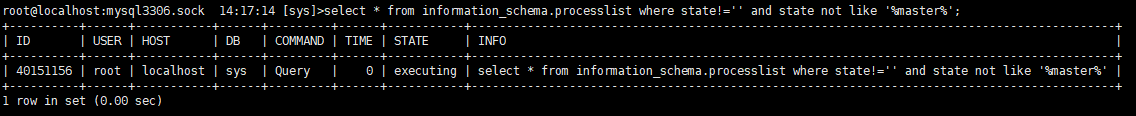
2.1 查看process
常用的有以下3个查询:
show processlist;
show full processlist;
select * from information_schema.processlist;
其中,show processlist为简要查看当前连接数据库情况,包含SQL语句的statement列仅提供部分SQL,而show full processlist则提供完整的SQL 语句,information_schema.processlist的内容与show full processlist 内容一致,但是可以以表格查询的形式添加where条件,达到自己的使用需求。
除此之外,sys提供以下四个视图查看 连接情况,这四个则更为详细的提供了 行数情况、临时表情况、当前SQL以及最后提交SQL(即使是sleep状态,这里也有最后提交的SQL可以查看)等信息。
select * from sys.processlist;
select * from sys.session;
select * from sys.x$processlist;
select * from sys.x$session;
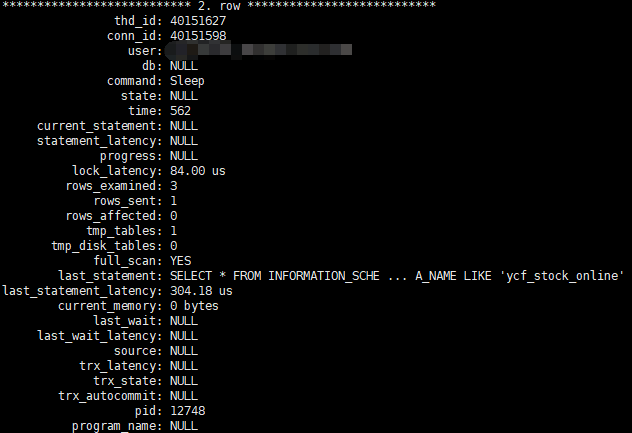
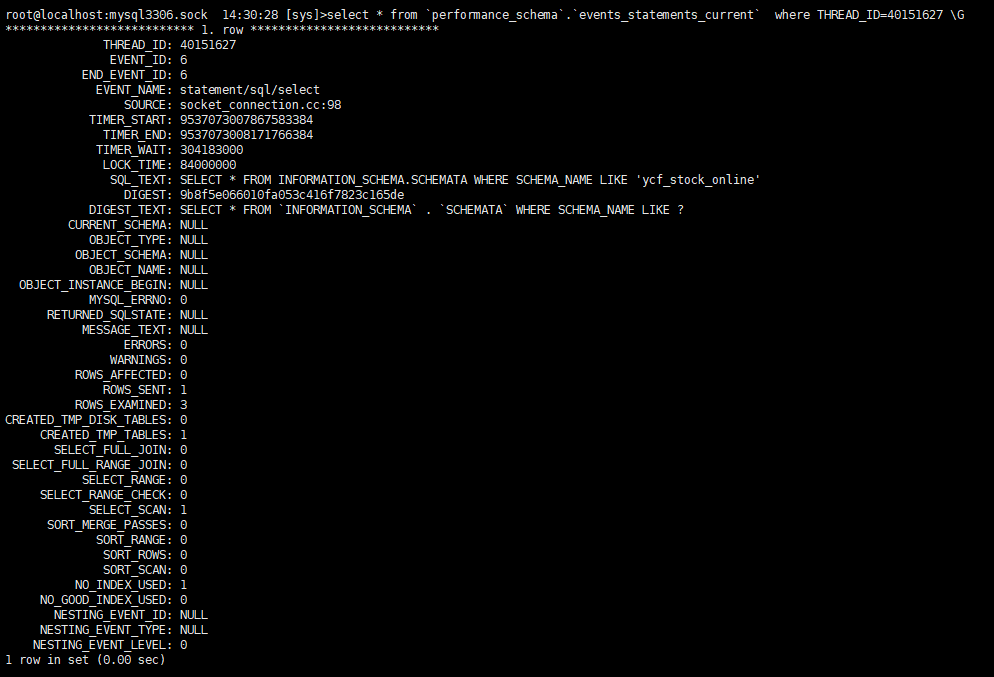
由于 SQL内容提供为摘要部分,若想详细查看,可以通过 `performance_schema`.`events_statements_current` 表格查看,通过sys.processlist 的thd_id关联查看。
2.2 查看表访问量
 select table_schema,table_name,sum(io_read_requests+io_write_requests) io from schema_table_statistics group by table_schema,table_name order by io desc limit 10;
+--------------+----------------------------------+------+
| table_schema | table_name                       | io   |
+--------------+----------------------------------+------+
| ycf_sqlpub   | django_session                   | 2194 |
| dba_sqlpub   | django_session                   |  735 |
| ycf_sqlpub   | sqlversion_registersql           |  347 |
| ycf_sqlpub   | xadmin_log                       |  331 |
| ycf_sqlpub   | sqlversion_registersqllog_sqls   |  329 |
| ycf_sqlpub   | sqlversion_sqlpublishlog_version |  311 |
| ycf_sqlpub   | sqlversion_sqlpublishlog         |  308 |
| ycf_sqlpub   | sqlversion_registersqllog        |  299 |
| ycf_sqlpub   | auth_group_permissions           |  298 |
| ycf_sqlpub   | testenv_testalldb                |  295 |
+--------------+----------------------------------+------+
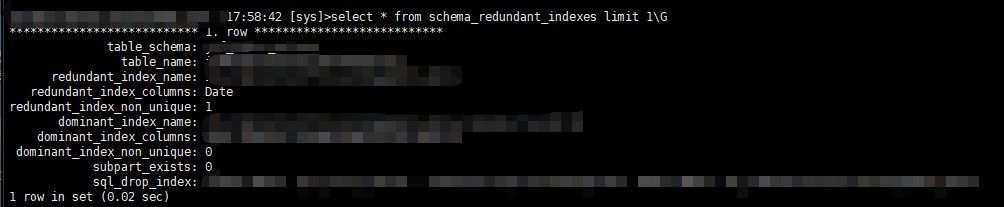
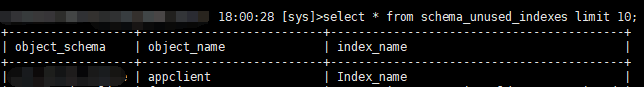
2.3 冗余索引与未使用索引
# 冗余索引查看
select table_schema,table_name,redundant_index_name,redundant_index_columns,dominant_index_name,dominant_index_columns from sys.schema_redundant_indexes;

# 未使用索引查看
select * from schema_unused_indexes;
2.4 表自增ID监控
select * from schema_auto_increment_columns \G
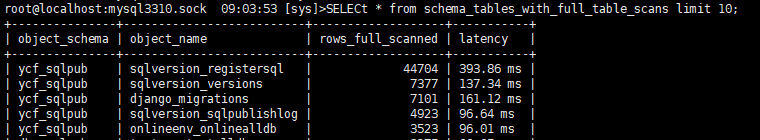
2.5 监控全表扫描的sql语句
select * from sys.statements_with_full_table_scans where db = 'test';
2.6 查看实际消耗磁盘IO的文件
select file,avg_read+avg_write as avg_io from io_global_by_file_by_bytes order by avg_io desc limit 10;
3 视图一览表
3.1 触发器
- sys_config
- 系统变量表格
- 笔记链接:sys_config
- 关注点:statement_truncate_len
- 影响函数format_statement()截断SQL后的长度,即最后SQL语句显示的总长度,像 sys.processlist 中的 last_statement 的显示长度,就是受到这个函数的约束。可以动态修改会话级别的显示长度,默认为64。
- sys_config_insert_set_user
- sys_config表格发生INSERT操作,则会触发该触发器更新sys_config的set_by列
- show triggers; 查看源码
- sys_config_update_set_user
- sys_config表格发生UPDATE操作,则会触发该触发器更新sys_config的set_by列
- show triggers; 查看源码
3.2 视图
日常会用到sys库,主要也是使用 视图进行查询,但是目前视图已经非常多了,分为 带x$跟不带这个前缀的视图,这两种没啥实质性区别,不带 x$ 的视图是人性化的结果展示,会有一些单位换算,就是像是 linux 指令中的 -h 选项,而带想x$前缀的,则是原始数据单位,未经换算。
视图那么那么多,实际上常用的不多,会加红色字体显示,其他视图做简单介绍。
3.2.1 主机相关
- host_summary开头的视图
- 提供IO延迟等相关信息
- 大致视图如下(红色为常用)
- The host_summary and x$host_summary Views
- The host_summary_by_file_io and x$host_summary_by_file_io Views
- The host_summary_by_file_io_type and x$host_summary_by_file_io_type Views
- The host_summary_by_stages and x$host_summary_by_stages Views
- The host_summary_by_statement_latency and x$host_summary_by_statement_latency Views
- The host_summary_by_statement_type and x$host_summary_by_statement_type Views
- 简要介绍:
- 日常中主要适用的是host_summary视图,可以根据连接数据库的host总的执行sql数目、执行时长、表扫描、文件IO、连接情况、用户情况及内存分布情况,可以让DBA快速定位到是哪台host最耗费数据库资源,对连接数据库的所有host有一个大致的资源使用情况的了解。

- 如果想详细查看每个host的主要是在什么文件类型上耗费IO资源,可以查看 host_summary_by_file_io_type视图
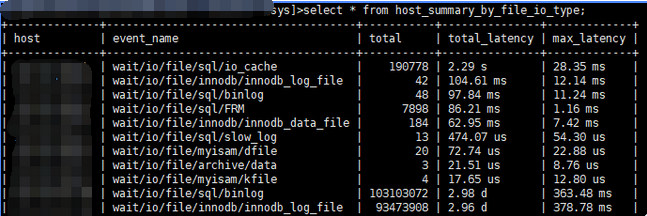
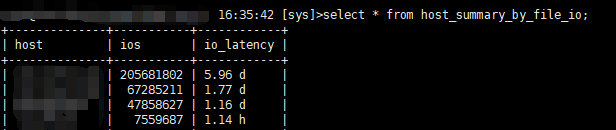
- 如果仅查看每台host总的IO情况,则可以查看视图host_summary_by_file_io
3.2.2 innodb相关
- innodb开头的视图
- 汇总了innodb buffer page信息和事务等待innodb锁信息
- 大致视图如下(红色为常用,但实际上最好少用慎用)
- The innodb_buffer_stats_by_schema and x$innodb_buffer_stats_by_schema Views
- The innodb_buffer_stats_by_table and x$innodb_buffer_stats_by_table Views
- The innodb_lock_waits and x$innodb_lock_waits Views
- 简要介绍
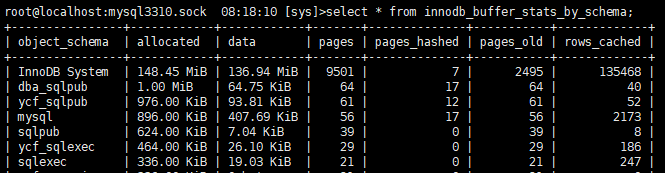
- 当一个实例中有多个业务库,由于性能问题,可能想查看下各个数据库的内存占用情况,可以使用视图 innodb_buffer_stats_by_schema,但是少用慎用,因为会扫描整个buffer pool来统计,如果所在实例buffer pool非常大,那么这是一个极为耗费资源的查询,没啥事就不要用哈!这个视图实际上是通过 视图 innodb_buffer_stats_by_table的数据做了group by object_schema得到的。
- (截图未测试环境,所以使用到的内存很少)
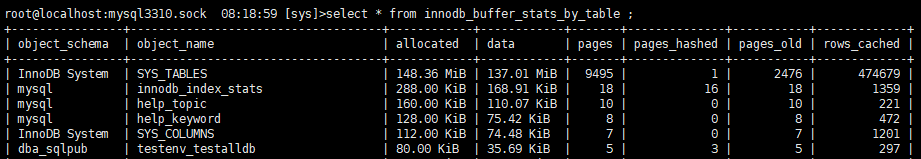
- 在某种情况下,需要查询表格在内存中的占用情况,可以通过视图 innodb_buffer_stats_by_table来查询,也是扫描整个buffer pool统计,少用慎用。
3.2.3 IO相关
- io开头的视图
- 等待IO情况/IO使用情况
- 大致视图如下(红色为常用)
- The io_by_thread_by_latency and x$io_by_thread_by_latency Views
- 各个IO线程的使用情况
- The io_global_by_file_by_bytes and x$io_global_by_file_by_bytes Views
- 各个数据库文件的IO情况
- The io_global_by_file_by_latency and x$io_global_by_file_by_latency Views
- 各个数据库文件的IO耗时情况
- The io_global_by_wait_by_bytes and x$io_global_by_wait_by_bytes Views
- 数据库事件IO等待情况
- The io_global_by_wait_by_latency and x$io_global_by_wait_by_latency Views
- 数据库事件IO等待耗时情况
- The latest_file_io and x$latest_file_io Views
- 当前正在读写文件的情况
- 简要介绍
- 查看数据库实例的IO分布情况,及着重优化对象,可以使用 io_global_by_file_by_bytes
3.2.4 内存相关
- memory开头的视图
- 从主机/线程/用户等角度展示内存的使用情况
- The memory_by_host_by_current_bytes and x$memory_by_host_by_current_bytes Views
- The memory_by_thread_by_current_bytes and x$memory_by_thread_by_current_bytes Views
- The memory_by_user_by_current_bytes and x$memory_by_user_by_current_bytes Views
- The memory_global_by_current_bytes and x$memory_global_by_current_bytes Views
- The memory_global_total and x$memory_global_total Views
- 简要介绍
- 当前内存使用情况,从 host、thread、user等角度来分别查看,对应各自的视图即可。
3.2.5 连接与会话相关
- 含有processlist和session的视图
- 会话相关的信息
- 大致视图如下(红色为常用)
- The processlist and x$processlist Views
- The session and x$session Views
- The session_ssl_status View
- 简要介绍
- 查看连接使用情况,session的结果跟processlist类似。查看连接情况,有非常多种方式,每种方式都有各自的使用情况,详情可以查看上文说明。
3.2.6 表相关
- schema_table开头的视图
- 从全表扫描/innodb缓冲池表现表统计信息
- 大致视图如下(红色为常用)
- The schema_table_lock_waits and x$schema_table_lock_waits Views
- The schema_table_statistics and x$schema_table_statistics Views
- The schema_table_statistics_with_buffer and x$schema_table_statistics_with_buffer Views
- The schema_tables_with_full_table_scans and x$schema_tables_with_full_table_scans Views
- The schema_auto_increment_columns View
- 简要介绍
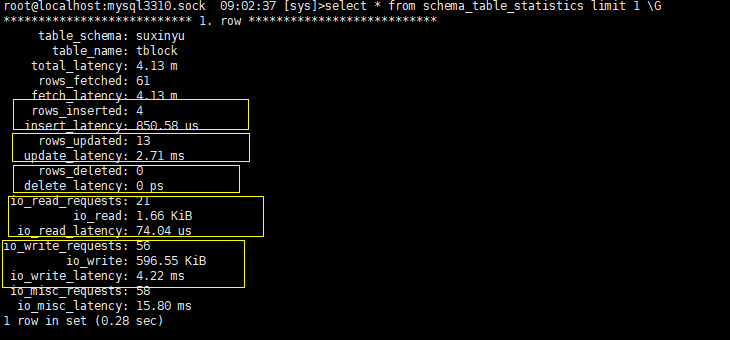
- 查看表格的update、delete、insert、select的IO情况,可以使用schema_table_statistics视图
- 查看表格的全表扫描情况,抓取需要重点优化的对象,可以使用视图schema_tables_with_full_table_scans
- 查看表格的自增长是否快达到瓶颈了,有些表格存在频繁的删除操作,可能导致自增ID的最大值跟表格数量极不相符合,为了避免问题,可以通过视图 schema_auto_increment_columns,查看有哪些表格快要达到自增的瓶颈值

3.2.7 索引相关
- 含有index的视图
- 大致视图如下(红色为常用,一不小心都加红了)
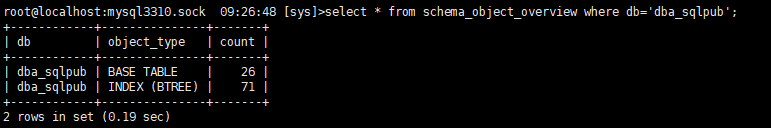
- The schema_object_overview View
- The schema_redundant_indexes and x$schema_flattened_keys Views
- The schema_unused_indexes View
- The schema_index_statistics and x$schema_index_statistics Views
- 简要介绍
- 查看当前实例内各个数据的对象及索引分布情况,可以使用 schema_object_overview
- 查看数据库的冗余索引情况,可以通过视图 schema_redundant_indexes,但是请记住,不是所有冗余索引都要删除,请衡量实际的使用情况、索引大小、索引扫描情况后再决定。
- 查看数据库没有使用的索引,可以使用 schema_unused_indexes
- 查看索引的select \update\delete\insert情况,可以使用schema_index_statistics

3.2.8 语句相关
- statement开头的视图
- 错误数、警告数、执行全表扫描、使用临时表、执行排序等信息
- 大致视图如下(红色为常用,功能蛮强大,就是实际还蛮少用到的)
- The statement_analysis and x$statement_analysis Views
- The statements_with_errors_or_warnings and x$statements_with_errors_or_warnings Views
- The statements_with_full_table_scans and x$statements_with_full_table_scans Views
- The statements_with_runtimes_in_95th_percentile and x$statements_with_runtimes_in_95th_percentile Views
- The statements_with_sorting and x$statements_with_sorting Views
- The statements_with_temp_tables and x$statements_with_temp_tables Views
- 简要描述
- 汇总SQL中错误数、警告数、执行全表扫描、使用临时表、执行排序等信息,sql语句也是使用 format_statement() 函数做了长度限制,如果想查看完整的SQL,可以通过 这个表格的这一列查看performance_schema`.`events_statements_summary_by_digest`.`DIGEST_TEXT`,关联的添加列是 DIGEST
3.2.9 用户相关
- user开头的视图
- 用户使用的文件IO/执行语句的统计信息
- 大致视图如下(红色为常用)
- The user_summary and x$user_summary Views
- The user_summary_by_file_io and x$user_summary_by_file_io Views
- The user_summary_by_file_io_type and x$user_summary_by_file_io_type Views
- The user_summary_by_stages and x$user_summary_by_stages Views
- The user_summary_by_statement_latency and x$user_summary_by_statement_latency Views
- The user_summary_by_statement_type and x$user_summary_by_statement_type Views
- 简要介绍
- 从用户的角度,分别统计文件的IO情况、sql执行情况,如果数据库的用户是按照业务模块来划分的,那么则可以清晰的看到哪些业务耗费资源较多
3.2.10 等待信息
- wait开头的视图
- The wait_classes_global_by_avg_latency and x$wait_classes_global_by_avg_latency Views
- 按事件event分组,统计各个event的平均延迟时长
- The wait_classes_global_by_latency and x$wait_classes_global_by_latency Views
- 按事件event分组,统计各个event的总延迟时长
- The waits_by_host_by_latency and x$waits_by_host_by_latency Views
- The waits_by_user_by_latency and x$waits_by_user_by_latency Views
- The waits_global_by_latency and x$waits_global_by_latency Views
- 所有event的延迟情况
- 简要介绍
- 等待类视图,分别从事件、主机、用户等角度,进行查询分析。
如果转载,请注明博文来源: www.cnblogs.com/xinysu/ ,版权归 博客园 苏家小萝卜 所有。望各位支持!

 浙公网安备 33010602011771号