

机器学习评判指标
0.背景
机器学习通常评判一个算法的好坏,是基于不同场景下采用不同的指标的。通常来说,有:
- [ ] MCC;
- [ ] BM;
- [ ] MK;
- [ ] Gini系数;
- [ ] Z score;
- [ ] Cost Curve;
- [ ] BLEU;
- [ ] Matthews correlation coefficient;
- [ ] METEOR;
- [ ] Brier score;
- [ ] NIST (metric);
- [ ] ROUGE (metric);
- [ ] Sørensen–Dice coefficient;
- [ ] Uncertainty coefficient, aka Proficiency;
- [ ] Word error rate (WER);
从wiki获取一个很重要的二分类混淆矩阵来说明后续的内容。
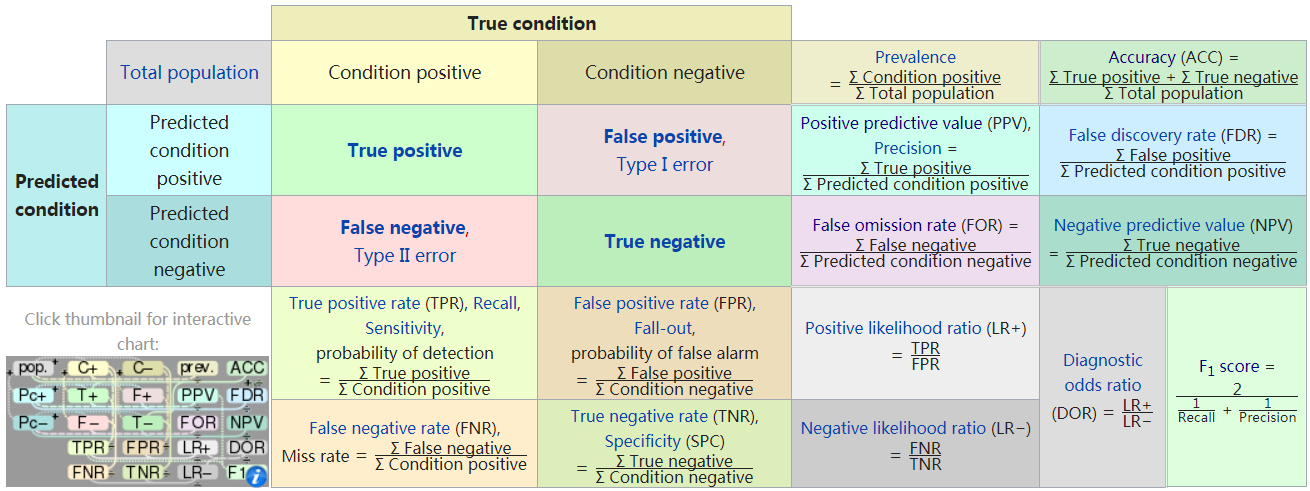
图0.1 wiki上的图
图0.1为wiki上针对2分类的一个混淆矩阵,及对应的各种指标表示。其中:
- true condition:列表示真实类别;predicted condition:行表示预测的类别;
- 真实正类=true positive+false negative;真实负类=false positive+true negative;
- 预测的正类=true positive+false positive; 预测的负类=false negative+true negative。
1. 不同指标的含义
1.1 accuracy&Precision Recall
如图0.1所示:
- accuracy:(图0.1中ACC)即最常用的准确度,表示\(\frac{所有预测对了的样本个数}{总的样本个数}\);
- Precision:(图0.1中PPV),精确率,表示预测的正类中预测对的样本个数比例\(\frac{true\, positive}{预测的正类}\);
- Recall:(图0.1中TPR),召回率,表示真实正类中预测对的样本个数比例\(\frac{true\, positive}{真实正类}\).
1.2 F measure&&G measure
1.2.1 F measure
传统的F measure(balanced F score,\(F_1\) score)就是关于precision和recall的Harmonic均值(是数学上一种均值算法),其公式如下:

其中:
- 当F score为0的时候最差:即precision和recall中某个值或者都接近0,则该模型越差;
- 当F score为1的时候最好:即precision和recall同时越接近1则该模型越好。
ps:F1 score同样也被称为Sørensen–Dice coefficient或者说叫Dice similarity coefficient (DSC).
将上述式子表示成更通用的形式如下图:

其中\(F_2\),\(F_{0.5}\)是相对\(F_1\)两个常用的F measure:
- 当\(\beta=2\),则表示recall的影响要大于precision;
- 当\(\beta=0.5\),则表示precision的影响要大于recall.
如果以图0.1中的type I error和type II error来表示F measure,则如下面式子:

1.2.2 G measure
相对于F measure 是一种Harmonic均值,G measure是一种geometric mean,同时也被称为 Fowlkes–Mallows index
 即
即 
1.3 PR Curve
针对2分类,以Recall为横轴,Precision为纵轴的曲线。如图2.1.1
1.4 Cost Curve
1.5 ROC
针对2分类,以图0.1中FPR为横轴,图0.1中TPR(也就是Recall)为纵轴的曲线。如图2.1.1
AUC:Aera under curve,即表示曲线下面积的意思
2. 不同指标之间的关系
早在1998年,Provost等人就认为简单的使用accuracy去评价算法的性能是完全不够的,因为会出现acc很高,而算法却相对是差的情况。所以他们推荐使用ROC来对算法进行评价。
2.1. PRC和ROC之间的关系
当不同类别中样本的个数差别很大的时候,ROC曲线是无法正确的描述算法性能的,假如2分类中负类特别多,那么当图0.1中FP变化很大时,在ROC上横坐标表示的FPR上表现的就不那么明显;而precision是通过FP与TP之间的对比而不是FP和TN之间的对比,从而如果FP变化很大的时候,precision就会变得很敏感了,从而能够抓取到当负类个数远大于正类时候算法性能的影响了。Jesse Davis以及前人就通过PRC来代替ROC进行算法性能描述。而这两种曲线之间一个很重要的区别就在于视觉上的体现,如图2.1.1所示。
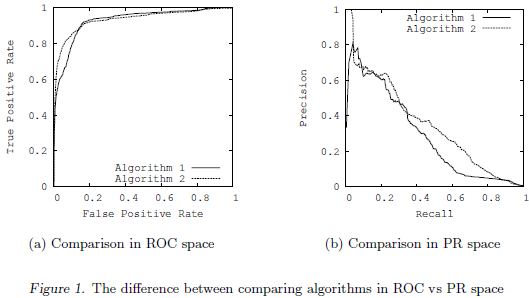
图2.1.1 PR与ROC的曲线图
图2.1.1是基于同一个高度不平衡的数据集和同样的2个算法基础上,得到的ROC和PRC。ROC表示的算法当在拐角越接近左上角越好(即<左下-左上-右上>这样的顺序);PRC表示的算法在拐角越接近右上角越好(即<左上-右上-右下>这样的顺序)。从中可以看出PRC更能给人以算法2要好于算法1的感觉。而ROC中虽然算法2的AUC更大,可是整体给人以这两种算法都很好了,只有细微差别的感觉。所以PRC不但可以放大2个算法之间的差别,还能看出这两种算法的发展空间还是很大的。
对于任何数据集来说(即有固定数据的正负类样本个数),基于同一个算法,PRC和ROC都包含了相同的点,也就是这两个曲线是具有等效性的,然而也保证了ROC中一个算法占优那么有且仅有该算法在PRC中也占优;可是如果一个算法在ROC中占优,却并不能保证其在PRC中也是占优的(即PRC占优可以推出该算法在ROC中也占优,而ROC中占优不代表其在PRC中占优)
2.2 ROC与CC(cost curves)之间的关系
如果不同类别中样本个数存在较大的偏差,则ROC曲线可能对算法的性能过分的乐观。Drummond等人推荐使用CC来替代ROC进行算法评价
2.3 AUC的探讨
参考文献:
- [ROC绘制] .introduction-to-auc-and-roc
- [F1] wiki.F1_score
- [ROC] J. A. Hanley and B. J. McNeil. The meaning and use of the area under a receiver operating characteristic (ROC) curve. Radiology, 1982.
- [ROC] Hanley J A, McNeil B J. A method of comparing the areas under receiver operating characteristic curves derived from the same cases[J]. Radiology, 1983, 148(3): 839-843.
- [ROC] McNeil B J, Hanley J A. Statistical approaches to the analysis of receiver operating characteristic (ROC) curves[J]. Medical decision making, 1984, 4(2): 137-150.
- [ROC] DeLong E R, DeLong D M, Clarke-Pearson D L. Comparing the areas under two or more correlated receiver operating characteristic curves: a nonparametric approach[J]. Biometrics, 1988: 837-845.
- [ROC] Bradley, A. (1997). The use of the area under the ROC curve in the evaluation of machine learning algorithms. Pattern Recognition, 30, 1145{1159.
- [ACC&ROC] Provost, F., Fawcett, T., & Kohavi, R. (1998). The case against accuracy estimation for comparing induction algorithms. Proceeding of the 15th International Conference on Machine Learning (pp. 445{453). Morgan Kaufmann, San Francisco, CA.
- [ROC&CC] Chris Drummond and Robert C. Holte, ‘Explicitly representing expected cost: An alternative to roc representation’, in Proceedings of the Sixth ACM SIGKDD International Conference on Knowledge Discovery and Data Mining, pp. 198–207, (2000).
- [ROC] wiki.Receiver_operating_characteristic
- [AUC] Cortes, C., & Mohri, M. (2003). AUC optimization vs. error rate minimization. Neural Information Processing Systems 15 (NIPS). MIT Press
- [ROC&CC] Drummond, C., & Holte, R. C. (2004). What ROC curves can't do (and cost curves can). ROCAI (pp. 19{26).
- [ROC] Zhang, Jun; Mueller, Shane T. (2005). "A note on ROC analysis and non-parametric estimate of sensitivity". Psychometrika. 70: 203–212.
- [ROC] Fan J, Upadhye S, Worster A. Understanding receiver operating characteristic (ROC) curves[J]. Canadian Journal of Emergency Medicine, 2006, 8(1): 19-20.
- [ROC] Fawcett, Tom (2006). An Introduction to ROC Analysis. Pattern Recognition Letters. 27 (8): 861–874.
- [PR&ROC] .The Relationship Between Precision-Recall and ROC Curves, Jesse Davis and Mark Goadrich, ICML 2006
- [ROC] Brown C D, Davis H T. Receiver operating characteristics curves and related decision measures: A tutorial[J]. Chemometrics and Intelligent Laboratory Systems, 2006, 80(1): 24-38.
- [ROC] Weng C G, Poon J. A new evaluation measure for imbalanced datasets[C]//Proceedings of the 7th Australasian Data Mining Conference-Volume 87. Australian Computer Society, Inc., 2008: 27-32.
- [ROC] Powers, David M W (2011). Evaluation: From Precision, Recall and F-Measure to ROC, Informedness, Markedness & Correlation . Journal of Machine Learning Technologies. 2 (1): 37–63.
- [ROC] Flach P A. ROC analysis[M]//Encyclopedia of machine learning. Springer US, 2011: 869-875.
- [ROC] Hernandez-Orallo, J. (2013). "ROC curves for regression". Pattern Recognition. 46 (12): 3395–3411 .
- [ROC] .Using the Receiver Operating Characteristic (ROC) curve to analyze a classification model: A final note of historical interest. Department of Mathematics, University of Utah. Department of Mathematics, University of Utah. Retrieved May 25, 2017.
- [CC] Drummond C, Holte R C. Cost curves: An improved method for visualizing classifier performance[J]. Machine learning, 2006, 65(1): 95-130.

 浙公网安备 33010602011771号