
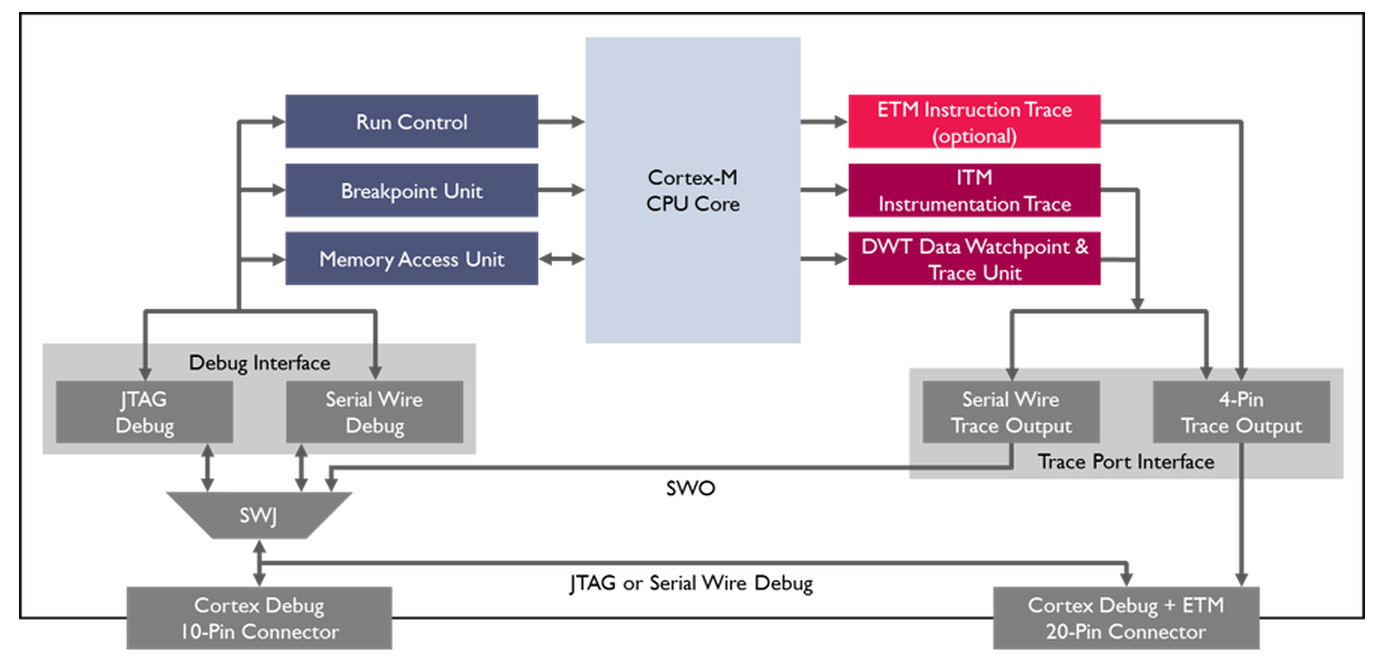
CoreSight™ Technology
ARM Cortex-M processor-based devices use the ARM CoreSight technology
which introduces powerful new debug and trace capabilities.
Debug features:
- Run Control of the processor allowing you to start and stop programs
- Single Step one source or assembler line
- Set breakpoints while the processor is running
- Read/write memory contents and peripheral registers on-the-fly
- Program internal and external FLASH memory
Trace features:
- Serial Wire Viewer (SWV) provides program counter (PC) sampling, data trace, event trace, and instrumentation trace information
- Instruction (ETM) Trace streamed directly to your PC enabling debugging of historical sequences, software profiling, and code coverage analysis
The CoreSight features are available via JTAG and Serial Wire Debug interfaces using standard low-cost target connectors.
JTAG
JTAG is the industry-standard interface used to download and debug programs on a target processor,
as well as many other functions. It offers a convenient and easy way to connect to devices and is available
on all ARM processor-based devices.
The JTAG interface can be used with Cortex-M based devices to access the CoreSight debug capabilities.
Serial Wire Debug : SWD
The Serial Wire Debug (SWD) mode is an alternative to the standard JTAG interface.
It uses only two pins to provide the same debug functionality as JTAG with no performance penalty,
and introduces data trace capabilities with the Serial Wire Viewer (SWV).
The SWD interface pins can be overlaid with JTAG signals, allowing the standard target connectors to be used:
- TCLK - SWCLK (Serial Wire Clock)
- TMS - SWDIO (Serial Wire Data Input/Output)
- TDO - SWO (Serial Wire Output - required for SWV)
JTAG and SWD modes are fully supported by ULINK2, ULINK-ME, and ULINKpro.
Serial Wire Viewer : SWV
Cortex-M3, Cortex-M4, and Cortex-M7 based devices are able to provide high-speed data trace information
in a number of ways depending on the type of information or analysis you require.
The Serial Wire Serial (SWV) provides real-time data trace information from various sources within a Cortex-M3/M4/M7 device.
It is transmitted via the SWO pin while your system processor continues to run at full speed.
Information is available from the ITM (Instrumentation Trace Macrocell) and DWT (Data Watchpoint and Trace) units, providing:
- PC (Program Counter) sampling
- Event counters that show CPU cycle statistics
- Exception and Interrupt execution with timing statistics
- Trace data - data reads and writes used for timing analysis
- ITM trace information used for simple printf-style debugging
SWV data trace is available via the SWO pin in two output formats:
- UART style (1Mb/s) - supported by ULINK2 and ULINK-ME
- Manchester encoded (100Mb/s) - supported by ULINKpro
 Note
Note
- Data trace via SWV is not available using the JTAG interface.
- SWV is only available when using Serial Wire Debug mode.
Embedded Trace Macrocell
The Embedded Trace Macrocell (ETM) provides high bandwidth instruction trace
via four dedicated trace pins accessible on the 20-pin Cortex Debug + ETM connector.
This enhanced trace capability records a program's execution instruction-by-instruction which can be used for:
- Debugging historical sequences leading up to events of interest
- Software profiling and algorithm optimization
- Code coverage analysis
Note
- ETM instruction trace is only supported by ULINKpro.
- ETM is optionally available on Cortex-M3, Cortex-M4, and Cortex-M7 processor-based microcontrollers.
- It is not available on Cortex-M0, M0+ and M1.

