SpringCloud学习笔记(5):Hystrix Dashboard可视化监控数据
简介
上篇文章中讲了使用Hystrix实现容错,除此之外,Hystrix还提供了近乎实时的监控。本文将介绍如何进行服务监控以及使用Hystrix Dashboard来让监控数据图形化。
项目介绍
- sc-parent,父模块(请参照SpringCloud学习笔记(1):Eureka注册中心)
- sc-eureka,注册中心(请参照SpringCloud学习笔记(1):Eureka注册中心)
- sc-consumer-hystrix-ribbon,使用Hystrix+Ribbon的消费者(请参照SpringCloud学习笔记(4):Hystrix容错机制)
- sc-consumer-hystrix-feign,使用Hystrix+Feign的消费者(请参照SpringCloud学习笔记(4):Hystrix容错机制)
- sc-hystrix-dashboard,用于可视化监控数据
- sc-turbine,用于聚合监控数据
开启消费者服务监控
1.修改消费者sc-consumer-hystrix-ribbon和sc-consumer-hystrix-feign的pom.xml,新增如下依赖:
	<dependency>
        <groupId>org.springframework.boot</groupId>
        <artifactId>spring-boot-starter-actuator</artifactId>
    </dependency>
2.修改消费者sc-consumer-hystrix-ribbon和sc-consumer-hystrix-feign的application.yml,新增如下配置:
management:
  endpoints:
    web:
      exposure:
        include: 'hystrix.stream'  #暴露hystrix.stream端点
3.测试访问消费者sc-consumer-hystrix-feign的监控数据
依次启动注册中心sc-eureka和消费者sc-consumer-hystrix-feign,并访问http://localhost:8084/actuator/hystrix.stream,结果显示如下:
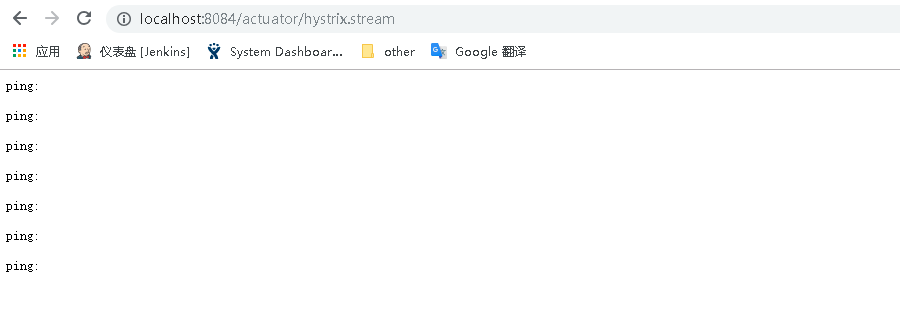
出现上图是因为消费者服务没有被访问,所以这里先调用下消费者服务:http://localhost:8084/feign/getBookList,然后再访问http://localhost:8084/actuator/hystrix.stream:
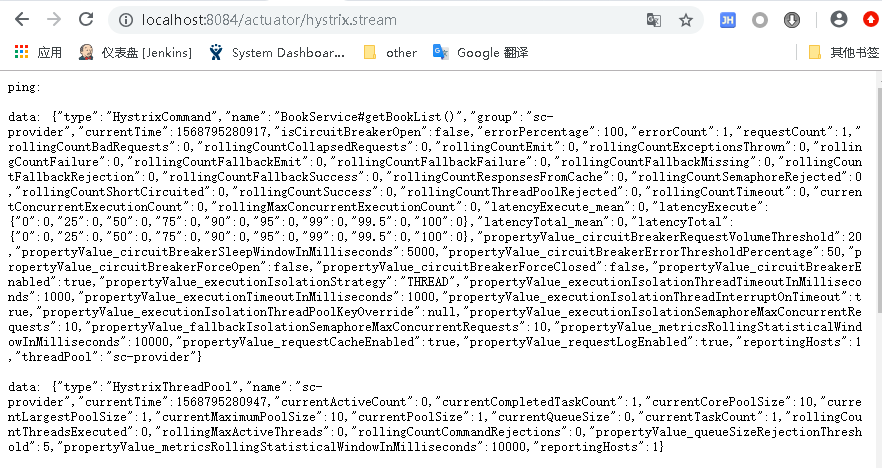
可以看到监控数据是以文字的形式展示的,并不直观,下面将介绍使用Hystrix Dashboard可视化监控数据。
使用Hystrix Dashboard可视化监控数据
1.在父模块下创建子模块项目sc-hystrix-dashboard,pom.xml:
<project xmlns="http://maven.apache.org/POM/4.0.0" xmlns:xsi="http://www.w3.org/2001/XMLSchema-instance" xsi:schemaLocation="http://maven.apache.org/POM/4.0.0 http://maven.apache.org/xsd/maven-4.0.0.xsd">
  <modelVersion>4.0.0</modelVersion>
  <parent>
    <groupId>com.cf</groupId>
    <artifactId>sc-parent</artifactId>
    <version>0.0.1-SNAPSHOT</version>
  </parent>
  <artifactId>sc-hystrix-dashboard</artifactId>

  <dependencies>
  	<dependency>
	    <groupId>org.springframework.cloud</groupId>
	    <artifactId>spring-cloud-starter-netflix-hystrix-dashboard</artifactId>
	</dependency>
  </dependencies>
</project>
2.创建启动类dashboard.DashBoardApplication:
package dashboard;
import org.springframework.boot.SpringApplication;
import org.springframework.boot.autoconfigure.SpringBootApplication;
import org.springframework.cloud.netflix.hystrix.dashboard.EnableHystrixDashboard;

@SpringBootApplication
@EnableHystrixDashboard
public class DashBoardApplication {
	public static void main(String[] args) {
		SpringApplication.run(DashBoardApplication.class, args);
	}
}
3.创建application.yml:
server:
  port: 8086

spring:
  application:
    name: sc-hystrix-dashboard
4.测试
启动sc-hystrix-dashboard后,访问http://localhost:8086/hystrix将会显示Hystrix Dashboard的主界面:
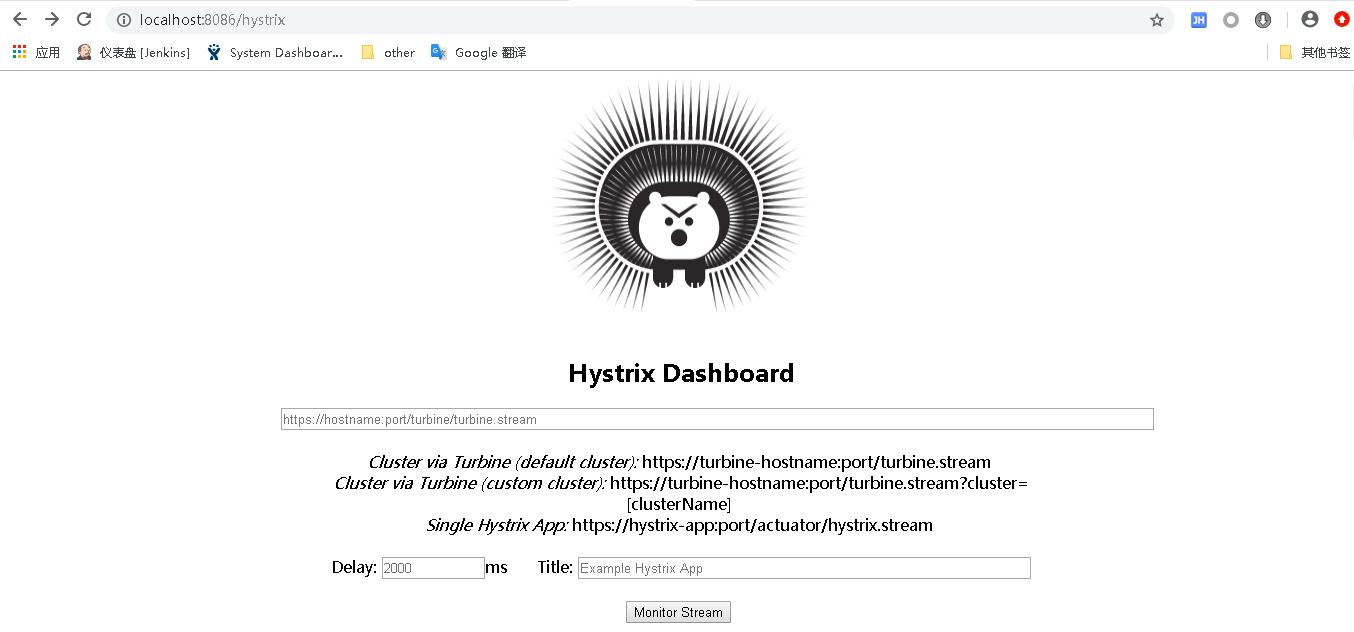
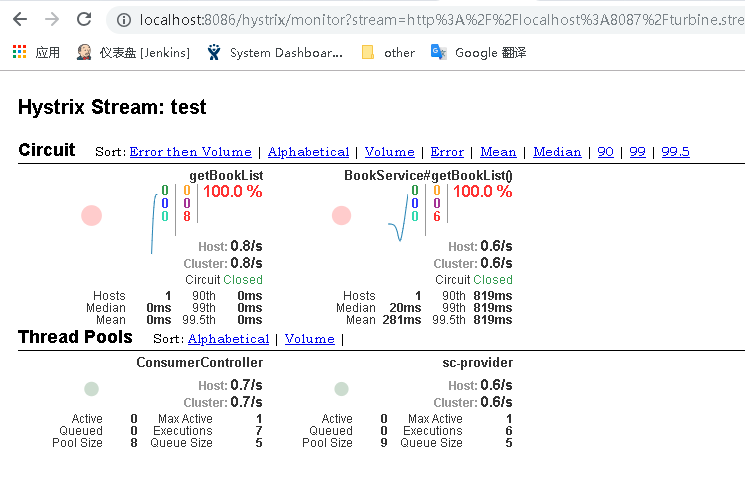
然后需要将消费者sc-consumer-hystrix-feign的监控数据添加到Hystrix Dashboard中。依次启动注册中心sc-eureka和消费者sc-consumer-hystrix-feign,将监控数据的地址输入到Hystrix Dashboard主界面的文本框中,点击Monitor Stream,然后重复访问消费者服务http://localhost:8084/feign/getBookList,Hystrix Dashboard显示如下:
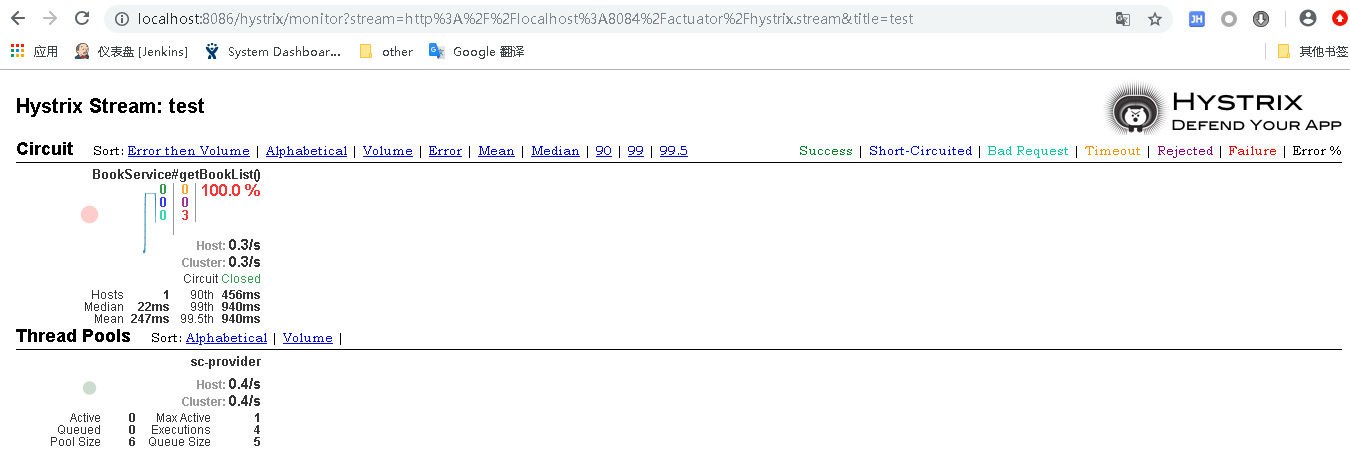
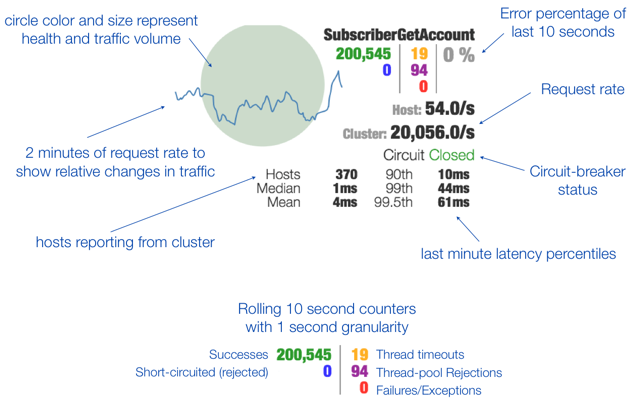
关于界面上指标表示的内容可以参考下图:
使用Turbine聚合监控数据
/hystrix.stream端点只能监控到单个服务实例,如果需要查看其他服务实例监控信息则需要在Hystrix Dashboard切换想要监控的地址。通过Turbine可以将所有/hystrix.stream端点的数据聚合到一个组合的/turbine.stream中,然后在Hystrix Dashboard中就可以查看所有服务的监控信息。
1.修改消费者sc-consumer-hystrix-ribbon和sc-consumer-hystrix-feign的application.yml,将registerWithEureka设为true或者直接去掉该配置(默认为true)。因为Turbine需要从Eureka上获取服务的地址信息,然后才能获取到服务的监控数据,所以消费者服务需要到Eureka注册中心注册。
eureka:
  client:
    #registerWithEureka: false
    serviceUrl:
      defaultZone: http://localhost:8080/eureka/
2.在父模块下创建子模块项目sc-turbine,pom.xml:
<project xmlns="http://maven.apache.org/POM/4.0.0" xmlns:xsi="http://www.w3.org/2001/XMLSchema-instance" xsi:schemaLocation="http://maven.apache.org/POM/4.0.0 http://maven.apache.org/xsd/maven-4.0.0.xsd">
  <modelVersion>4.0.0</modelVersion>
  <parent>
    <groupId>com.cf</groupId>
    <artifactId>sc-parent</artifactId>
    <version>0.0.1-SNAPSHOT</version>
  </parent>
  <artifactId>sc-turbine</artifactId>

  <dependencies>
  	<dependency>
	    <groupId>org.springframework.cloud</groupId>
	    <artifactId>spring-cloud-starter-netflix-turbine</artifactId>
	</dependency>
  </dependencies>
</project>
3.创建启动类turbine.TurbineApplication:
package turbine;
import org.springframework.boot.SpringApplication;
import org.springframework.boot.autoconfigure.SpringBootApplication;
import org.springframework.cloud.netflix.turbine.EnableTurbine;

@SpringBootApplication
@EnableTurbine
public class TurbineApplication {
	public static void main(String[] args) {
		SpringApplication.run(TurbineApplication.class, args);
	}
}
4.创建application.yml:
server:
  port: 8087

spring:
  application:
    name: sc-turbine

eureka:
  client:
    registerWithEureka: false
    serviceUrl:
      defaultZone: http://localhost:8080/eureka/

turbine:
  appConfig: sc-consumer-hystrix-ribbon,sc-consumer-hystrix-feign #指定要监控的服务名
  clusterNameExpression: "'default'"
5.测试
依次启动注册中心sc-eureka、消费者sc-consumer-hystrix-feign、消费者sc-consumer-hystrix-ribbon、sc-turbine、sc-hystrix-dashboard,访问http://localhost:8086/hystrix进入到Hystrix Dashboard主界面中,然后在Hystrix Dashboard主界面的文本框中输入http://localhost:8087/turbine.stream,点击Monitor Stream进入监控界面,重复访问两个消费者服务,监控界面上将显示两个消费者的监控信息: