

matplotlib库详解
学习是在成长的过程中慢慢积累起来的,每次的博客记录也都是在平时学习中遇到的,随着学习的深入,会慢慢的补充。
先学习matplotlib两个方面的应用:多条曲线画在一张图里面、多条曲线画在不同的图里面
plt.plot(x,y,format_string,**kwargs),其中:
x、y为两轴的数据
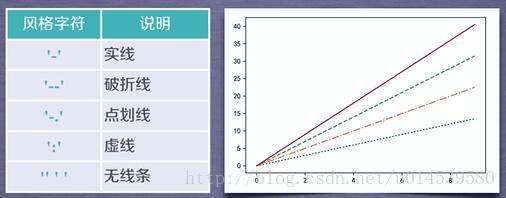
format_string为控制曲线的格式字串,如下:


1、多条曲线画在一张图里面
 1 import matplotlib.pyplot as plt
 2 import numpy as np
 3 import math
 4
 5 x_arr = np.linspace(start=0.,stop=2*math.pi,num=100)
 6 x = []
 7 for i in x_arr:
 8     x.append(i)
 9
10 y_sin = []
11 y_cos = []
12 for item in x:
13     y_sin.append(math.sin(item))
14     y_cos.append(math.cos(item))
15 plt.plot(x,y_sin)
16 plt.plot(x,y_cos)
17 plt.show()
图像如下:

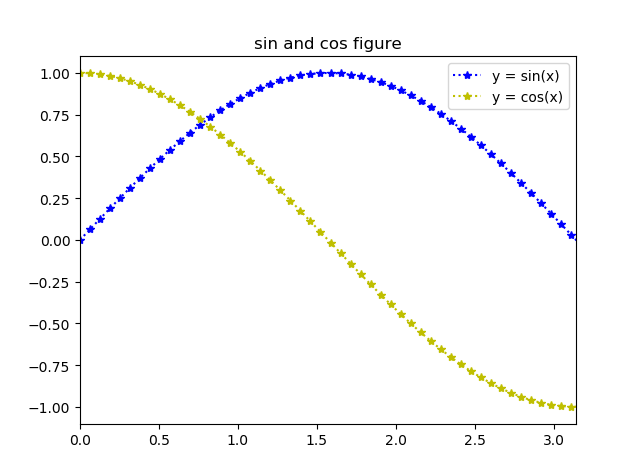
下面对图像做如下操作:标题、图示、x轴y轴范围,标记点操作
 1 import matplotlib.pyplot as plt
 2 import numpy as np
 3 import math
 4
 5 x_arr = np.linspace(start=0.,stop=2*math.pi,num=100)
 6 x = []
 7 for i in x_arr:
 8     x.append(i)
 9
10 y_sin = []
11 y_cos = []
12 for item in x:
13     y_sin.append(math.sin(item))
14     y_cos.append(math.cos(item))
15
16 #黑色虚线*号与黄色虚线*号,lable为图示,需要写plt.legend()才能显示图示
17 plt.plot(x,y_sin,'b:*',label = "y = sin(x)")
18 plt.plot(x,y_cos,'y:*',label = "y = cos(x)")
19 plt.legend()
20 #图像标题
21 plt.title("sin and cos figure")
22 #x轴范围
23 plt.xlim(0.,math.pi)
24 plt.show()
图像如下:
2、多条曲线画在不同的图里面
 1 import matplotlib.pyplot as plt
 2 import numpy as np
 3 import math
 4
 5 x_arr = np.linspace(start=0.,stop=2*math.pi,num=100)
 6 x = []
 7 for i in x_arr:
 8     x.append(i)
 9
10 y_sin = []
11 y_cos = []
12 for item in x:
13     y_sin.append(math.sin(item))
14     y_cos.append(math.cos(item))
15
16 plt.subplot(2,1,1)
17 plt.plot(x,y_sin)
18 plt.title('y=sin()')
19
20 #设置图的间距
21 plt.tight_layout(pad=3)
22 plt.subplot(2,1,2)
23 plt.plot(x,y_cos)
24 plt.title('y=cos(x)')
25
26 plt.show()
图像如下:

标题、图示、坐标轴范围、标记点等操作是一样的。
三样东西有助于缓解生命的疲劳:希望、睡眠和微笑。---康德

