


基于Python的Grib数据可视化
 利用Python语言实现Grib数据可视化主要依靠三个库——pygrib、numpy和matplotlib。pygrib是欧洲中期天气预报中心(ECMWF)的GRIG API C库的Python接口,通过这个库可以将Grib数据读取出来;numpy是Python的一种开源的数值计算扩展,这种工具可用来存储和处理大型矩阵;matplotlib是python著名的绘图库,它提供了一整套和matlab相似的命令API,十分适合交互式地进行制图;在数据可视化过程中,我们常需要将数据在地图上画出来,所以还需要matplotlib的一个子包basemap,负责地图绘制。
一、库的安装
(一)matplotlib安装
-
matplotlib依赖
-
安装过程
这里我都是通过源码包安装的,大家也可以再终端里通过pip install 命令来安装
1、安装nose
解压缩后,进入命令提示符 运行
1 python3 setup.py install
2、安装numpy
解压缩后,进入命令提示符 运行
1 python3 setup.py install
3、安装pyparsing
解压缩后,进入命令提示符 运行
1 python3 setup.py install
4、安装python-dateutil
解压缩后,进入命令提示符 运行
1 python3 setup.py install
5、安装cycler
解压缩后,进入命令提示符 运行
1 python3 setup.py install
6、安装pkg-config
1 ./configure --with-intermal-glib
2 make && date
3 sudo make install && date
7、安装freetype
1  ./configure
2  make && date
3  sudo make install && date
8、安装libpng
1  ./configure
2  make && date
3  sudo make install && date
9、安装matplotlib-1.5.0
解压缩后,进入命令提示符 运行
1 python3 setup.py install
(二)basemap安装
-
basemap依赖
-
安装过程
1、安装GEOS
1  ./configure
2  make && date
3  sudo make install && date
2、安装pyproj
1 python3 setup.py install
3、安装basemap
1 python3 setup.py install
(三)pygrib安装
-
pygrib依赖
-
安装过程
由于之前已经安装了numpy和pyproj,这里只需安装Jasper和GRIB API即可安装pygrib
1、安装Jasper
1 ./configure
2 make && date
3 sudo make install && date
2、安装GRIB API
1 ./configure --with-jasper='/usr/local/'
2 make && date
3 sudo make install && date
3、安装pygrib
安装pygrib之前首先要根据自己的实际情况修改文件目录下的setup.cfg文件,最主要的就是修改grib_api_dir和jasper_dir,这两个是刚刚安装的Jasper和GRIB API的路径,如果这两个地址不正确安装会报错


 1 # Rename this file to setup.cfg to set pygrib's
 2 # build options.
 3 # Follow instructions below for editing.
 4 [directories]
 5 # uncomment and set to grib_api install location.
 6 # Include files should be located in grib_api_dir/include and
 7 # the library should be located in grib_api_dir/lib.
 8 # If the libraries and include files are installed in separate locations,
 9 # use grib_api_libdir and grib_api_incdir to specify the locations
10 # separately.
11 grib_api_dir = /usr/local
12 # if grib_api was built with jasper support for JPEG200,
13 # uncomment and set to jasper lib install location.
14 # If the libraries and include files are installed in separate locations,
15 # use jasper_libdir and jasper_incdir.
16 jasper_dir = /usr/local
17 # if grib_api was built with openjpeg support for JPEG200,
18 # uncomment and set to openjpeg lib install location.
19 # If the libraries and include files are installed in separate locations,
20 # use openjpeg_libdir and openjpeg_incdir.
21 #openjpeg_dir = /opt/local
22 # if grib_api was built with png support,
23 # uncomment and set to png lib install location.
24 # If the libraries and include files are installed in separate locations,
25 # use png_libdir and png_incdir.
26 png_dir = /usr
27 # if grib_api was built with png support,
28 # uncomment and set to zlib install location.
29 zlib_dir = /usr
30 # install man pages for command line utilities here
31 #man_dir = /usr/local/man
修改好就可以正常安装了
1 python3 setup.py install
二、grib数据读取
虽然我做的东西和气象沾边,但是我本身并不是气象专业出身,所有这些东西都是我慢慢研究琢磨出来的,所以有些方面可能讲的比较外行,有不对的地方欢迎大家留言指正。
(一)导入pygrib模块
1 >>> import pygrib
(二)打开Grib文件
1 >>> grbs = pygrib.open('/Users/Kallan/Documents/data/echhae50.082')
(三)提取文件信息
1 >>> grbs.seek(0)
2 >>> for grb in grbs:
3 grb
4 1:Geopotential Height:gpm (instant):regular_ll:isobaricInhPa:level 500:fcst time 24 :from 201507081200
信息解读
1 :数据列表的行号,有的文件可能包括多个数据
Geopotential Height:数据的名称
gpm (instant):数据的单位
regular_ll:常规数据,其实这个字段我也不清楚
isobaricInhPa:这个字段表示的是数据属性,此处表示是以hPa为单位的等压面
level 500:这个字段表示的是高度层
fcst time 24 :预报时效
from 201507081200 :起报时间
综合上面的信息可以得出,这个文件是从2015年7月8日12时开始的24小时后500hPa等压面高度场数据
(四)导出文件数据
 1 >>> grb = grbs.select(name='Geopotential Height')[0]
 2 >>> data = grb.values
 3 >>> print(data.shape,data.min(),data.max())
 4 (37, 37) 5368.6796875 5941.0390625
 5 >>> lat,lon=grb.latlons()
 6 >>> print(lat,'\n',lon)
 7 [[  0.    0.    0.  ...,   0.    0.    0. ]
 8 [  2.5   2.5   2.5 ...,   2.5   2.5   2.5]
 9 [  5.    5.    5.  ...,   5.    5.    5. ]
10 ...,
11 [ 85.   85.   85.  ...,  85.   85.   85. ]
12 [ 87.5  87.5  87.5 ...,  87.5  87.5  87.5]
13 [ 90.   90.   90.  ...,  90.   90.   90. ]]
14 [[-90.  -87.5 -85.  ...,  -5.   -2.5   0. ]
15 [-90.  -87.5 -85.  ...,  -5.   -2.5   0. ]
16 [-90.  -87.5 -85.  ...,  -5.   -2.5   0. ]
17 ...,
18 [-90.  -87.5 -85.  ...,  -5.   -2.5   0. ]
19 [-90.  -87.5 -85.  ...,  -5.   -2.5   0. ]
20 [-90.  -87.5 -85.  ...,  -5.   -2.5   0. ]]
三、grib数据可视化
(一)导入需要的模块
1 >>> import matplotlib.pyplot as plt
2 >>> from mpl_toolkits.basemap import Basemap
3 >>> import numpy as np
(二)创建一个figure
1 >>> plt.figure()
2 <matplotlib.figure.Figure object at 0x107e65198>
(三)创建一个basemap实例
 1 >>> m=Basemap(projection='mill',lat_ts=10,llcrnrlon=lon.min(), \
 2  urcrnrlon=lon.max(),llcrnrlat=lat.min(),urcrnrlat=lat.max(), \
 3  resolution='c')
 4 >>> m.drawcoastlines(linewidth=0.25)
 5 <matplotlib.collections.LineCollection object at 0x1091c1f28>
 6 >>> m.drawcountries(linewidth=0.25)
 7 <matplotlib.collections.LineCollection object at 0x10621d0f0>
 8 >>> m.fillcontinents(color='coral',lake_color='aqua')
 9 >>> m.drawmapboundary(fill_color='aqua')
10 <matplotlib.patches.Rectangle object at 0x10918b3c8>
11 >>> m.drawmeridians(np.arange(0,360,30))
12 >>> m.drawparallels(np.arange(-90,90,30))
(四)将lat,lon的数据格式转换成投影需要的格式存入x,y
1 >>> x, y = m(lon,lat)
(五)绘制等值线
1 >>> cs = m.contour(x,y,data,15,linewidths=1.5)
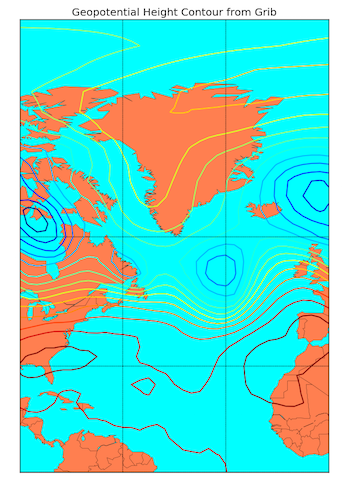
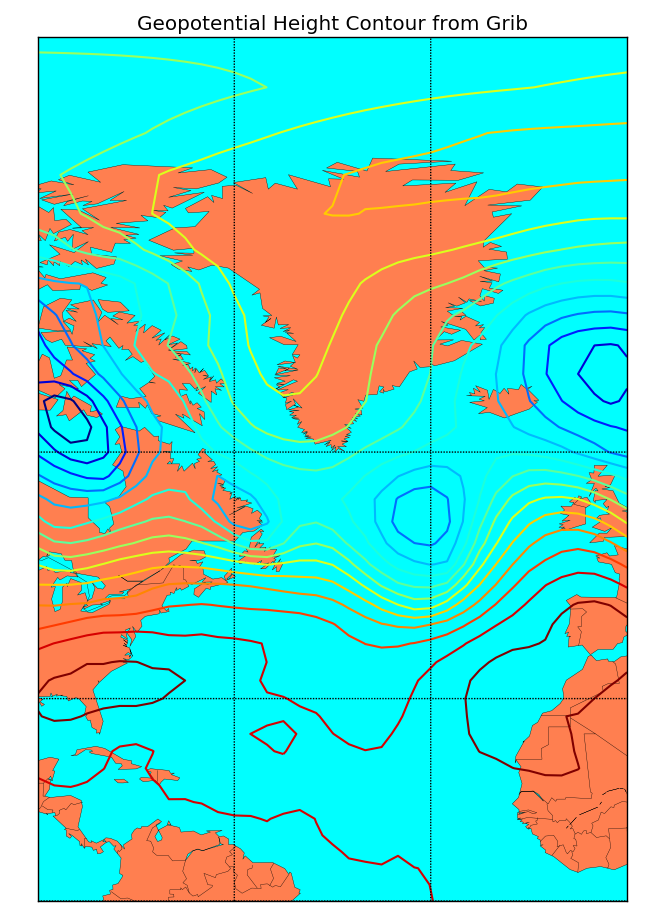
(六)命名并显示图像
1 >>> plt.title('Geopotential Height Contour from Grib')
2 <matplotlib.text.Text object at 0x10918bda0>
3 >>> plt.show()
(七)图像展示![]()
本文版权归作者和博客园共有,欢迎转载,但未经作者同意必须保留此段声明,且在文章页面明显位置给出原文连接,否则保留追究法律责任的权利。
想观看Matplotlib教学视频,了解更多Matplotlib实用技巧可关注
微信公众账号: MatplotlibClass

今日头条号:Matplotlib小讲堂


 浙公网安备 33010602011771号