
matplotlib雷达图
用matplotlib画雷达图,网上流传的版本其实都是官网的一个例子。但是那个例子太复杂,而且它封装了几个类,让人难以一眼看出其本质。
我给出一个简单的解决方法,没有任何封装。作本文的原因,是为了回答百度网友的提问。 好吧,图很丑~~~。
原问题见:http://zhidao.baidu.com/question/1048071753829017339.html?fr=qlquick&entry=qb_browse_word
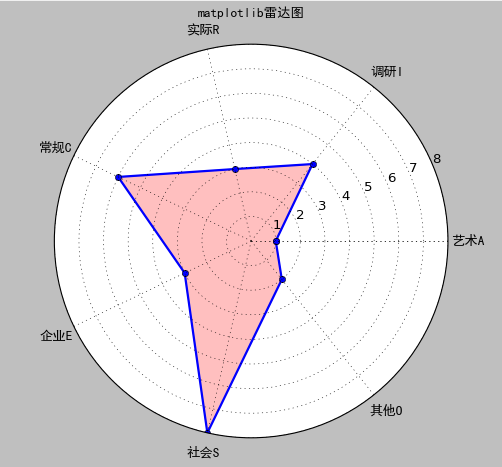
【效果图】

增加一个数据,并且使用了填充
【源代码】
'''
matplotlib雷达图
'''
import numpy as np
import matplotlib.pyplot as plt

#=======自己设置开始============
#标签
labels = np.array(['艺术A','调研I','实际R','常规C','企业E','社会S'])
#数据个数
dataLenth = 6
#数据
data = np.array([1,4,3,6,4,8])
#========自己设置结束============

angles = np.linspace(0, 2*np.pi, dataLenth, endpoint=False)
data = np.concatenate((data, [data[0]])) # 闭合
angles = np.concatenate((angles, [angles[0]])) # 闭合

fig = plt.figure()
ax = fig.add_subplot(111, polar=True)# polar参数!!
ax.plot(angles, data, 'bo-', linewidth=2)# 画线
ax.fill(angles, data, facecolor='r', alpha=0.25)# 填充
ax.set_thetagrids(angles * 180/np.pi, labels, fontproperties="SimHei")
ax.set_title("matplotlib雷达图", va='bottom', fontproperties="SimHei")
ax.set_rlim(0,10)
ax.grid(True)
plt.show()

