
音视频学习-直播助手内存优化
一、iOS进程中使用的内存
1)内存的类型
Physical Memory Wired—The amount of memory being used by the operating system.
Physical Memory Active—The amount of memory being used by processes other than the operating system.
Physical Memory Inactive—The amount of memory that was recently released.
Physical Memory Used—The total amount of memory that was used while performing the sample.
Physical Memory Free—The amount of available memory.
Total VM Size—The total size of virtual memory.
VM Page In Bytes—The amount of memory calls sent to RAM.
VM Page Out Bytes—The amount of memory calls sent to disk.
VM Swap Used—The amount of memory called from disk.
2)Xcode 自带的Instruments工具能够监测到下面几种类型
The ObjectAlloc instrument records and displays a history of all memory allocations since the launch of your application.
The Leaks instrument looks for allocated memory that is no longer referenced by your program’s code; see Finding Leaks Using Instruments.
The Shared Memory instrument monitors the opening and unlinking of shared memory regions.
The Memory Monitor instrument measures and records the system’s overall memory usage.
通常代码中OC的对象生成释放,c、C++对象的生成释放,malloc和free都能被监控
二、直播助手在排查内存问题时却遇到一个奇怪的问题
Instruments工具记录没有内存泄漏,Xcode 显示内存从70MB到90MB,在网上搜索之后,得到下面的答案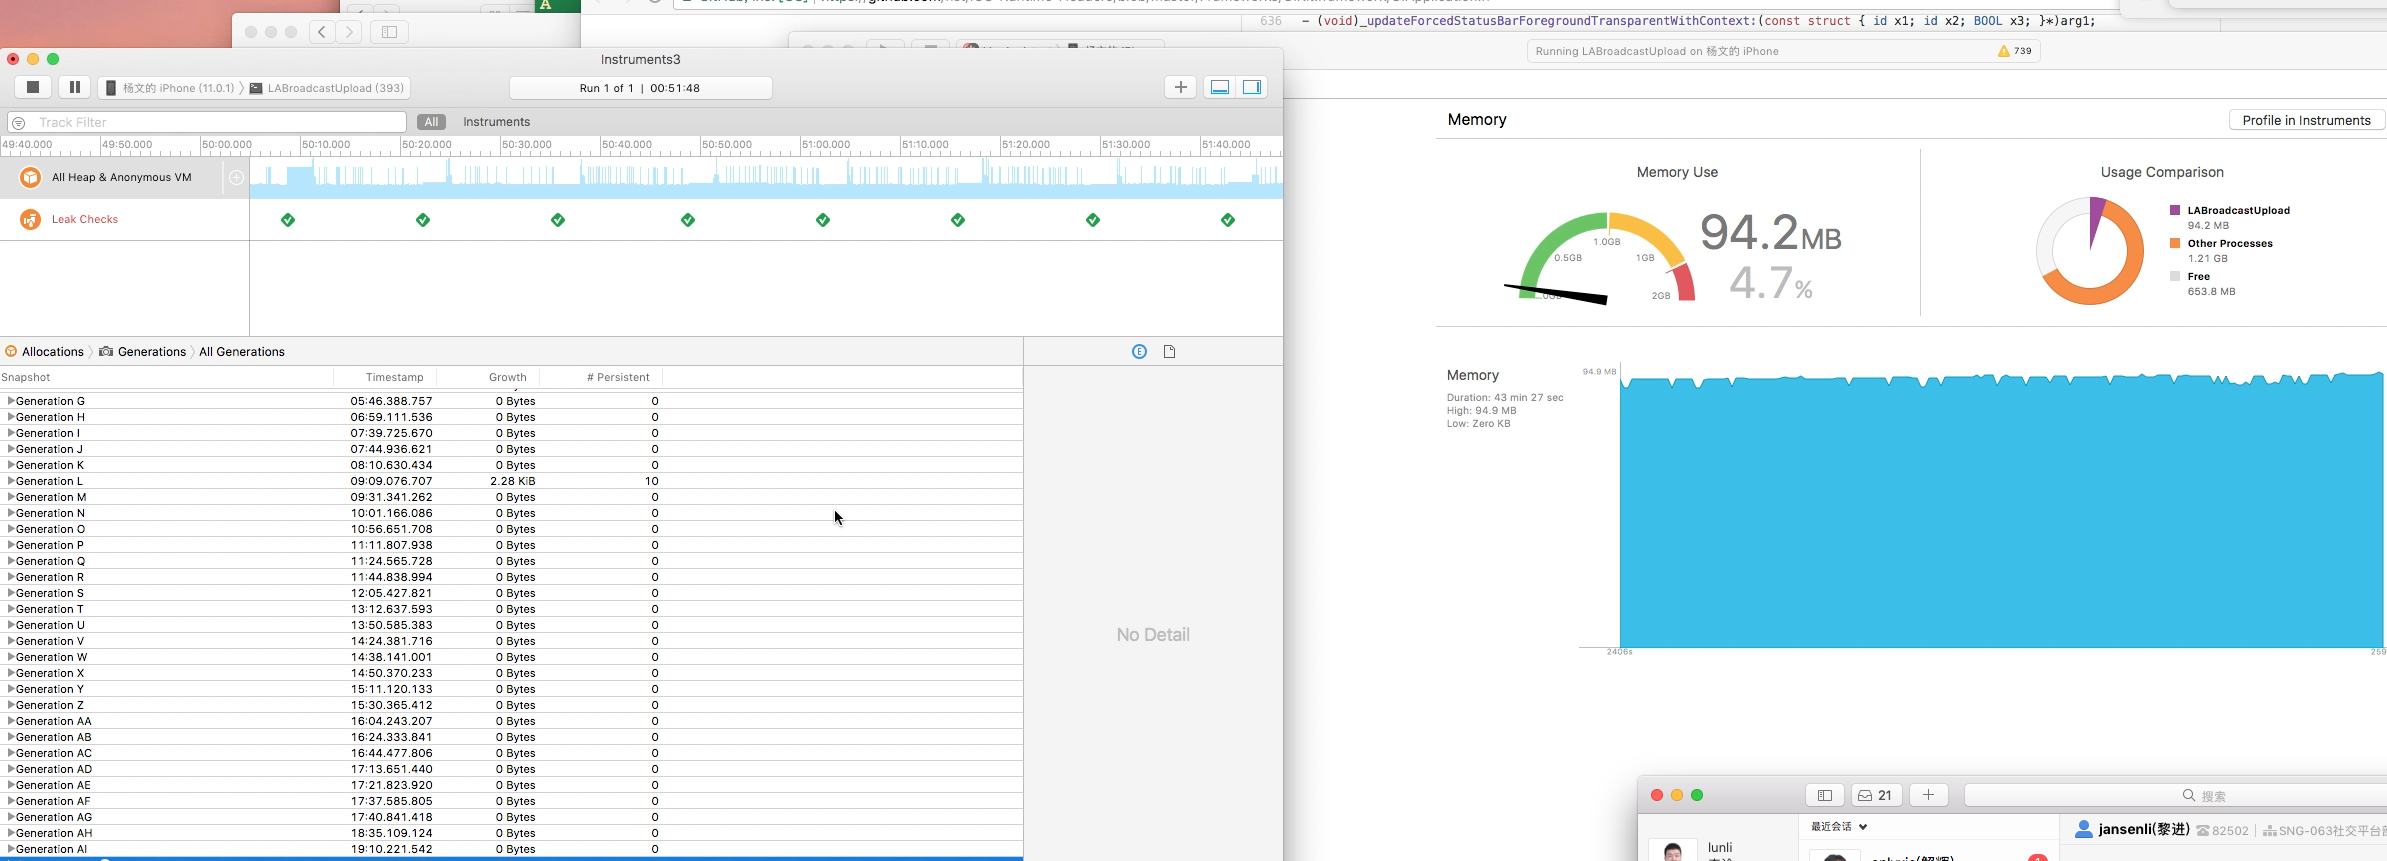
三、结论
1)Xcode自带的内存监控工具的内存数据可以说是错误的,要以Instruments工具为准
https://stackoverflow.com/questions/28321954/ios-memory-usage-increasing-cant-find-the-culprit/28566113#28566113


