


今天下午解决一个困扰多天的内存问题,将分析过程记录一下
问题描述:
w3wp内存慢慢升高,最后大约会达到1.3G左右,Cpu资源并不是很紧张
分析过程:
之前碰到的几次问题都是托管内存泄漏,按以往的经验直接在内存高点时dump了一个文件,一个1.4G大的文件,windbg打开,
0:000> !eeheap -gc
GC Heap Size 0x22cf6b80(584018816)
因为最近一个缓存的项目刚上线,将一些数据直接放到了内存中,500多M算是一个意料中的大小。至少和1.4G比起来,这次内存爆发的主要原因也应该不是这个。
用!eeheap -loader看了一下,也没有出现经典的module加载问题。
但看看堆里头的内容总不是什么坏事
0:000> !dumpheap -stat
001c91f8 1216 78189440 Free
7912dae8 14755 142620572 System.Byte[]
790fd8c4 1625830 201229328 System.String
很常见的大字符串问题,找出大于100K的:
!dumpheap -mt 790fd8c4 -min 100000
---省略很长的一些内容----
27f93108 790fd8c4 241560
total 76 objects
------------------------------
total 320 objects
Statistics:
MT Count TotalSize Class Name
790fd8c4 320 54798168 System.String
从里面找了几个长达1M的字符串,基本上都是一些查数据库返回的订单信息串
正在郁闷的时候,运维部门提供了第二个dump文件,用以上相同的方法对文件进行了分析,得出的结论是gc heap大小差不多,但dump文件增长了100多兆。
开始怀疑碰上了非托管的泄漏。
几经周折,运维部门同意我直接连上服务器看,打开性能监视器(perfmon)先载了private bytes,virtual bytes ,bytes in all heaps来看,
出现了曾经熟悉的一个场景,private bytes和virtual bytes都是总体趋势上往上升,且virtual bytes比private bytes上升得快,但是bytes in all heaps没有太大的波动,说明即有泄漏又有碎片,更像是非托管的泄漏。
于是用debugdiag进行监控,但很不幸的是增长的过程很慢,增长了几十兆时抓取了一个dump,
分析生成的报表中:
webengine.dll is responsible for 13.49 MBytes worth of outstanding allocations. The following are the top 2 memory consuming functions:
webengine!BufferPool::GetBuffer+4a: 13.48 MBytes worth of outstanding allocations.
webengine!MemAlloc+22: 15.92 KBytes worth of outstanding allocations.
iisutil.dll is responsible for 1.97 MBytes worth of outstanding allocations. The following are the top 2 memory consuming functions:
iisutil!ALLOC_CACHE_HANDLER::Alloc+4f: 1.43 MBytes worth of outstanding allocations.
iisutil!BUFFER::ReallocStorage+2e: 530.90 KBytes worth of outstanding allocations.
监控的时间不足,并没有太多的线索,
之后的等待过程中捕获到性能监视器上的一个有意思的现像:如下图所示,那条棕红色的粗线是托管堆中的大对象(LOH)大小,
在它突然升高的同时,virtual bytes(细紫色红线)和private bytes(细黄线)都有增长,但过了一会LOH的大小下来了,virtual bytes并没有明显的下降.
private bytes是有时降,有时不降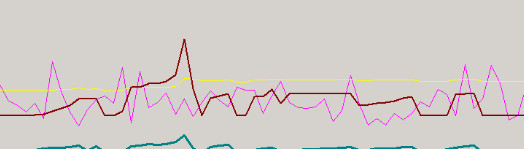
于是在接下来碰到的一次LOH升高时,分别在高点和低点dump了两个文件。
用windbg打开两个dump文件,dumpheap 内容看了一下,字符串方面有较大的区别,
LOH上升前的内容:
790fd8c4 503444 51605012 System.String
7912dae8 5168 61353852 System.Byte[]
LOH上升后的内容:
7912dae8 5833 62697008 System.Byte[]
790fd8c4 558725 67602548 System.String
哈哈,大对象应该出现在system.string中,
0:000> !dumpheap -mt 790fd8c4 -min 1000000
Heap 1
Address MT Size
222a5210 790fd8c4 1738704
3cd30038 790fd8c4 17563672
total 2 objects
居然有一个长达17M的字符串,!do都显示String: <String is invalid or too large to print>
直接du查看
0:000> du 3cd30038 3cd30038 +1000
3cd30038 ".礏..伴g<diffgr:diffgram xmlns:msd"
3cd30078 "ata="urn:schemas-microsoft-com:x"
3cd300b8 "ml-msdata" xmlns:diffgr="urn:sch"
3cd300f8 "emas-microsoft-com:xml-diffgram-"
3cd30138 "v1">.. <NewDataSet>.. <Table"
3cd30178 " diffgr:id="Table1" msdata:rowOr"
3cd301b8 "der="0" diffgr:hasChanges="modif"
3cd301f8 "ied">.. <reser_no>16644349<"
----后面省略一堆内容
随后找到了用这个字符串的代码,大概的原因就是因为程序员直接将一个sql查询的结果绑定在了datagrid上面,
并且这个结果集右能多达几万条数据。
接下来就是信心满满地重现了一个大数据量的业务场景,找一台空闲着的服务器,只要一个人刷新订单查询的页面便重现了问题。至此基本定位问题
再回头看看debugdiag抓到的dump,生成的文件显示如下:
mscorwks.dll (a known Windows memory manager) is responsible for 202.89 MBytes worth of outstanding allocations. These allocations appear to have originated from the following module(s) and function(s):
0x79E7495B
| winhttp.dll is responsible for 71.99 MBytes worth of outstanding allocations. The following are the top 2 memory consuming functions: winhttp!ROCKALL_BACK_END::NewArea+9c: 71.99 MBytes worth of outstanding allocations. |
其中
| Function | mscorwks!EEVirtualAlloc+104 |
| Allocation type | Virtual memory allocation(s) |
| Allocation Count | 79 allocation(s) |
| Allocation Size | 199.56 MBytes |
| Leak Probability | 41% |
|
|
| ||||||||||||||||||||||||||||||||||||||||||||||||||||||||||||||||||||||||||||||||||||||||||||||||||||||||||||||||||||||||||||||||||||||||||||||||||||||||||||||||||||||||||||||||||||||||||||||||||||||||||||||||||||||||||||||||||||||||||||||||||||||||||||||||||||||||||||||||||||||||||||||||||||||||||||||||||
Top 3 allocation sizes by total size
|
|
| ||||||||||||||||||||||||||||||||||||||||||||||||||||||||||||||||||||||||||||||||||||||||||||||||||||||||||||||||||||||||||||||||||||||||||||||||||||||||||||||||||||||||||||||||||||||||||||||||||||||||||||||||||||||||||||||||||||||||||||||||||||||||||||||||||||||||||||||||||||||||||||||||||||||||||||||||||
Call stack sample 1
Address 0x3cd30000
Allocation Time 02:08:39 since tracking started
Allocation Size 32.00 MBytes
Function Source Destination
0x79E7495B kernel32!VirtualAlloc
System.IO.MemoryStream.set_Capacity(Int32) 0x79E756B0
System.IO.MemoryStream.EnsureCapacity(Int32)
System.IO.MemoryStream.WriteByte(Byte) System.IO.MemoryStream.EnsureCapacity(Int32)
System.IO.BinaryWriter.Write(Byte)
System.Web.Util.AltSerialization.WriteValueToStream(System.Object, System.IO.BinaryWriter)
System.Web.SessionState.SessionStateItemCollection.WriteValueToStreamWithAssert(System.Object, System.IO.BinaryWriter) System.Web.Util.AltSerialization.WriteValueToStream(System.Object, System.IO.BinaryWriter)
System.Web.SessionState.SessionStateItemCollection.Serialize(System.IO.BinaryWriter) System.Web.SessionState.SessionStateItemCollection.WriteValueToStreamWithAssert(System.Object, System.IO.BinaryWriter)
System.Web.SessionState.SessionStateUtility.Serialize(System.Web.SessionState.SessionStateStoreData, System.IO.Stream) System.Web.SessionState.SessionStateItemCollection.Serialize(System.IO.BinaryWriter)
System.Web.SessionState.SessionStateUtility.SerializeStoreData(System.Web.SessionState.SessionStateStoreData, Int32, Byte[] ByRef, Int32 ByRef) System.Web.SessionState.SessionStateUtility.Serialize(System.Web.SessionState.SessionStateStoreData, System.IO.Stream)
System.Web.SessionState.SqlSessionStateStore.SetAndReleaseItemExclusive(System.Web.HttpContext, System.String, System.Web.SessionState.SessionStateStoreData, System.Object, Boolean) System.Web.SessionState.SessionStateUtility.SerializeStoreData(System.Web.SessionState.SessionStateStoreData, Int32, Byte[] ByRef, Int32 ByRef)
System.Web.SessionState.SessionStateModule.OnReleaseState(System.Object, System.EventArgs)
System.Web.SessionState.HttpSessionState.set_Item(System.String, System.Object) 0x2A8852A
System.Web.HttpApplication+SyncEventExecutionStep.System.Web.HttpApplication.IExecutionStep.Execute()
System.Web.HttpApplication.System.Web.IHttpAsyncHandler.BeginProcessRequest(System.Web.HttpContext, System.AsyncCallback, System.Object)
0x79F047FD
webengine!HttpCompletion::ProcessRequestInManagedCode+1cb
webengine!HttpCompletion::ProcessRequestInManagedCode+1cb
webengine!HttpCompletion::ProcessCompletion+48 webengine!HttpCompletion::ProcessRequestInManagedCode
webengine!CorThreadPoolWorkitemCallback+1a
0x79F024CF
0x79F0202A
0x79F95A2E
ntdll!ZwTestAlert+15
ntdll!NtContinue+12
ntdll!KiUserApcDispatcher+3a ntdll!NtContinue
kernel32!BaseThreadStart+34
如果此文对您有帮助,转载请保留出处:http://www.cnblogs.com/dbgeng/

 浙公网安备 33010602011771号