


mschart总结:
1. mschart的坐标轴默认类型为decimal,所以不能太大。
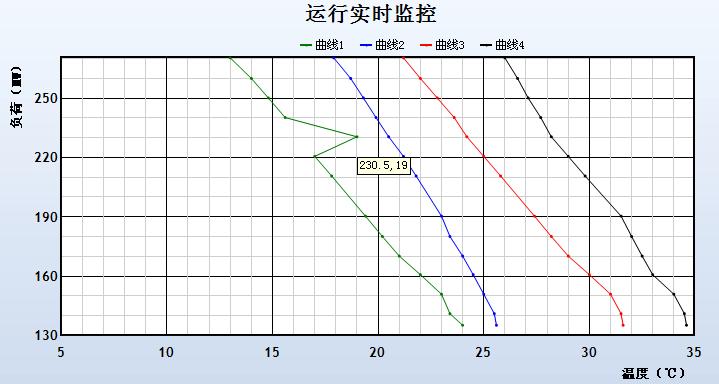
2. 可以为每个点添加提示信息;
/// <summary>
/// 设置点提示信息
/// </summary>
/// <param name="sender"></param>
/// <param name="e"></param>
protected void chartCWPBestMode_PreRender(object sender, EventArgs e)
{
for (int i = 0; i < chartCWPBestMode.Series["Series1"].Points.Count; i++)
{
chartCWPBestMode.Series["Series1"].Points[i].ToolTip = i.ToString();
}
}
3.再每次加载数据时先清空曲线,防止页面刷新后曲线重叠。
chartCWPBestMode.Series["Series1"].Points.Clear();
chartCWPBestMode.Series["Series2"].Points.Clear();
chartCWPBestMode.Series["Series3"].Points.Clear();
chartCWPBestMode.Series["Series4"].Points.Clear();
4.以下是我在做的时候控制样式时用到的方法
/// <summary>
/// 设置mschart样式
/// </summary>
private void SetMSChartStyle()
{
//绘图前期处理
chartCWPBestMode.Titles.Clear();
//标题设置
Title title = new Title();
title.Text = "循环水泵最佳运行方式";
title.Font = new Font("宋体", 16f, FontStyle.Bold);
//标题
chartCWPBestMode.Titles.Add(title);
// 坐标轴设置
chartCWPBestMode.ChartAreas["ChartAreaCWP"].AxisY.IsMarginVisible = false;
//X 轴坐标最大最小值
chartCWPBestMode.ChartAreas["ChartAreaCWP"].AxisX.Minimum = 5;
chartCWPBestMode.ChartAreas["ChartAreaCWP"].AxisX.Maximum = 35;
// 坐标轴刻度线不延长出来设置
chartCWPBestMode.ChartAreas["ChartAreaCWP"].AxisX.MajorTickMark.Enabled = false;
chartCWPBestMode.ChartAreas["ChartAreaCWP"].AxisY.MajorTickMark.Enabled = false;
//X 次要辅助线设置
chartCWPBestMode.ChartAreas["ChartAreaCWP"].AxisX.MinorGrid.Enabled = true;
//X 次要辅助线间距
chartCWPBestMode.ChartAreas["ChartAreaCWP"].AxisX.MinorGrid.Interval = 1;
//X 次要辅助线颜色
chartCWPBestMode.ChartAreas["ChartAreaCWP"].AxisX.MinorGrid.LineColor = Color.LightGray;
//Y 次要辅助线设置
chartCWPBestMode.ChartAreas["ChartAreaCWP"].AxisY.MinorGrid.Enabled = true;
//Y 次要辅助线间距
chartCWPBestMode.ChartAreas["ChartAreaCWP"].AxisY.MinorGrid.Interval = 10;
//Y 次要辅助线颜色
chartCWPBestMode.ChartAreas["ChartAreaCWP"].AxisY.MinorGrid.LineColor = Color.LightGray;
//X 主要辅助线设置
chartCWPBestMode.ChartAreas["ChartAreaCWP"].AxisX.MajorGrid.Enabled = true;
//X 主要辅助线间距
chartCWPBestMode.ChartAreas["ChartAreaCWP"].AxisX.MajorGrid.Interval = 5;
//X 主要辅助线颜色
chartCWPBestMode.ChartAreas["ChartAreaCWP"].AxisX.MajorGrid.LineColor = Color.Black;
//Y 主要辅助线设置
chartCWPBestMode.ChartAreas["ChartAreaCWP"].AxisY.MajorGrid.Enabled = true;
//Y 主要辅助线间距
chartCWPBestMode.ChartAreas["ChartAreaCWP"].AxisY.MajorGrid.Interval = 30;
//Y 主要辅助线颜色
chartCWPBestMode.ChartAreas["ChartAreaCWP"].AxisY.MajorGrid.LineColor = Color.Black;
//坐标主要辅助线刻度间距
chartCWPBestMode.ChartAreas["ChartAreaCWP"].AxisX.Interval = 5;
chartCWPBestMode.ChartAreas["ChartAreaCWP"].AxisY.Interval = 30;
//坐标轴说明
chartCWPBestMode.ChartAreas["ChartAreaCWP"].AxisX.Title = "凝汽器冷却水进口温度(℃)";
chartCWPBestMode.ChartAreas["ChartAreaCWP"].AxisY.Title = "机组负荷(MW)";
chartCWPBestMode.ChartAreas["ChartAreaCWP"].AxisX.TitleFont = new Font("宋体", 10f, FontStyle.Bold);
chartCWPBestMode.ChartAreas["ChartAreaCWP"].AxisY.TitleFont = new Font("宋体", 10f, FontStyle.Bold);
chartCWPBestMode.ChartAreas["ChartAreaCWP"].AxisX.TitleAlignment = StringAlignment.Far;
chartCWPBestMode.ChartAreas["ChartAreaCWP"].AxisY.TitleAlignment = StringAlignment.Far;
//边框样式设置
chartCWPBestMode.ChartAreas["ChartAreaCWP"].BorderColor = Color.Black;
chartCWPBestMode.ChartAreas["ChartAreaCWP"].BorderDashStyle = ChartDashStyle.Solid;
chartCWPBestMode.ChartAreas["ChartAreaCWP"].BorderWidth = 2;
//图例文字
chartCWPBestMode.Series["SeriesCurrentMode"].LegendText = "当前运行方式";
chartCWPBestMode.Series["SeriesTRAN1"].LegendText = "单泵高速切换曲线";
chartCWPBestMode.Series["SeriesTRAN2"].LegendText = "两机三泵切换曲线";
chartCWPBestMode.Series["SeriesTRAN3"].LegendText = "一高一低切换曲线";
chartCWPBestMode.Series["SeriesTRAN4"].LegendText = "两泵高速切换曲线";
//图例位置、字体设置;坐标轴位置设定
chartCWPBestMode.Legends[0].Position = new ElementPosition(10, 10, 88, 7);
chartCWPBestMode.Legends[0].Font = new Font("宋体", 9);
chartCWPBestMode.ChartAreas[0].InnerPlotPosition = new ElementPosition(6, 5, 90, 82);
}
5.附MSChart属性列表
ChartAreas:增加多个绘图区域,每个绘图区域包含独立的图表组、数据源,用于多个图表类型在一个绘图区不兼容时。
AlignmentOrientation:图表区对齐方向,定义两个绘图区域间的对齐方式。
AlignmentStyle:图表区对齐类型,定义图表间用以对其的元素。
AlignWithChartArea:参照对齐的绘图区名称。
InnerPlotPosition:图表在绘图区内的位置属性。
Auto:是否自动对齐。
Height:图表在绘图区内的高度(百分比,取值在0-100)
Width:图表在绘图区内的宽度(百分比,取值在0-100)
X,Y:图表在绘图区内左上角坐标
Position:绘图区位置属性,同InnerPlotPosition。
Name:绘图区名称。
Axis:坐标轴集合
Title:坐标轴标题
TitleAlignment:坐标轴标题对齐方式
Interval:轴刻度间隔大小
IntervalOffset:轴刻度偏移量大小
MinorGrid:次要辅助线
MinorTickMark:次要刻度线
MajorGrid:主要辅助线
MajorTickMark:主要刻度线
DataSourceID:MSChart的数据源。
Legends:图例说明。
Palette:图表外观定义。
Series:最重要的属性,图表集合,就是最终看到的饼图、柱状图、线图、点图等构成的合;可以将多种相互兼容的类型放在一个绘图区域内,形成复合图。
IsValueShownAsLabel:是否显示数据点标签,如果为true,在图表中显示每一个数据值
Label:数据点标签文本
LabelFormat:数据点标签文本格式
LabelAngle:标签字体角度
Name:图表名称
Points:数据点集合
XValueType:横坐标轴类型
YValueType:纵坐标轴类型
XValueMember:横坐标绑定的数据源(如果数据源为Table,则填写横坐标要显示的字段名称)
YValueMembers:纵坐标绑定的数据源(如果数据源为Table,则填写纵坐标要显示的字段名称,纵坐标可以有两个)
ChartArea:图表所属的绘图区域名称
ChartType:图表类型(柱形、饼形、线形、点形等)
Legend:图表使用的图例名称
Titles:标题集合。
width:MSChart的宽度。
height:MSChart的高度。
注意:清空MSchart方法.
如果在同一个页面中显示不同的曲线。在曲线切换时会出现MSchart设置不能正确初始化。
方法是:在HTML中不能写死<ChartAreas>等,必须在程序中动态添加。
如:mschart.Series.Add("1");
mschart.Series.Add("2");
mschart.ChartAreas.Add("11");
使用前必须
mschart.Series.Clear();
mschart.ChartAreas.Clear();
 浙公网安备 33010602011771号