SQLdiag-配置文件-PerfmonCollector
前一篇我们已经使用默认配置文件收集了部分诊断数据,并且知道配置文件会影响收集数据的内容。这一篇我们重点讲述配置文件中与性能计数器相关的操作。
可使用XML模板控制SQLdiag使用的收集器。每个收集器可以使用配置文件的<enabled="true">或<enabled="false">来启用或禁用。使用自己最喜欢的文件编辑器,甚至在支持XML文档编辑的Management Studio中修改XML配置文件。不要从XML文件中删除收集器,因为如果XML文件不能匹配,随后SQLdiag将不能加载XSD。
首先让我们使用SD_Detailed.XML配置文件收集5分钟数据:
cd D:\Program Files\Microsoft SQL Server\100\Tools\Binn\
SQLdiag /I F:\TroubleShooting\SQLdiag\input\SD_Detailed.XML /O F:\TroubleShooting\SQLdiag\LocalOutput  /E +00:05:00
生成的文件如下: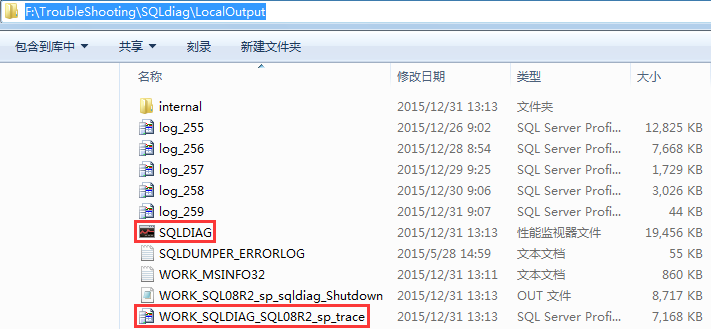
SQLDIAG:收集PerfMon数据,对应PerfmonCollector元素
WORK_SQLDIAG_SQL08R2_sp_trace:收集的跟踪数据,对应ProfilerCollector元素
其他文件的说明见上一篇,在我本地收集5分钟性能监视器文件达到19Mb、跟踪数据文件为7Mb(没有做任何其他操作)。
性能计数器数据,与收集计数器数量、轮询时间间隔有关。与收集时长是线性增长关系。
跟踪数据,与添加的跟踪事件,系统繁忙程度有关。收集的大小可能不成比例地膨胀。
建议在高峰时段短暂地运行SQLdiag约10-15分钟,来估计Profiler跟踪事件的生成率和耗费的磁盘空间。这使你能够在数据被改写之前,对将要捕获的活动的时间跨度形成一个粗略的近似。PerfMon文件并不像Profiler跟踪文件一样迅速地增大。Profiler跟踪收集到目前为止是SQLdiag中最消耗资源的数据收集组件。
PerfmonCollector
虽说收集PerfMon数据的开销相比其他数据收集器是最低的,但也不必要将所有性能计数据器都启用。本节将按照下面步骤测试:
1>禁用EventlogCollector、BlockingCollector、ProfilerCollector、CustomDiagnostics元素收集器;PerfmonCollector、SqldiagCollector元素保持启用
2>参照之前配置的数据收集器模板PerfmonLine启用/禁用PerfmonCollector元素下对应的计数器


<?xml version="1.0" encoding="UTF-16"?> <DataCollectorSet> <Status>1</Status> <Duration>86100</Duration> <Description> </Description> <DescriptionUnresolved> </DescriptionUnresolved> <DisplayName> </DisplayName> <DisplayNameUnresolved> </DisplayNameUnresolved> <SchedulesEnabled>-1</SchedulesEnabled> <LatestOutputLocation>D:\Perfmon\DataCollector</LatestOutputLocation> <Name>PLAYER</Name> <OutputLocation>D:\Perfmon\DataCollector</OutputLocation> <RootPath>D:\Perfmon</RootPath> <Segment>0</Segment> <SegmentMaxDuration>0</SegmentMaxDuration> <SegmentMaxSize>0</SegmentMaxSize> <SerialNumber>15</SerialNumber> <Server> </Server> <Subdirectory>DataCollector</Subdirectory> <SubdirectoryFormat>1</SubdirectoryFormat> <SubdirectoryFormatPattern> </SubdirectoryFormatPattern> <Task> </Task> <TaskRunAsSelf>0</TaskRunAsSelf> <TaskArguments> </TaskArguments> <TaskUserTextArguments> </TaskUserTextArguments> <UserAccount>SYSTEM</UserAccount> <Security>O:BAG:S-1-5-21-2109620463-1702659591-2666464273-513D:AI(A;;FA;;;SY)(A;;FA;;;BA)(A;;FR;;;LU)(A;;0x1301ff;;;S-1-5-80-2661322625-712705077-2999183737-3043590567-590698655)(A;ID;FA;;;SY)(A;ID;FA;;;BA)(A;ID;0x1200ab;;;LU)(A;ID;FR;;;AU)(A;ID;FR;;;LS)(A;ID;FR;;;NS)</Security> <StopOnCompletion>0</StopOnCompletion> <PerformanceCounterDataCollector> <DataCollectorType>0</DataCollectorType> <Name>DataCollector</Name> <FileName>PLAYER</FileName> <FileNameFormat>1</FileNameFormat> <FileNameFormatPattern>\-yyyyMMdd</FileNameFormatPattern> <LogAppend>0</LogAppend> <LogCircular>0</LogCircular> <LogOverwrite>0</LogOverwrite> <LatestOutputLocation>D:\Perfmon\DataCollector\PLAYER-20151105.blg</LatestOutputLocation> <DataSourceName> </DataSourceName> <SampleInterval>30</SampleInterval> <SegmentMaxRecords>0</SegmentMaxRecords> <LogFileFormat>3</LogFileFormat> <Counter>\Memory\Available MBytes</Counter> <Counter>\Memory\Cache Bytes</Counter> <Counter>\Memory\Commit Limit</Counter> <Counter>\Memory\Committed Bytes</Counter> <Counter>\Memory\Free System Page Table Entries</Counter> <Counter>\Memory\Pages Input/sec</Counter> <Counter>\Memory\Pages/sec</Counter> <Counter>\Memory\System Cache Resident Bytes</Counter> <Counter>\MSSQL$PLAYER:Access Methods\FreeSpace Scans/sec</Counter> <Counter>\MSSQL$PLAYER:Access Methods\Full Scans/sec</Counter> <Counter>\MSSQL$PLAYER:Access Methods\Table Lock Escalations/sec</Counter> <Counter>\MSSQL$PLAYER:Access Methods\Worktables Created/sec</Counter> <Counter>\MSSQL$PLAYER:Access Methods\Worktables From Cache Ratio</Counter> <Counter>\MSSQL$PLAYER:Buffer Manager\Buffer cache hit ratio</Counter> <Counter>\MSSQL$PLAYER:Buffer Manager\Checkpoint pages/sec</Counter> <Counter>\MSSQL$PLAYER:Buffer Manager\Database pages</Counter> <Counter>\MSSQL$PLAYER:Buffer Manager\Free list stalls/sec</Counter> <Counter>\MSSQL$PLAYER:Buffer Manager\Free pages</Counter> <Counter>\MSSQL$PLAYER:Buffer Manager\Lazy writes/sec</Counter> <Counter>\MSSQL$PLAYER:Buffer Manager\Page life expectancy</Counter> <Counter>\MSSQL$PLAYER:Buffer Manager\Page lookups/sec</Counter> <Counter>\MSSQL$PLAYER:Buffer Manager\Page reads/sec</Counter> <Counter>\MSSQL$PLAYER:Buffer Manager\Page writes/sec</Counter> <Counter>\MSSQL$PLAYER:Buffer Manager\Readahead pages/sec</Counter> <Counter>\MSSQL$PLAYER:Buffer Manager\Stolen pages</Counter> <Counter>\MSSQL$PLAYER:Buffer Manager\Target pages</Counter> <Counter>\MSSQL$PLAYER:Buffer Manager\Total pages</Counter> <Counter>\MSSQL$PLAYER:Databases(_Total)\Transactions/sec</Counter> <Counter>\MSSQL$PLAYER:General Statistics\Connection Reset/sec</Counter> <Counter>\MSSQL$PLAYER:General Statistics\Logins/sec</Counter> <Counter>\MSSQL$PLAYER:General Statistics\Logouts/sec</Counter> <Counter>\MSSQL$PLAYER:General Statistics\Processes blocked</Counter> <Counter>\MSSQL$PLAYER:General Statistics\User Connections</Counter> <Counter>\MSSQL$PLAYER:Latches\Average Latch Wait Time (ms)</Counter> <Counter>\MSSQL$PLAYER:Latches\Latch Waits/sec</Counter> <Counter>\MSSQL$PLAYER:Latches\Total Latch Wait Time (ms)</Counter> <Counter>\MSSQL$PLAYER:Locks(_Total)\Average Wait Time (ms)</Counter> <Counter>\MSSQL$PLAYER:Locks(_Total)\Lock Requests/sec</Counter> <Counter>\MSSQL$PLAYER:Locks(_Total)\Lock Timeouts (timeout > 0)/sec</Counter> <Counter>\MSSQL$PLAYER:Locks(_Total)\Lock Timeouts/sec</Counter> <Counter>\MSSQL$PLAYER:Locks(_Total)\Lock Wait Time (ms)</Counter> <Counter>\MSSQL$PLAYER:Locks(_Total)\Lock Waits/sec</Counter> <Counter>\MSSQL$PLAYER:Locks(_Total)\Number of Deadlocks/sec</Counter> <Counter>\MSSQL$PLAYER:Memory Manager\Granted Workspace Memory (KB)</Counter> <Counter>\MSSQL$PLAYER:Memory Manager\Maximum Workspace Memory (KB)</Counter> <Counter>\MSSQL$PLAYER:Memory Manager\Memory Grants Outstanding</Counter> <Counter>\MSSQL$PLAYER:Memory Manager\Memory Grants Pending</Counter> <Counter>\MSSQL$PLAYER:Memory Manager\Stolen Server Memory (KB)</Counter> <Counter>\MSSQL$PLAYER:Memory Manager\Target Server Memory (KB)</Counter> <Counter>\MSSQL$PLAYER:Memory Manager\Total Server Memory (KB)</Counter> <Counter>\MSSQL$PLAYER:Plan Cache(_Total)\Cache Hit Ratio</Counter> <Counter>\MSSQL$PLAYER:SQL Statistics\Auto-Param Attempts/sec</Counter> <Counter>\MSSQL$PLAYER:SQL Statistics\Batch Requests/sec</Counter> <Counter>\MSSQL$PLAYER:SQL Statistics\Failed Auto-Params/sec</Counter> <Counter>\MSSQL$PLAYER:SQL Statistics\Safe Auto-Params/sec</Counter> <Counter>\MSSQL$PLAYER:SQL Statistics\SQL Compilations/sec</Counter> <Counter>\MSSQL$PLAYER:SQL Statistics\SQL Re-Compilations/sec</Counter> <Counter>\MSSQL$PLAYER:SQL Statistics\Unsafe Auto-Params/sec</Counter> <Counter>\MSSQL$PLAYER:Transactions\Longest Transaction Running Time</Counter> <Counter>\Network Interface(*)\Bytes Sent/sec</Counter> <Counter>\Paging File(_Total)\% Usage Peak</Counter> <Counter>\Paging File(_Total)\% Usage</Counter> <Counter>\PhysicalDisk(1 D:)\% Idle Time</Counter> <Counter>\PhysicalDisk(1 D:)\Avg. Disk Queue Length</Counter> <Counter>\PhysicalDisk(1 D:)\Avg. Disk sec/Read</Counter> <Counter>\PhysicalDisk(1 D:)\Avg. Disk sec/Transfer</Counter> <Counter>\PhysicalDisk(1 D:)\Avg. Disk sec/Write</Counter> <Counter>\PhysicalDisk(1 D:)\Disk Bytes/sec</Counter> <Counter>\PhysicalDisk(1 D:)\Disk Reads/sec</Counter> <Counter>\PhysicalDisk(1 D:)\Disk Writes/sec</Counter> <Counter>\Process(sqlservr)\% Processor Time</Counter> <Counter>\Process(sqlservr)\Private Bytes</Counter> <Counter>\Process(sqlservr)\% User Time</Counter> <Counter>\Processor(_Total)\% Privileged Time</Counter> <Counter>\Processor(_Total)\% Processor Time</Counter> <Counter>\Processor(_Total)\% User Time</Counter> <Counter>\System\Context Switches/sec</Counter> <Counter>\System\Processor Queue Length</Counter> <CounterDisplayName>\Memory\Available MBytes</CounterDisplayName> <CounterDisplayName>\Memory\Cache Bytes</CounterDisplayName> <CounterDisplayName>\Memory\Commit Limit</CounterDisplayName> <CounterDisplayName>\Memory\Committed Bytes</CounterDisplayName> <CounterDisplayName>\Memory\Free System Page Table Entries</CounterDisplayName> <CounterDisplayName>\Memory\Pages Input/sec</CounterDisplayName> <CounterDisplayName>\Memory\Pages/sec</CounterDisplayName> <CounterDisplayName>\Memory\System Cache Resident Bytes</CounterDisplayName> <CounterDisplayName>\MSSQL$PLAYER:Access Methods\FreeSpace Scans/sec</CounterDisplayName> <CounterDisplayName>\MSSQL$PLAYER:Access Methods\Full Scans/sec</CounterDisplayName> <CounterDisplayName>\MSSQL$PLAYER:Access Methods\Table Lock Escalations/sec</CounterDisplayName> <CounterDisplayName>\MSSQL$PLAYER:Access Methods\Worktables Created/sec</CounterDisplayName> <CounterDisplayName>\MSSQL$PLAYER:Access Methods\Worktables From Cache Ratio</CounterDisplayName> <CounterDisplayName>\MSSQL$PLAYER:Buffer Manager\Buffer cache hit ratio</CounterDisplayName> <CounterDisplayName>\MSSQL$PLAYER:Buffer Manager\Checkpoint pages/sec</CounterDisplayName> <CounterDisplayName>\MSSQL$PLAYER:Buffer Manager\Database pages</CounterDisplayName> <CounterDisplayName>\MSSQL$PLAYER:Buffer Manager\Free list stalls/sec</CounterDisplayName> <CounterDisplayName>\MSSQL$PLAYER:Buffer Manager\Free pages</CounterDisplayName> <CounterDisplayName>\MSSQL$PLAYER:Buffer Manager\Lazy writes/sec</CounterDisplayName> <CounterDisplayName>\MSSQL$PLAYER:Buffer Manager\Page life expectancy</CounterDisplayName> <CounterDisplayName>\MSSQL$PLAYER:Buffer Manager\Page lookups/sec</CounterDisplayName> <CounterDisplayName>\MSSQL$PLAYER:Buffer Manager\Page reads/sec</CounterDisplayName> <CounterDisplayName>\MSSQL$PLAYER:Buffer Manager\Page writes/sec</CounterDisplayName> <CounterDisplayName>\MSSQL$PLAYER:Buffer Manager\Readahead pages/sec</CounterDisplayName> <CounterDisplayName>\MSSQL$PLAYER:Buffer Manager\Stolen pages</CounterDisplayName> <CounterDisplayName>\MSSQL$PLAYER:Buffer Manager\Target pages</CounterDisplayName> <CounterDisplayName>\MSSQL$PLAYER:Buffer Manager\Total pages</CounterDisplayName> <CounterDisplayName>\MSSQL$PLAYER:Databases(_Total)\Transactions/sec</CounterDisplayName> <CounterDisplayName>\MSSQL$PLAYER:General Statistics\Connection Reset/sec</CounterDisplayName> <CounterDisplayName>\MSSQL$PLAYER:General Statistics\Logins/sec</CounterDisplayName> <CounterDisplayName>\MSSQL$PLAYER:General Statistics\Logouts/sec</CounterDisplayName> <CounterDisplayName>\MSSQL$PLAYER:General Statistics\Processes blocked</CounterDisplayName> <CounterDisplayName>\MSSQL$PLAYER:General Statistics\User Connections</CounterDisplayName> <CounterDisplayName>\MSSQL$PLAYER:Latches\Average Latch Wait Time (ms)</CounterDisplayName> <CounterDisplayName>\MSSQL$PLAYER:Latches\Latch Waits/sec</CounterDisplayName> <CounterDisplayName>\MSSQL$PLAYER:Latches\Total Latch Wait Time (ms)</CounterDisplayName> <CounterDisplayName>\MSSQL$PLAYER:Locks(_Total)\Average Wait Time (ms)</CounterDisplayName> <CounterDisplayName>\MSSQL$PLAYER:Locks(_Total)\Lock Requests/sec</CounterDisplayName> <CounterDisplayName>\MSSQL$PLAYER:Locks(_Total)\Lock Timeouts (timeout > 0)/sec</CounterDisplayName> <CounterDisplayName>\MSSQL$PLAYER:Locks(_Total)\Lock Timeouts/sec</CounterDisplayName> <CounterDisplayName>\MSSQL$PLAYER:Locks(_Total)\Lock Wait Time (ms)</CounterDisplayName> <CounterDisplayName>\MSSQL$PLAYER:Locks(_Total)\Lock Waits/sec</CounterDisplayName> <CounterDisplayName>\MSSQL$PLAYER:Locks(_Total)\Number of Deadlocks/sec</CounterDisplayName> <CounterDisplayName>\MSSQL$PLAYER:Memory Manager\Granted Workspace Memory (KB)</CounterDisplayName> <CounterDisplayName>\MSSQL$PLAYER:Memory Manager\Maximum Workspace Memory (KB)</CounterDisplayName> <CounterDisplayName>\MSSQL$PLAYER:Memory Manager\Memory Grants Outstanding</CounterDisplayName> <CounterDisplayName>\MSSQL$PLAYER:Memory Manager\Memory Grants Pending</CounterDisplayName> <CounterDisplayName>\MSSQL$PLAYER:Memory Manager\Stolen Server Memory (KB)</CounterDisplayName> <CounterDisplayName>\MSSQL$PLAYER:Memory Manager\Target Server Memory (KB)</CounterDisplayName> <CounterDisplayName>\MSSQL$PLAYER:Memory Manager\Total Server Memory (KB)</CounterDisplayName> <CounterDisplayName>\MSSQL$PLAYER:Plan Cache(_Total)\Cache Hit Ratio</CounterDisplayName> <CounterDisplayName>\MSSQL$PLAYER:SQL Statistics\Auto-Param Attempts/sec</CounterDisplayName> <CounterDisplayName>\MSSQL$PLAYER:SQL Statistics\Batch Requests/sec</CounterDisplayName> <CounterDisplayName>\MSSQL$PLAYER:SQL Statistics\Failed Auto-Params/sec</CounterDisplayName> <CounterDisplayName>\MSSQL$PLAYER:SQL Statistics\Safe Auto-Params/sec</CounterDisplayName> <CounterDisplayName>\MSSQL$PLAYER:SQL Statistics\SQL Compilations/sec</CounterDisplayName> <CounterDisplayName>\MSSQL$PLAYER:SQL Statistics\SQL Re-Compilations/sec</CounterDisplayName> <CounterDisplayName>\MSSQL$PLAYER:SQL Statistics\Unsafe Auto-Params/sec</CounterDisplayName> <CounterDisplayName>\MSSQL$PLAYER:Transactions\Longest Transaction Running Time</CounterDisplayName> <CounterDisplayName>\Network Interface(*)\Bytes Sent/sec</CounterDisplayName> <CounterDisplayName>\Paging File(_Total)\% Usage Peak</CounterDisplayName> <CounterDisplayName>\Paging File(_Total)\% Usage</CounterDisplayName> <CounterDisplayName>\PhysicalDisk(1 D:)\% Idle Time</CounterDisplayName> <CounterDisplayName>\PhysicalDisk(1 D:)\Avg. Disk Queue Length</CounterDisplayName> <CounterDisplayName>\PhysicalDisk(1 D:)\Avg. Disk sec/Read</CounterDisplayName> <CounterDisplayName>\PhysicalDisk(1 D:)\Avg. Disk sec/Transfer</CounterDisplayName> <CounterDisplayName>\PhysicalDisk(1 D:)\Avg. Disk sec/Write</CounterDisplayName> <CounterDisplayName>\PhysicalDisk(1 D:)\Disk Bytes/sec</CounterDisplayName> <CounterDisplayName>\PhysicalDisk(1 D:)\Disk Reads/sec</CounterDisplayName> <CounterDisplayName>\PhysicalDisk(1 D:)\Disk Writes/sec</CounterDisplayName> <CounterDisplayName>\Process(sqlservr)\% Processor Time</CounterDisplayName> <CounterDisplayName>\Process(sqlservr)\Private Bytes</CounterDisplayName> <CounterDisplayName>\Process(sqlservr)\% User Time</CounterDisplayName> <CounterDisplayName>\Processor(_Total)\% Privileged Time</CounterDisplayName> <CounterDisplayName>\Processor(_Total)\% Processor Time</CounterDisplayName> <CounterDisplayName>\Processor(_Total)\% User Time</CounterDisplayName> <CounterDisplayName>\System\Context Switches/sec</CounterDisplayName> <CounterDisplayName>\System\Processor Queue Length</CounterDisplayName> </PerformanceCounterDataCollector> <Schedule> <StartDate>5/20/2015</StartDate> <EndDate>11/14/2015</EndDate> <StartTime>9:30:00 AM</StartTime> <Days>127</Days> </Schedule> <DataManager> <Enabled>0</Enabled> <CheckBeforeRunning>0</CheckBeforeRunning> <MinFreeDisk>0</MinFreeDisk> <MaxSize>0</MaxSize> <MaxFolderCount>0</MaxFolderCount> <ResourcePolicy>0</ResourcePolicy> <ReportFileName>report.html</ReportFileName> <RuleTargetFileName>report.xml</RuleTargetFileName> <EventsFileName> </EventsFileName> </DataManager> </DataCollectorSet>
注意对象下有多实例的情况,比如<PerfmonObject name="\Processor(*)" enabled="true">
它会收集Processor对象下指定计数器中所有实例的信息(包含_Total);在对象上的enabled="false"并不能禁用其下计数器的收集,必须显示在PerfmonCollector元素层或者底层计数器设置enabled="false"
很难一次将所有计数器调整成PerfmonLine模板所配置的,只有修改后让其收集性能计数器,然后查看收集的数据,如此反复几次。修改后收集的数据如下,图形中可能不会呈现出所有收集的计数器,我们可以右击将其他可用的计数器添加到面板。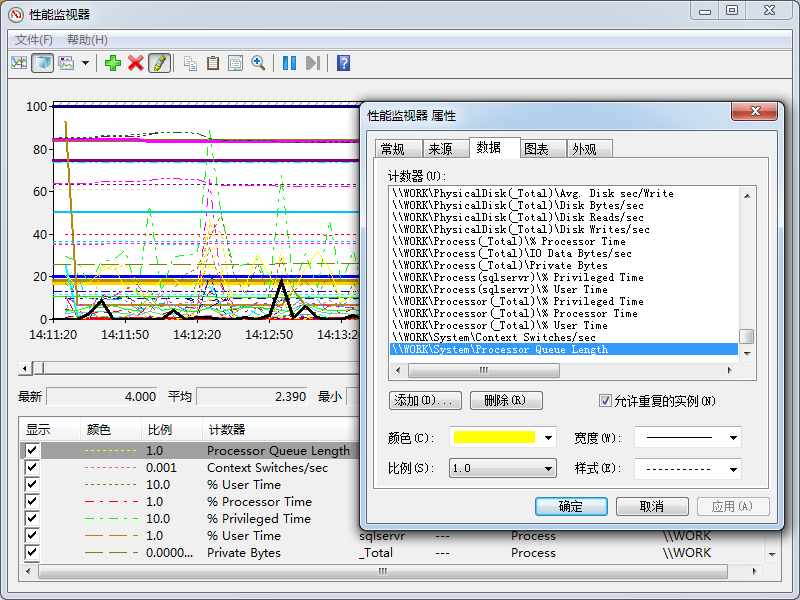
测试禁用对象<PerfmonObject name="\LogicalDisk(*)" enabled="false">,但其下的部分计数器是开启的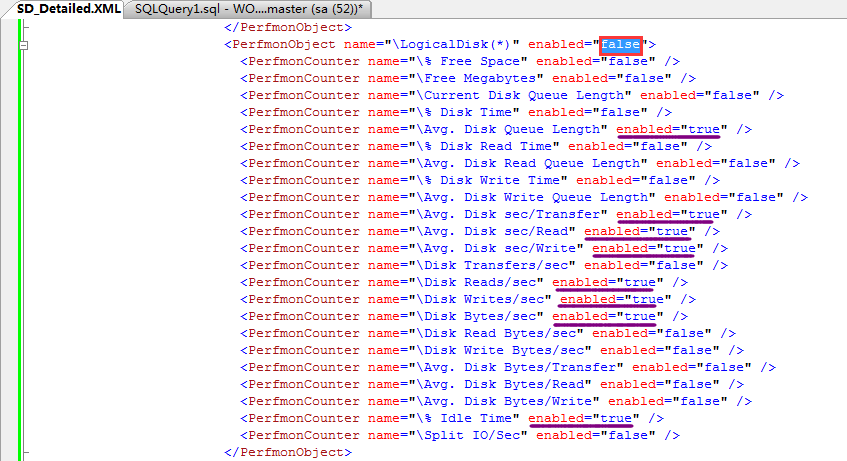
我们查看收集到的数据中还是有对应计数器,难道启用/禁用只有在顶层元素设置才会对其下的对象有影响?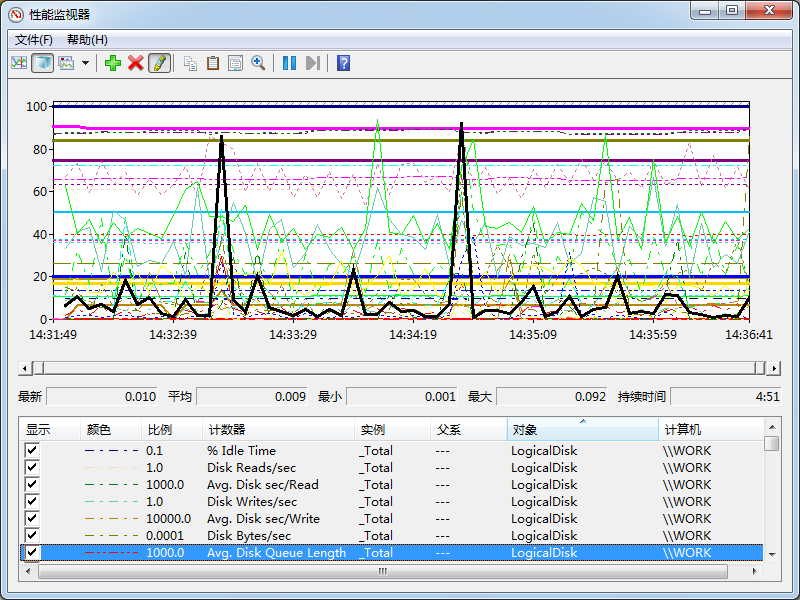
结合SQL Nexus完善PerfmonCollector的收集
我们使用sqlnexus导入收集的SQLdiag数据,我们主要查看Perfmon Summary,点击Perfmon Summary出现的页面几乎没数据!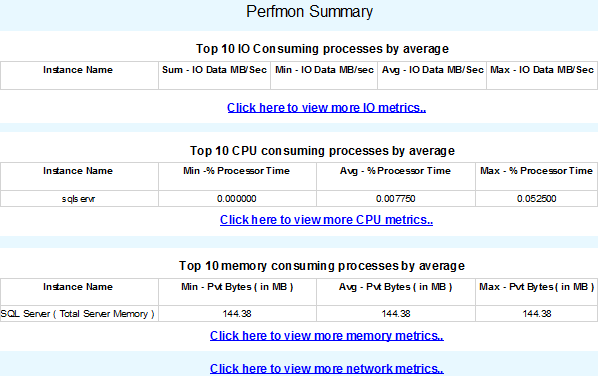
是否还记得我们在RML中有使用Proflier,查看RML所调用的过程/语句。此处我们也利用Proflier监控sqlnexus所调用的过程/语句(跟踪添加筛选器ApplicationName类似于sqlnexus)
我们重新点击Perfmon Summary,在Proflier跟踪下看到如下信息: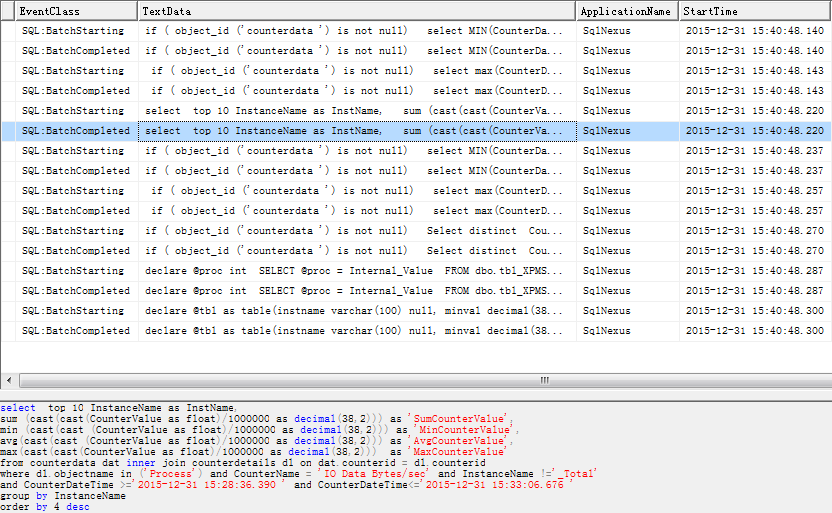
查看详细代码可知IO、CPU、Memory是来自下面计数器
<Counter>\Process(*)\IO Data Bytes/sec</Counter>
<Counter>\Process(*)\% Processor Time</Counter>
<Counter>\Process(*)\Private Bytes</Counter>
而这些计数器刚好没有收集(仅仅收集Process(sqlservr)一个实例)
点击 Click here to view more IO metrics..没有数据: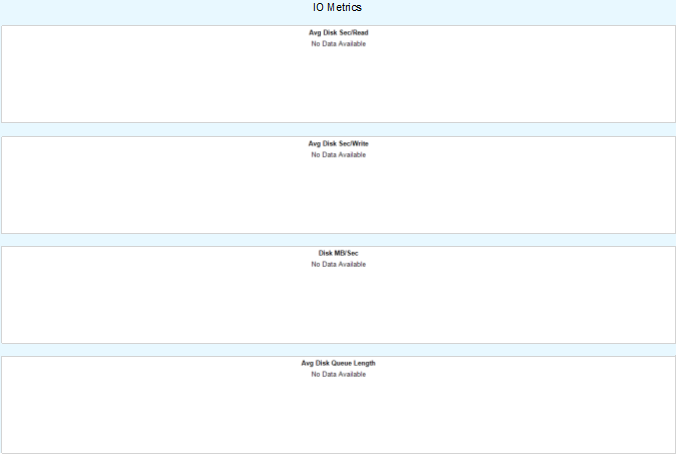
查看Proflier跟踪下看到如下信息: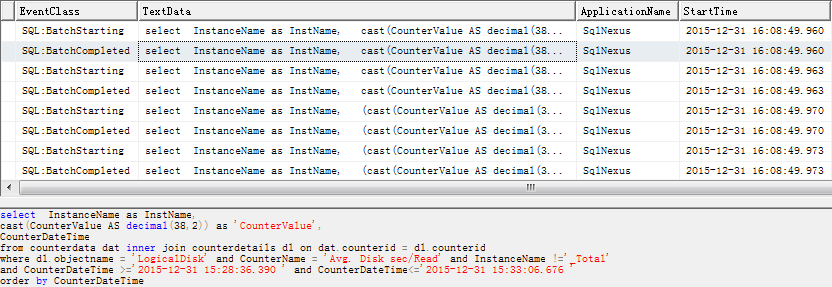
查看详细代码可知IO详细信息是来自下面计数器
<Counter>\LogicalDisk(*)\Avg. Disk sec/Read</Counter>
<Counter>\LogicalDisk(*)\Avg. Disk sec/Write</Counter>
<Counter>\LogicalDisk(*)\Disk Bytes/sec</Counter>
<Counter>\LogicalDisk(*)\Avg. Disk Queue Length</Counter>
点击Click here to view more CPU/Memory metrics..报错
查看Proflier跟踪下看到如下信息: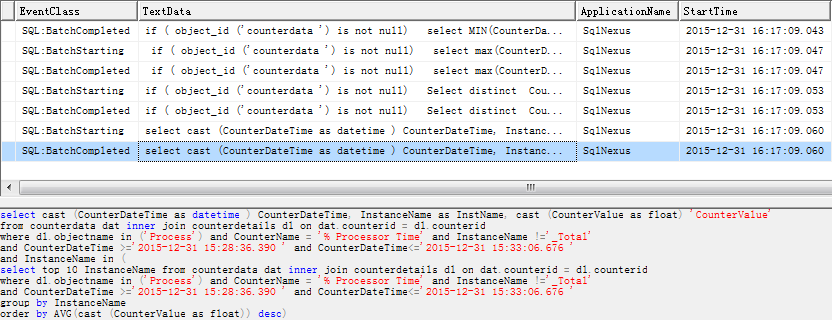
单独取语句到查询窗口执行,报错“从字符串转换日期和/或时间时,转换失败。”但将CounterDateTime截取再转就可以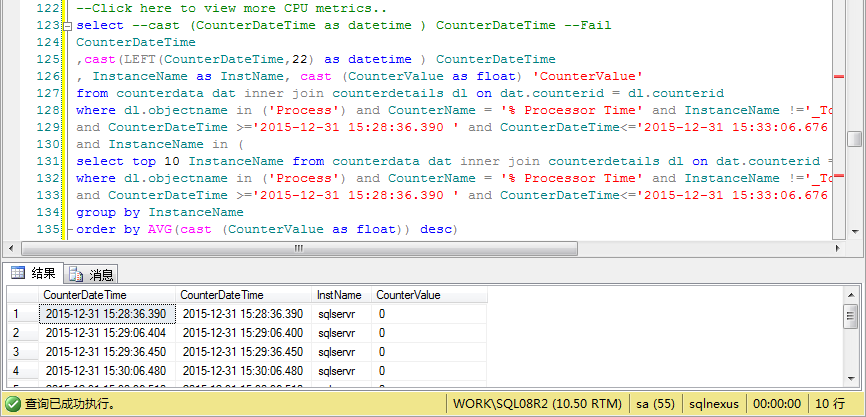
点击 Click here to view more Network metrics..没有数据:
查看Proflier跟踪下看到如下信息: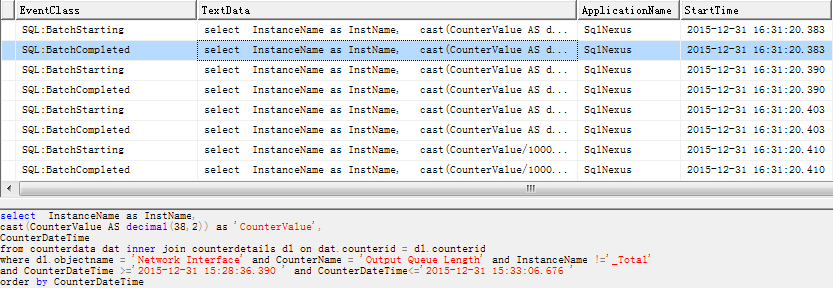
查看详细代码可知NetWork详细信息是来自下面计数器
<Counter>\Network Interface(*)\Output Queue Length</Counter>
<Counter>\Network Interface(*)\Packets Received Discarded</Counter>
<Counter>\Network Interface(*)\Packets Outbound Discarded</Counter>
<Counter>\Network Interface(*)\Bytes Total/Sec</Counter>
针对上面的问题,解决方案如下:
1>将上面列出的Process(*)、LogicalDisk(*)、Network Interface(*)相关计数器启用
2>使用如下语句更新CounterData中的CounterDateTime字段
USE sqlnexus
GO
UPDATE CounterData SET
CounterDateTime=LEFT(CounterDateTime,22)
导入数据时有跟踪到创建counterdata的脚本,但没找到原始建表语句保存在哪。另外在sqlnexus应用程序目录的PerfStatsAnalysis.sql文件中有对CounterData表的alter/update语句...
以上问题修正后,再次收集数据用sqlnexus工具查看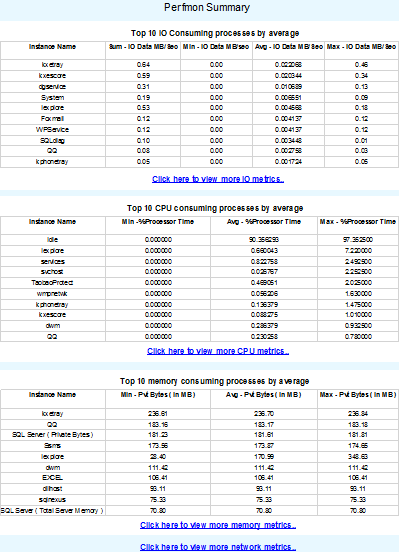
Perfmon Summary总界面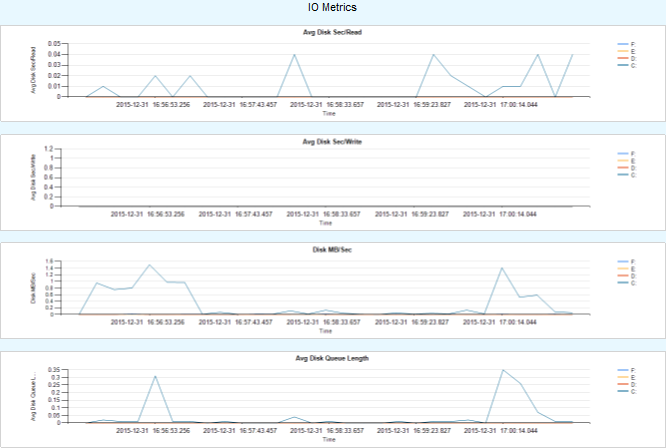
IO metrics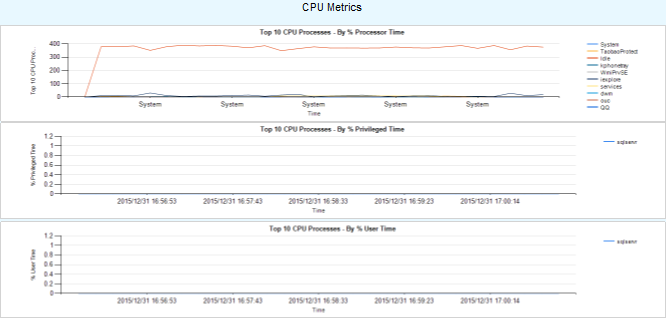
CPU metrics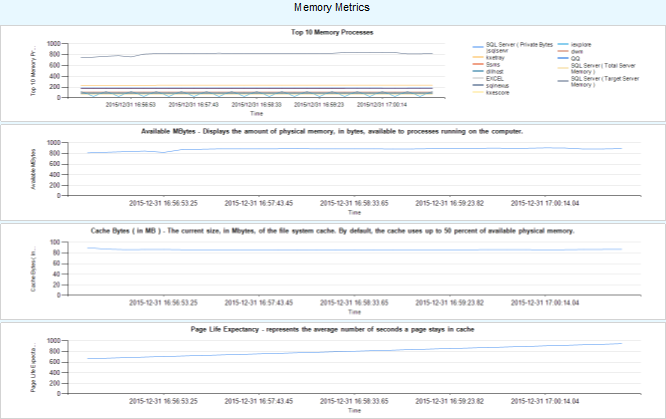
Memory metrics
NetWork metrics
我们可以针对每个图形跟踪其涉及的数据,并最终定位来自哪些计数器。如果已经启用相应的计数器,但是在图形中没有看到,就要查看展现的语句是如何处理的,sqlnexus会对部分数值进行单位换算(类似RML中的Scale)。当前SD_Detailed.XML配置文件的PerfmonCollector元素部分可参考文件链接对应部分。
|
|
【作者】: 醒嘞 |
| 【出处】: http://www.cnblogs.com/Uest/ | |
| 【声明】: 本文内容仅代表个人观点。如需转载请保留此段声明,且在文章页面明显位置给出原文链接! |

 浙公网安备 33010602011771号