
python+matplotlib+绘制不同图标类型
#==================================================================
#首先需要导入两个文件
import matplotlib.pyplot as plt
import numpy as np
#==================================================================
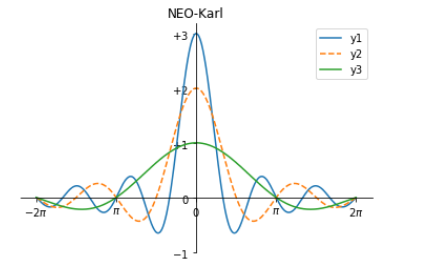
 1 #==================================================================
 2 #首先需要导入两个文件
 3 import  matplotlib.pyplot as plt
 4 import  numpy as np
 5 #==================================================================
 6 #绘制线性图
 7 x = np.arange(-2*np.pi,2*np.pi,0.01)#定义横轴范围(-2pi 2pi)
 8 y = np.sin(3*x)/x#函数
 9 y2 = np.sin(2*x)/x
10 y3 = np.sin(x)/x
11 plt.plot(x,y)#绘制,matplotlib默认展示不同的颜色
12 plt.plot(x,y2,'--')
13 plt.plot(x,y3)
14 plt.xticks([-2*np.pi,-np.pi,0,np.pi,2*np.pi],[r'$-2\pi$',r'$\pi$','$0$','$\pi$','$2\pi$'])#显示横坐标刻度值,不加第二个参数,将显示的是数值而不是字母
15 plt.yticks([-1,0,1,2,3],[r'$-1$','$0$','$+1$','$+2$','$+3$'])
16 plt.legend(['y1','y2','y3'])
17 plt.title('NEO-Karl')
18 plt.show()
运行结果:

 1 #将坐标轴移到中间,即笛卡尔坐标轴。
 2 # 路径:将图形上,右边隐藏,将下,左边移动到中间,需要用到gac函数获取Axes对象
 3 # 接着通过这个对象指定每条边的位置,使用set_color设置成none。实现代码如下:
 4 x = np.arange(-2*np.pi,2*np.pi,0.01)#定义横轴范围
 5 y = np.sin(3*x)/x#函数
 6 y2 = np.sin(2*x)/x
 7 y3 = np.sin(x)/x
 8 plt.plot(x,y)#绘制,matplotlib默认展示不同的颜色
 9 plt.plot(x,y2,'--')
10 plt.plot(x,y3)
11 plt.xticks([-2*np.pi,-np.pi,0,np.pi,2*np.pi],[r'$-2\pi$',r'$\pi$','$0$','$\pi$','$2\pi$'])#显示横坐标刻度值,不加第二个参数,将显示的是数值而不是字母
12 plt.yticks([-1,0,1,2,3],[r'$-1$','$0$','$+1$','$+2$','$+3$'])
13 plt.legend(['y1','y2','y3'])
14 plt.title('NEO-Karl')
15 ax = plt.gca()#使用gca函数获取axes对象
16 ax.spines['right'].set_color('none')#右侧边隐藏
17 ax.spines['top'].set_color('none')
18 ax.xaxis.set_ticks_position('bottom')#将底边设为横坐标
19 ax.spines['bottom'].set_position(('data',0))#将坐标置于坐标0处
20 ax.yaxis.set_ticks_position('left')#左边设置为纵坐标
21 ax.spines['left'].set_position(('data',0))
22 plt.show()
运行结果:
 1 x = np.arange(-2*np.pi,2*np.pi,0.01)#定义横轴范围
 2 y = np.sin(3*x)/x#函数
 3 y2 = np.sin(2*x)/x
 4 y3 = np.sin(x)/x
 5 plt.plot(x,y)#绘制,matplotlib默认展示不同的颜色
 6 plt.plot(x,y2,'--')
 7 plt.plot(x,y3)
 8 plt.xticks([-2*np.pi,-np.pi,0,np.pi,2*np.pi],[r'$-2\pi$',r'$\pi$','$0$','$\pi$','$2\pi$'])#显示横坐标刻度值,不加第二个参数,将显示的是数值而不是字母
 9 plt.yticks([-1,0,1,2,3],[r'$-1$','$0$','$+1$','$+2$','$+3$'])
10 plt.legend(['y1','y2','y3'])
11 plt.title('NEO-Karl')
12 #添加注释,使用annotate函数,第一个参数为:latex表达式,即要现实的字符,xy是注释在图表的数据点位置,xytext表示注释与数据点距离,textcoords='offset points'似乎是必须选?使用arrowprops控制箭头
13 plt.annotate(r'$\lim_{x\to 0}\frac{\sin(x)}{x}=1$',xy=[0,1],xytext=[30,30],fontsize=16,textcoords='offset points',arrowprops=dict(arrowstyle='->',connectionstyle='arc3,rad=.2'))
14 ax = plt.gca()#使用gca函数获取axes对象
15 ax.spines['right'].set_color('none')#右侧边隐藏
16 ax.spines['top'].set_color('none')
17 ax.xaxis.set_ticks_position('bottom')#将底边设为横坐标
18 ax.spines['bottom'].set_position(('data',0))#将坐标置于坐标0处
19 ax.yaxis.set_ticks_position('left')#左边设置为纵坐标
20 ax.spines['left'].set_position(('data',0))
21 plt.show()
运行结果:

你若不肯低头,谁能为你戴上桂冠

