

软件: MatlabR2014a CodeBlock
1.新建个工程
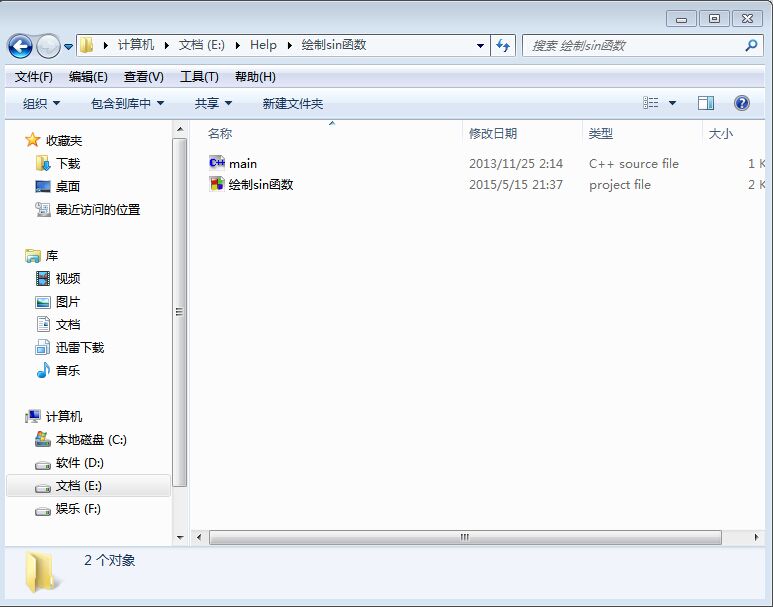
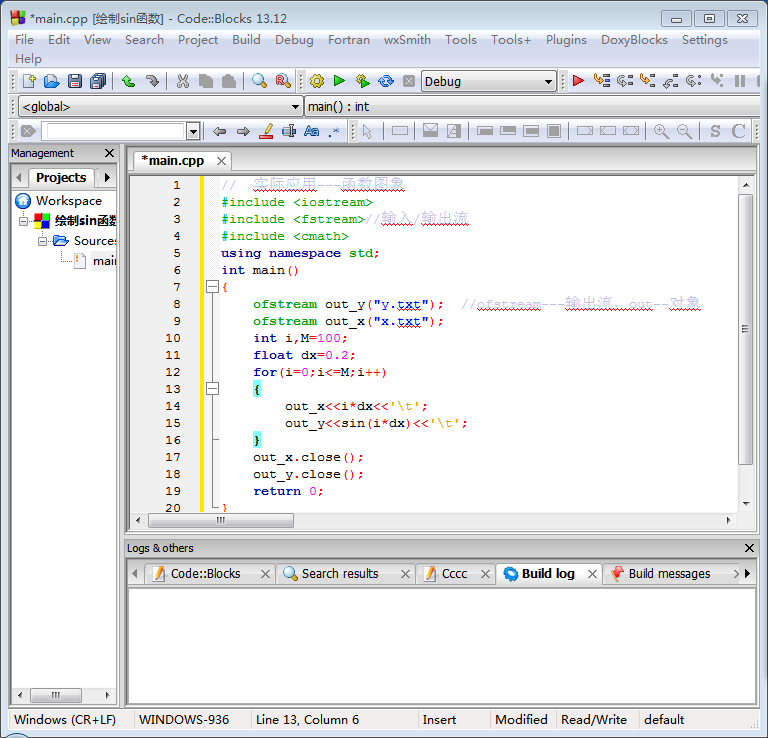
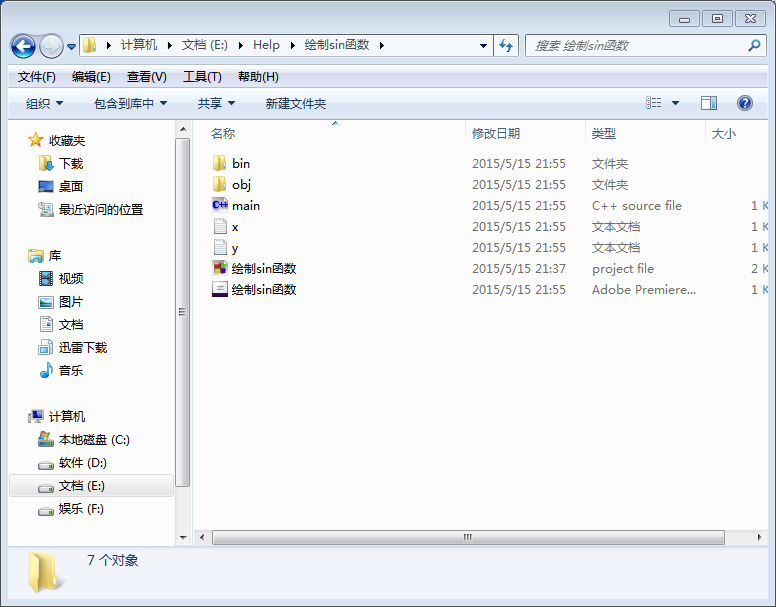
2.输入程序,求得坐标并保存到txt文件中
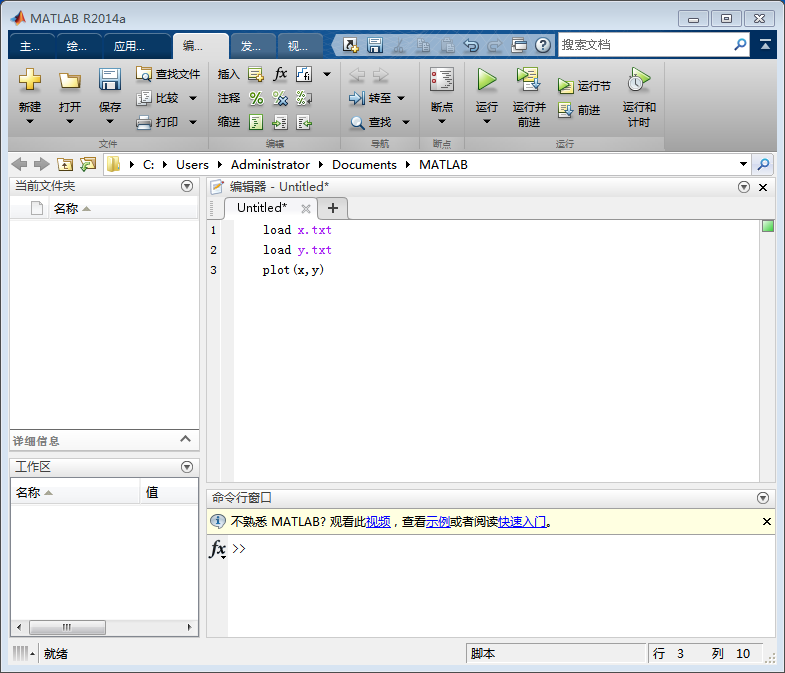
3.用MATLAB建个M文件
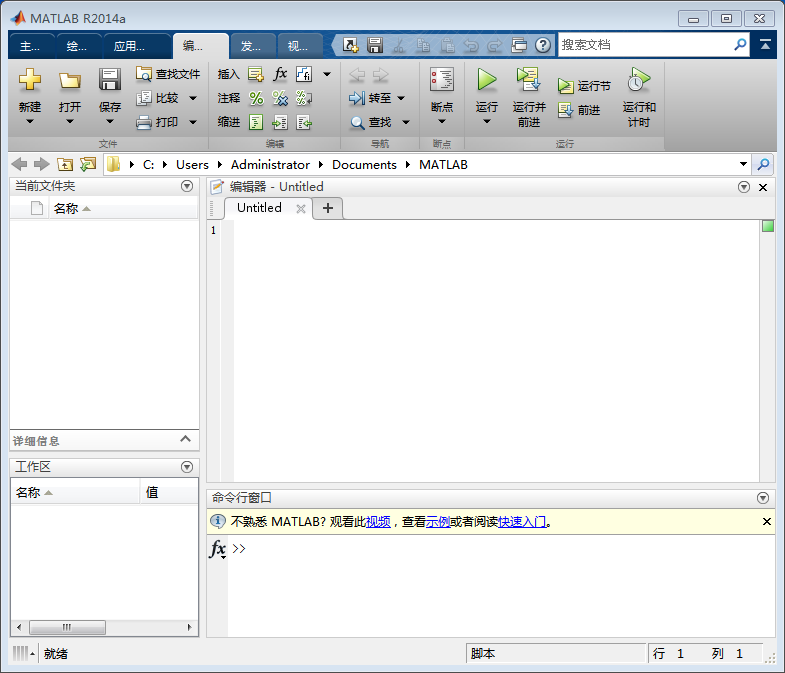
4.输入绘图代码,如图
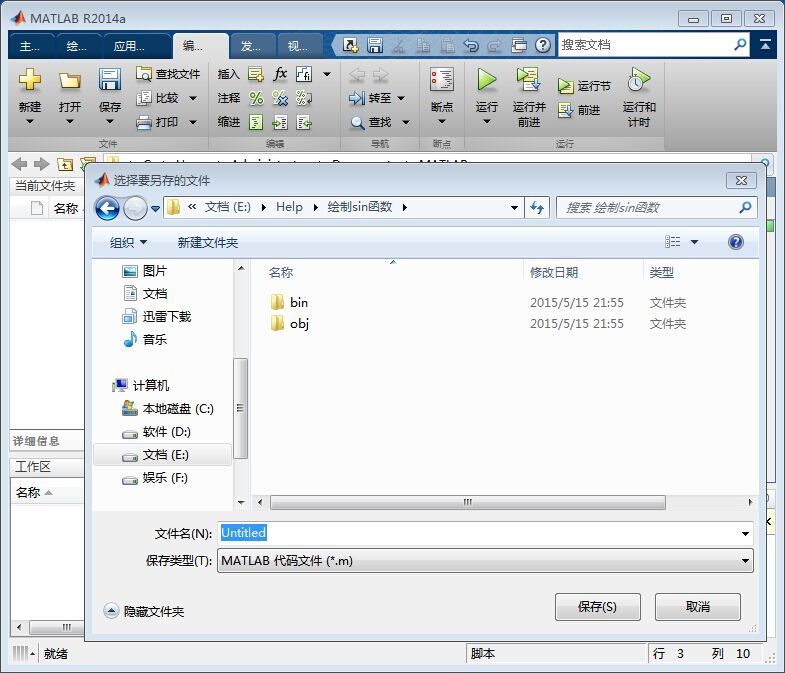
5.点击运行,M文件保存在新建工程所在的文件夹下
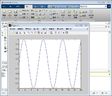
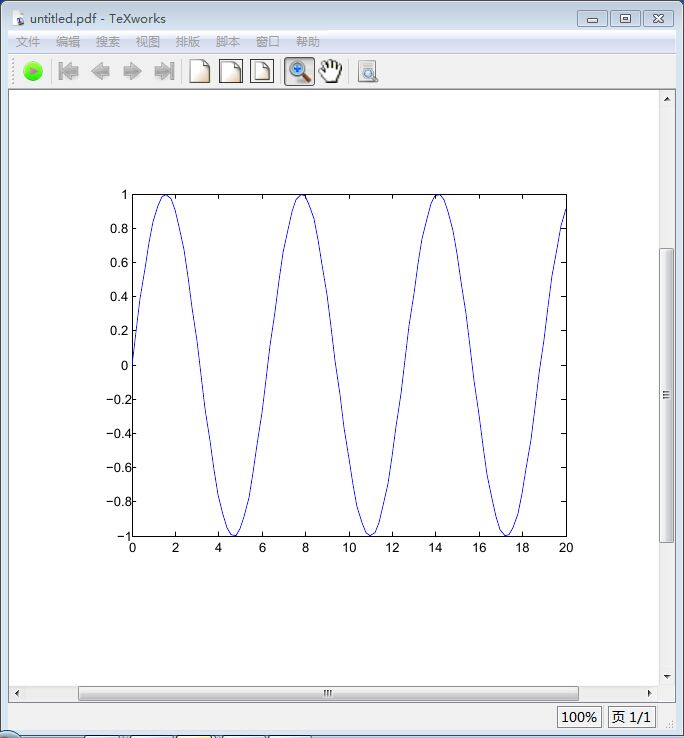
6.绘图完成
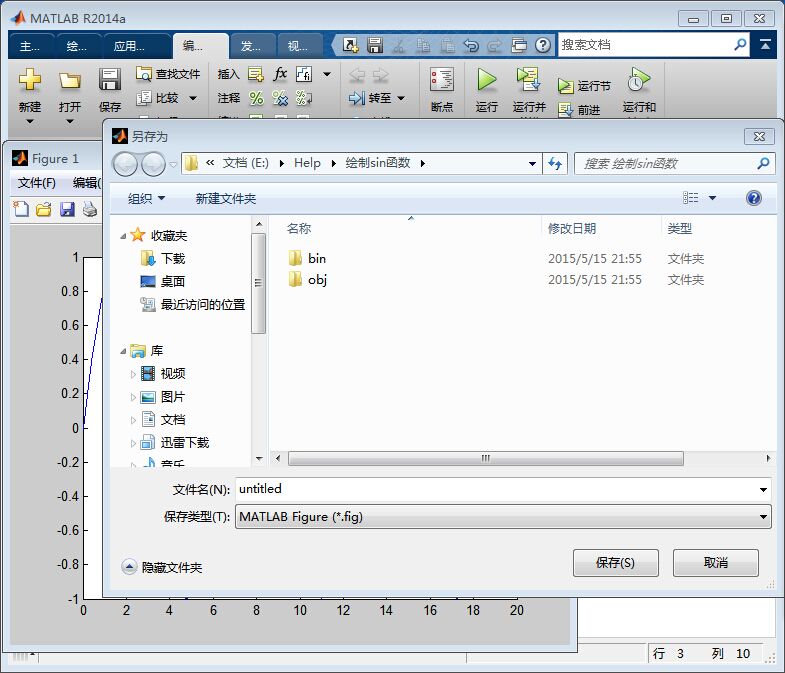
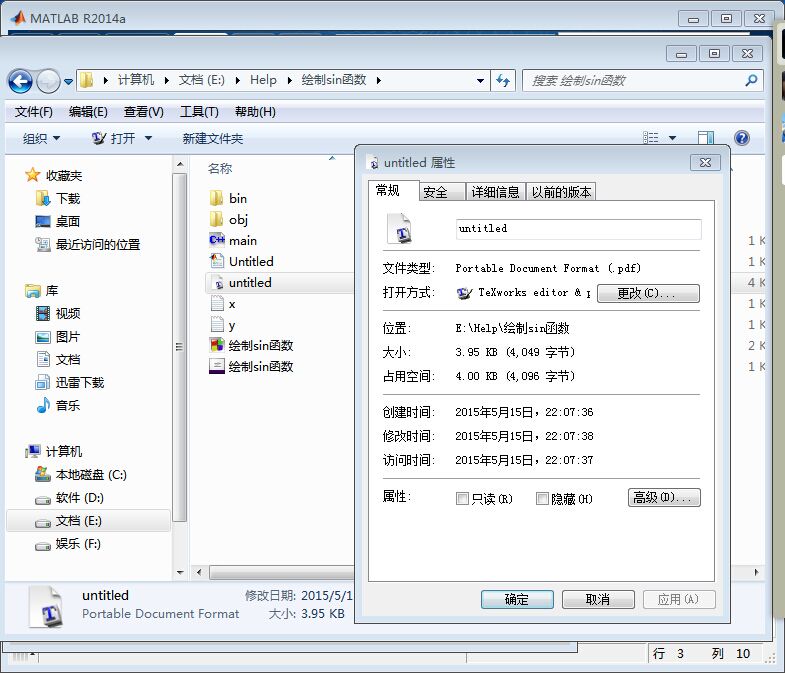
7.如果想把图像以其他格式保存,则点击文件->另存为,选择保存类型,这里选择pdf格式,如图所示,这就是保存下来的图像。
总结: 本来很简单的东西,上课听了之后没动手实践,同学一问发现自己根本没记住,-_-#
自己好好反思一下吧。
cpp源代码:
//  实际应用---函数图象
#include <iostream>
#include <fstream>//输入/输出流
#include <cmath>
using namespace std;
int main()
{
	ofstream out_y("y.txt");  //ofstream---输出流,out--对象
	ofstream out_x("x.txt");
	int i,M=100;
	float dx=0.2;
	for(i=0;i<=M;i++)
	{
		out_x<<i*dx<<'\t';
		out_y<<sin(i*dx)<<'\t';
	}
	out_x.close();
	out_y.close();
	return 0;
}
Matlab代码:
load x.txt
load y.txt
plot(x,y)
