
Echarts柱状图实现不同颜色渐变色
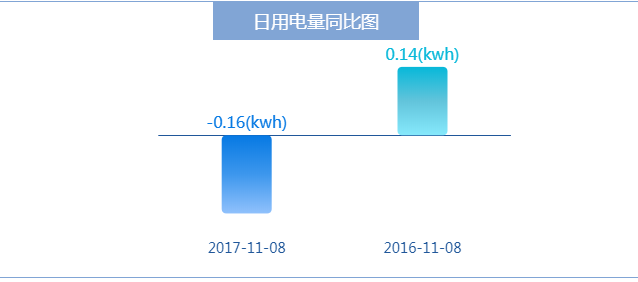
第一次写文,只是想记录一下自己平时发现的小功能,这篇主要是实现echarts柱状图,每个柱子实现不同颜色的渐变色,也是第一次接触echarts,后台使用ssm,前台是extjs,直接上效果图
直接上js代码
var option={
  title:{//柱状图标题的样式设置
    text:"日用电量同比图",
    x : 'center',
    backgroundColor: '#81a5d5',
    textStyle: {
      color:'#fff'
    },
    padding:[10,40,10,40]
  },
  xAxis :{
    type: 'category',
    data:xdata,//数据是后台传过来 ["2017-11-08", "2016-11-08"]
    axisLabel:{//字体样式
      show: true,
      textStyle: {
        color:'#20579a',
        fontWeight : 300 ,
        fontSize : 14 //文字的字体大小
      }
    },
    axisLine: {//x轴线的样式
      lineStyle: {
        type: 'solid',
        color: '#20579a',//线的颜色
        width:'1'//坐标线的宽度
      }
    },
    axisTick : { //取消刻度线
      show : false
    },
  },
  yAxis :{
    type:'value',
    show:false,
  },
  series:
    {
      name:'日用电量',
      type:'bar',//不同类型的图,值不一样
      smooth: true,
      barWidth:50,
      data:data,//也是后台数据传来 ["-0.16", "0.14"]
      itemStyle:{
        normal:{
          //每个柱子的颜色即为colorList数组里的每一项,如果柱子数目多于colorList的长度,则柱子颜色循环使用该数组
          color: function (params){

            //我这边就两个柱子,大体就两个柱子颜色渐变,所以数组只有两个值,多个颜色就多个值
            var colorList = [

                    ['#0679e3','#3d97ed','#90c1fc'],

                    ['#07b8d9','#62c4db','#86e9fc']

                   ];

                              var index=params.dataIndex;
                              if(params.dataIndex >= colorList.length){
                                      index=params.dataIndex-colorList.length;
                               }

                  return new echarts.graphic.LinearGradient(0, 0, 0, 1,
                  [
                     {offset: 0, color: colorList[index][0]},
                     {offset: 0.5, color: colorList[index][1]},
                     {offset: 1, color: colorList[index][2]}
                  ]);
          },
          barBorderRadius: 5  //柱状角成椭圆形
        },

    }
  },
  label: { //标签,柱状图显示的文字
    normal: {
      show: true, //默认为不显示
      position: 'top', //默认显示在内部,当为0时,影响视觉
      formatter:'{c}(kwh)'  //文字显示的格式
    }
  },
  textStyle: { //显示文字的样式
    color:function(params){
      var colorList = ['#0679e3','#07b8d9'];//每个柱子上的字体颜色不一样
      return colorList[params.dataIndex];
    },
    fontWeight : 300 ,
    fontSize : 16 //文字的字体大小
  },
  grid: { //柱状图与容器之间的位置分布
    left: '20%',
    right: '20%',
    bottom: '8%',
    containLabel: true
  }

};
this.chart.setOption(option);
又要凑字数了,感谢有些同学给我提的问题,以后还是要自己注意,不能把错误代码上传,不负责任


