XAF实现交叉分析
如何实现如图的交叉分析?
In this lesson, you will learn how to add the Analysis functionality to your application. For this purpose, you will add the Analysis business class and the Pivot Chart Module to your application.
-
Add the Analysis business class to your MySolution.Module project using the Module Designer. If you are using Entity Framework as your ORM, register the Analysis type in DbContext. Edit the BusinessObjects\MySolutionDbContext.cs (MySolutionDbContext.vb) as follows and then rebuild the solution.
public class MySolutionDbContext : DbContext {

    public DbSet<Analysis> Analysis { get; set; }
}
-
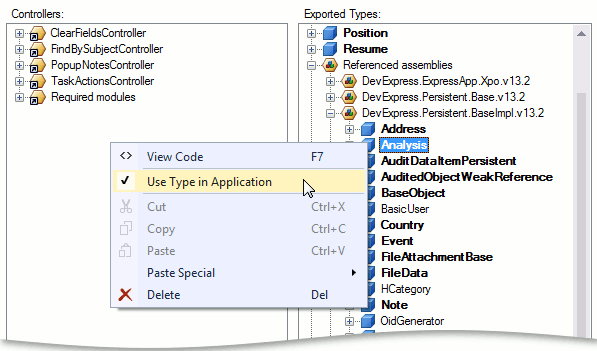
Invoke it by double-clicking the Module.cs (Module.vb) file within the MySolution.Module project displayed in the Solution Explorer. In the Exported Types section, locate the Referenced Assemblies | DevExpress.Persistent.BaseImpl.v16.1 (DevExpress.Persistent.BaseImpl.EF.v16.1) | Analysis node. Select it and press the Spacebar, or right-click it and choose Use Type in Application in the invoked menu. The node will be marked in bold. This means that the Analysis business class will be added to the Application Model, and this class will take part in the UI construction process.
-
- Rebuild your solution so that the changes made in the Designer are loaded to the Application Model.
-
The eXpressApp Framework provides the Pivot Chart Module. When this module is referenced, the Self property of the Analysis Detail View is displayed via a special Property Editor. In WinForms applications, this Property Editor uses the PivotGridControl supplied by the Pivot Grid library and the ChartControl from the Chart Control library. In ASP.NET applications, this Property Editor uses the ASP.NET Pivot Grid that is supplied by the ASP.NET Pivot Grid library, and the WebChartControl from the Chart Control library. These controls allow end-users to build summarized reports to analyze large quantities of data quickly and easily. Features like filtering, top value display, hierarchical value arrangement on the axes, and grand and group totals give end-users a wide range of tools to control the data level in detail.
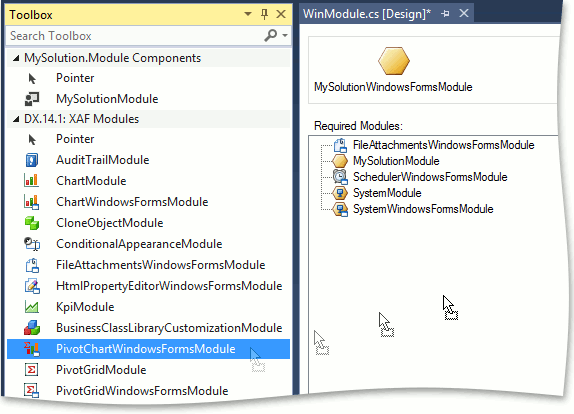
To use the Pivot Chart Module in a WinForms application, add it to the WinForms module project. For this purpose, find the WinModule.cs (WinModule.vb) file in the MySolution.Module.Win project displayed in the Solution Explorer. Double-click this file. The Module Designer will be invoked. In the Toolbox, navigate to the DX.16.1: XAF Modules page. Drag the PivotChartWindowsFormsModule item to the Designer's Required Modules section. Build the project.
-
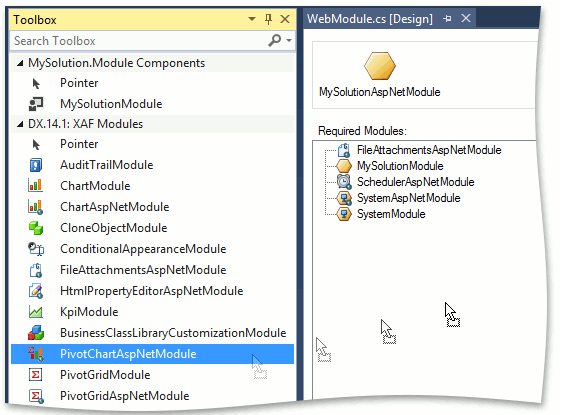
To use the Pivot Chart Module in the ASP.NET application, add it to the ASP.NET module project. For this purpose, double-click the WebModule.cs (WebModule.vb) file, located in the MySolution.Module.Web application project. The Module Designer will be invoked. In the Toolbox, navigate to the DX.16.1: XAF Modules tab, and drag the PivotChartAspNetModule item to the Designer's Required Modules section. Build the project.
-
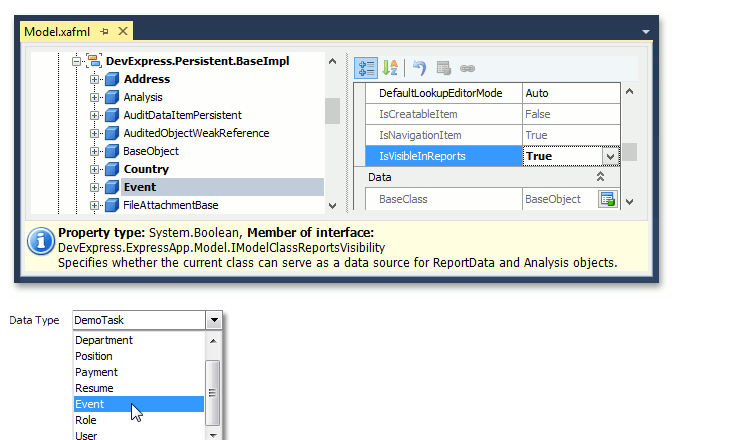
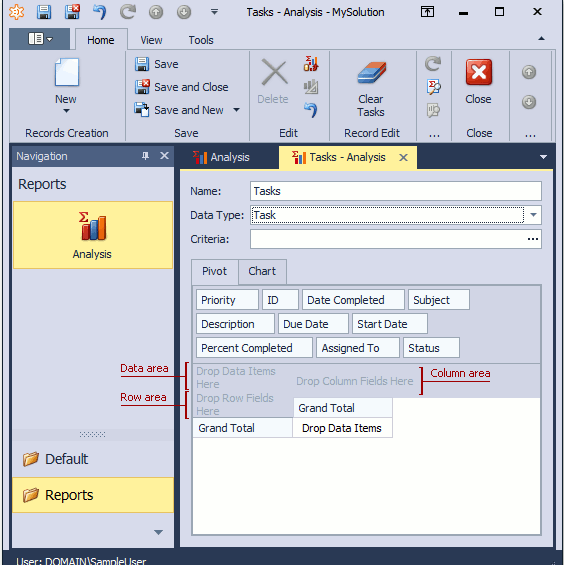
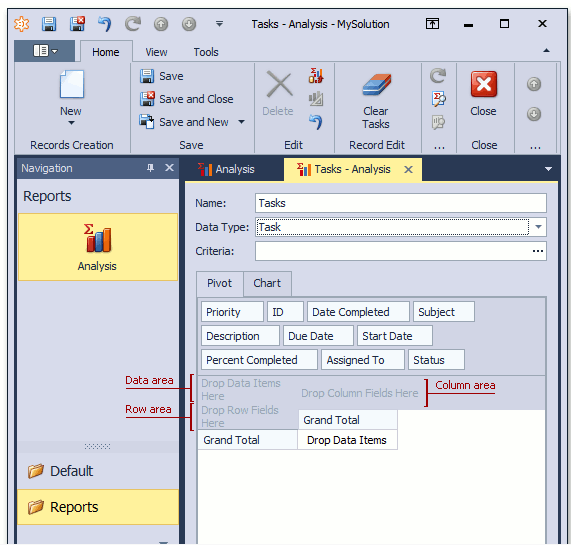
Run the WinForms or ASP.NET application. In the navigation control, select the Reports | Analysis item. An empty Analysis object list will be displayed (called Analysis List View). Create a new Analysis object by clicking the New button. In the invoked Detail View, specify a name for the new Analysis object and the type of objects to be analyzed via a pivot grid and chart control. For instance, assign the "Tasks" value to the Name property and choose "Task" in the Data Type drop-down menu. Click Bind Analysis Data (
). Task objects will be loaded as the data source for the pivot grid.
注意:这时候默认自己做的实体不会出现在分析下拉列表里面。
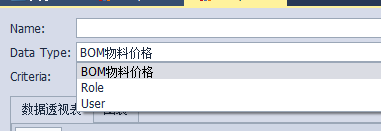
需要在一个地方做配置。