
久期增加会提高长期预期回报吗?
- Does Duration Extension Enhance Long-Term Expected Returns?
著:Antti Ilmanen 译:徐瑞龙
Does Duration Extension Enhance Long-Term Expected Returns?
久期增加会提高长期预期回报吗?
INTRODUCTION
引言
Consider the situation of an investor —— such as a central bank, a commercial bank, an insurance company, or a pension fund sponsor —— that has to choose the neutral benchmark duration for its US dollar portfolio. This choice depends on the long-run reward-risk trade-off offered in the US bond market (as well as on the investor's investment horizon and risk tolerance) and not on any tactical interest rate views. Three directors of the investing institution meet to discuss their combined knowledge about the long-run bond risk premium. One director argues that the typical upward slope of the yield curve is evidence of a positive risk premium. Another director points out that the curve shape might reflect expectations of rising rates instead of a risk premium. It is better to look directly at historical return data, he argues, and presents the others some data that show how average returns over the past decade increased strongly with duration. The third director recalls that over a very long period (1926-94) long-term bonds earned only somewhat higher average returns than one-month bills and lower average returns than intermediate-term bonds. These findings are hard to reconcile until the directors realize that the recent sample reflects findings from a disinflationary period that was exceptionally favorable for long-term bonds. In contrast, the poor returns of long-term bonds in the longer sample partly reflect the yield rise over the decades. What should the directors conclude?
考虑下面的的情况,中央银行、商业银行、保险公司或养老基金发起人这一类投资者必须为其美元投资组合选择中性基准久期。这种选择取决于美国债券市场提供的长期回报-风险权衡(也与投资者的投资期限和风险承受能力有关),而不是任何技术性的收益率观点。投资机构三位董事会晤,共同讨论了长期债券风险溢价。一位董事认为,收益率曲线典型地向上斜率是正风险溢价的证据。另一位董事指出,曲线形状可能反映了收益率上升的预期,而不是风险溢价。他认为最好直接查看历史回报数据,并向他人介绍一些数据,显示过去十年的平均回报随久期的增长而增长。第三位董事回忆说,长期来看(1926-94)长期债券的平均回报高于一月期国库券,低于中期债券。这些调查结果很难协调,直到董事们意识到最近的样本反映出现了对长期债券特别有利的通货紧缩期。相比之下,长期债券的回报较低,部分反映了数十年来债券收益率的上升。董事应该做什么?
The goal of this paper is to help investors assess whether duration extension is rewarded in the long run. We present extensive empirical evidence mainly from the US Treasury bond market over the past 25 years. All findings about historical returns depend on the interest rate trend in the sample period, but we alleviate concerns about sample-specific results by studying a period without a strong trend. Further, by examining the historical returns over many subperiods, across markets and from several perspectives, we can give as conclusive answers about long-run expected returns as possible.
本文的目的是帮助投资者评估长期来讲久期增加是否值得。我们提供的实证证据主要来自过去25年里的美国国债市场。所有关于历史回报的发现都取决于样本期的收益率趋势,但我们通过研究一个没有强趋势的时期来减少对样本特定结果的担忧。此外,通过考察许多子时段、不同市场和不同视角的历史回报,我们可以给出关于长期预期回报的确定性答案。
The main conclusion is that duration extension does increase expected returns at the front end of the curve —— the one-year bill earns about a 150 basis point higher annual return than the one-month bill. The slope of the average return curve flattens gradually, and for durations longer than two years, no conclusive evidence exists of rising expected returns (see Figure 1, which we explain in detail further in the report). Subperiod analysis shows that the average return differentials at short durations are quite stable, suggesting that the shortest Treasury bills are quite inefficient investments. In contrast, the relative performance of intermediate-term and long-term bonds varies with the interest rate trend (bull and bear markets).
主要结论是久期增加确实增加了曲线前端的预期回报——一年期国库券比一月期国库券高出约150个基点。平均回报曲线的斜率逐渐平缓,久期长于两年的债券没有预期回报上升的确凿证据(见图1,我们将报告中进一步说明)。子时段分析显示,短期久期的平均回报差异相当稳定,表明最短期的国库券投资效率低下。相比之下,中期和长期债券的相对表现随着收益率走势(牛市和熊市)而变化。
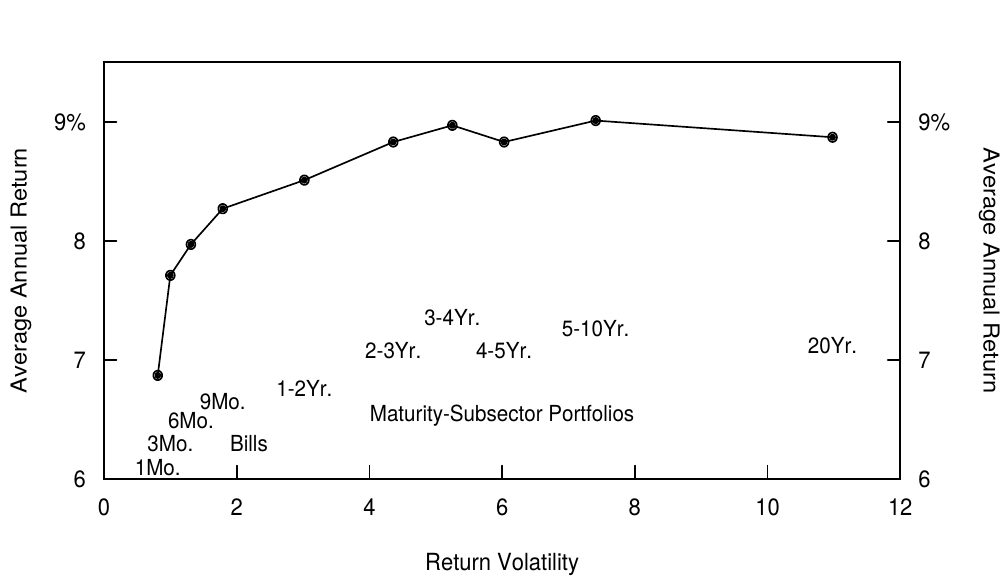
Figure 1. Return-Risk Trade-Off in the U.S. Treasury Market, 1970-94
This report is the third part in a series titled Understanding the Yield Curve, and it focuses on the long-run expected return differentials across bonds with different maturities. We refer to a long-term bond's expected holding-period return in excess of the short-term riskless rate as the bond risk premium. (We discuss this terminology at some length in the Appendix.) The bond risk premium is an important determinant of the yield curve shape, but it is not the only determinant. Parts 2 (Market's Rate Expectations and Forward Rates) and 5 (Convexity Bias and the Yield Curve) in the series describe how the market's rate expectations and convexity bias influence the curve shape. Moreover, the risk premium may not be constant; thus, the long-run average of realized excess bond returns may not be the best forecast of the near-term bond risk premium. Part 4 in the series (Forecasting US Bond Returns) discusses the evidence about the time-varying risk premium and its investment implications.
本报告是《理解收益率曲线》系列的第三部分,重点介绍了不同期限债券的长期预期回报差异。我们将长期债券的持有期回报超过短期无风险收益率的部分视为债券风险溢价(我们在附录中详细讨论这个概念。)债券风险溢价是收益率曲线形状的重要决定因素,但并不是唯一的决定因素。该系列的第2部分(《市场预期与远期收益率》)和第5部分(《凸度偏差与收益率曲线》)分别描述了市场的收益率预期和凸度偏差如何影响曲线形状。此外,风险溢价可能不是恒定的;因此,实现债券超额回报的长期平均值可能不是近期债券风险溢价的最佳预测。系列中的第四部分(《预测美国债券回报》)讨论了有关时变风险溢价及其投资影响的证据。
WHAT DO THEORIES TELL US ABOUT THE BOND RISK PREMIUM?
理论如何解释债券风险溢价
Various theories make very different predictions about the bond risk premium. These theories suggest many possible determinants of the bond risk premium; they tell us something about its likely sign, shape across maturities and constancy over time; but they tell us very little about its likely magnitude.
各种理论对债券风险溢价做出非常不同的预测。这些理论提出了债券风险溢价的许多决定因素;告诉我们一些关于它的可能的符号、关于期限的形状和关于时间的恒定性;但很少告诉我们可能的幅度。
Our brief survey discusses six alternative theories. We begin with three classic term structure hypotheses. (i) The pure expectations hypothesis implies that no bond risk premium exists. That is, the influence of risk-neutral arbitrageurs drives all government bonds' expected returns to equal the short-term riskless rate. (ii) According to the liquidity (or risk) premium hypothesis, long-term bonds earn a positive risk premium as a compensation for their return volatility. Underlying this hypothesis is the idea that most investors dislike short-term fluctuations in returns.[1]
我们的简要综述讨论了六种替代理论。我们从三个经典期限结构假说开始。(1)完全预期假说意味着债券风险溢价不存在。也就是说,风险中性套利者的影响力使得所有政府债券的预期回报等于短期无风险收益率。(2)根据流动性(或风险)溢价假说,长期债券获得正的风险溢价作为其回报波动率的补偿。这个假说的基础是大多数投资者不喜欢短期回报波动。
(iii)The preferred habitat hypothesis states that expected returns may increase or decrease with duration. Many pension funds and life insurance companies view the long-term bond as less risky than the short-term asset because it better matches the average duration of their liabilities. These investors, which we refer to as long-horizon investors, would accept a lower yield for the long-term bond than for the short-term asset. Even if horizons and subjective risk preferences vary across investors, each asset has only one market price. For this reason, the risk premium offered by the market will depend on "the market's investment horizon" and, therefore, on the relative importance of short-horizon and long-horizon investors. Casual empiricism suggests that the long-horizon investors still represent a minority: thus, the risk premium should increase with duration.[2] However, the risk premium offered by the market may be lower than that required by the short—horizon investors.
(3)优先偏好假说指出,预期回报可能随着久期而增加或减少。许多养老基金和人寿保险公司认为长期债券的风险小于短期资产,因为它与债务的平均期限能更好地匹配。我们称接受长期债券回报低于短期资产回报的这些投资者为长期投资者。即使投资者的投资期限和主观风险偏好有差异,每个资产也只有一个市场价格。因此,市场提供的风险溢价将取决于“市场的投资期限”,因此取决于短期和长期投资者的相对重要性。经验主义表明,长期投资者仍然是少数,因此风险溢价应该随着期限而增加。然而,市场提供的风险溢价可能会低于短期投资者所要求的。
Modern asset pricing theories relate risk premium to amount of risk and price of risk rather than to investment horizons and the relative importance of different investor groups. (iv) In many one-factor term structure models, a bond's risk premium is proportional to its return volatility. In partial equilibrium models, bonds are viewed in isolation and volatility is the relevant risk measure. These models ignore the correlations between bond returns and other assets or other economic variables. (v) In the Capital Asset Pricing Model, any asset's risk depends on its sensitivity to the aggregate wealth. This is often measured by an asset's stock market sensitivity (that is, its beta or the asset's relative volatility multiplied with its correlation with the stock market). An asset's risk premium is the product of its beta and the market risk premium, which in turn depends on the market volatility and the market's risk aversion level. Given that long-term bond returns tend to be positively correlated with the stock market return, their betas (and the bond risk premia) are positive. In fact, bonds' estimated return volatilities and betas are approximately proportional to their durations. Thus, many theories imply that the bond risk premium should increase linearly with duration.[3]
现代资产定价理论将风险溢价与风险和风险的价格相联系,而不是投资期限与不同投资者群体的相对重要性。(4)在许多单因子期限结构模型中,债券的风险溢价与其回报波动率成正比。在部分均衡模型中,债券被孤立地看待,波动率是风险的度量。这些模型忽略了债券回报与其他资产或其他经济变量之间的相关性。(5)在资本资产定价模型中,任何资产的风险取决于其对总体财富的敏感度。这通常由资产的股票市场敏感度(即其\(\beta\)或资产的相对波动率乘以其与股票市场的相关性)来衡量。资产的风险溢价是其\(\beta\)和市场风险溢价的乘积,反过来又取决于市场波动和市场风险规避水平。鉴于长期债券回报往往与股市回报正相关,其\(\beta\)(和债券风险溢价)为正。事实上,债券的估计回报波动率和\(\beta\)与其久期大致成正比。因此,许多理论认为债券风险溢价应该随着久期线性增长。
The most complex theories allow risks and rewards to be time-varying instead of constant, and they allow multiple factors that reflect fundamental economic risks. (vi) The intuition behind all general equilibrium models is that assets that perform poorly in "bad times"[4] should earn a positive risk premium. In contrast, assets which perform well in "bad times" are accepted for very low yields. To the extent that long-term bonds are a good hedge against recessions, they might even earn a negative risk premium. This may have been the case during the Great Depression of the 1930s, but it certainly has not been the case in the post-World War II period. Bonds performed extremely poorly during the inflationary recessions of 1973-75 and 1980-82. Thus, the spirit of the general equilibrium models suggests that long-term bonds should earn a positive risk premium.
最复杂的理论允许风险和回报随时间变化而不是恒定的,并且允许存在反映基本经济风险的多个因素。(6)所有一般均衡模型背后的直觉是,在“坏时期”表现不佳的资产应该获得正的风险溢价。相比之下,在“坏时期”表现良好的资产以接受非常低的收益率。在对抗衰退的情况下,长期债券甚至可能会获得负的风险溢价。在二十世纪三十年代的大萧条时期可能就是这样,但在二战后的时期肯定不是这样。在1973至1975年及1980年至1982年的滞涨期,债券表现极差。因此,一般均衡模型的精神认为长期债券应该获得正的风险溢价。
Many bond market participants feel that the expected return differentials across bonds mostly reflect bonds' characteristics that are not related to the risk characteristics on which the modern theories focus. For example. less liquid bonds earn higher expected returns, as evidenced by the positive yield spreads between duration-matched short-term Treasury coupon bonds and Treasury bills, between off-the-run and on-the-run bonds, and between the illiquid 20-year sector and the liquid 10- and 30-year sectors.[5] Unpopular assets, such as recent poor performers, may earn higher returns because holding them exposes portfolio managers to a "career risk". Temporary supply and demand imbalances also can cause expected return differentials across the curve sectors. In general, most asset-pricing theories ignore such technical factors, institutional constraints and any supply effects. In this report, the term "risk premium" encompasses all expected return differentials across bonds, whether risk-related or other factors cause them.
许多债券市场参与者认为,债券的预期回报差异主要反映了债券的特征,而不是现代理论所关注的风险特征。例如。流动性不足的债券获得较高的预期回报,正如久期匹配的短期付息国债和国库券之间的正利差、老券和新券之间的正利差、流动性差的20年券与流动性好的10年和30年券之间的正利差。不受欢迎的资产,如最近表现不佳的资产,可能会获得更高的(预期)回报,因为他们将投资组合经理暴露在“职业风险”之下。临时供需不平衡也可能导致曲线不同部位的预期回报差异。一般来说,大多数资产定价理论忽略这些技术因素,制度上的限制和任何供给方面的影响,在本报告中,“风险溢价”一词涵盖债券之间的所有预期回报差异,无论是风险相关还是其他因素导致的。
To summarize this survey, many theories suggest that the long-term bonds are riskier than short-term bonds and that investors can earn a positive risk premium for bearing this risk. Some models specify that expected returns are linear in duration or in return volatility. According to the various models, several factors can influence the slope of the expected return curve. For example, the slope may increase with bond market volatility, stock-bond correlation, the market's risk aversion level, the relative wealth of short-horizon investors (versus long-horizon investors), and the relative supply of government bonds across the curve. In the rest of this report, we examine empirically whether (and by how much) expected returns increase with duration and whether this relation, if it exists, is linear. It is more difficult to explain which factors cause the documented expected return differentials.
总结以上综述,许多理论认为长期债券比短期债券风险高,投资者可以通过承担风险获得正的风险溢价。一些模型指定预期回报关于久期或回报波动率是线性关系的。根据各种模型,几个因素可能影响预期回报曲线的斜率。例如,斜率可能会随着债券市场的波动、股票-债券相关性、市场风险规避水平、短期投资者(相对于长期投资者)的相对财富以及政府债券的相对供给(因期限而异)而增加。在本报告的其余部分,我们经验地检验预期回报是否随久期增加(以及程度),以及这种关系(如果存在)是否是线性的。解释哪些因素导致预期回报差异则更难。
EMPIRICAL EVIDENCE ABOUT THE BOND RISK PREMIUM IN THE TREASURY MARKET
国债市场中债券风险溢价的实证证据
Estimating the Risk Premium from Historical Yield or Return Data
从历史收益率或回报数据估算风险溢价
The (expected) bond risk premium is not directly observable. However, one can use historical yield or return data to estimate the average risk premium. We will use both approaches, but first we discuss their underlying assumptions and the pitfalls in their use. We also discuss these topics and the terminology in the Appendix.
(预期)债券风险溢价不可直接观察。然而,可以使用历史收益率或回报数据来估计平均风险溢价。我们将使用这两种方法,但首先我们讨论其基本假设和使用中的陷阱。我们也在附录中讨论这些主题和术语。
Average yield curve shapes may help us estimate the average bond risk premium. The term spreads (that is, yield differentials between long-term bonds and short-term bonds) contain information about required bond risk premia, but they also reflect the market's expectations of future rate changes. It is notoriously difficult to disentangle these components. Conceptually, they can be isolated in the extreme versions of the pure expectations hypothesis and the liquidity premium hypothesis. According to the pure expectations hypothesis, an upward-sloping yield curve only reflects expectations of future rate changes; there are no risk premia.[6] The liquidity premium hypothesis makes the opposite claim: An upward-sloping yield curve reflects only required risk premia and no rate expectations. In reality, the shape of the yield curve probably reflects both rate expectations and risk premia.
收益率曲线的平均形状可能有助于我们估计平均债券风险溢价。期限利差(即长期债券和短期债券之间的收益率差异)包含有关债券风险溢价的信息,但也反映了市场对未来收益率变动的预期。区分这些成分是非常困难的。在理论上,它们可以被分解到完全预期假说和流动性溢价假说的极端版本中。根据完全预期假说,向上倾斜的收益率曲线仅反映对未来收益率变化的预期,没有风险溢价。流动性溢价假说持相反观点:向上倾斜的收益率曲线仅反映风险溢价而没有收益率预期。实际上,收益率曲线的形状可能同时反映了收益率预期和风险溢价。
The average term spread may be a good measure of the long-run average bond risk premium if the expected yield changes average to zero in the sample period. This requirement is often violated in short sample periods. For example, if the market has persistently expected rising rates during the sample, the average yield curve shape exaggerates the risk premium.
如果样本期的预期收益率平均变化为零,则平均期限利差可能是长期平均债券风险溢价的衡量指标。这个要求在短时间内经常无法满足。例如,如果样本期内市场持续预期收益率上升,平均收益率曲线形状会夸大风险溢价。
It is more direct to study return data. Historical average return differences are often used to estimate the expected risk premium. Even this approach contains implicit assumptions. By definition, any realized return can be split into an expected part and an unexpected part. Similarly, realized excess return can be split into the bond risk premium and the unexpected excess return. For a given day's or month's realized return of a risky asset, the unexpected part dominates. Yet, when many observations are averaged over time, the positive and negative unexpected parts begin to offset each other. Thus, a long-run average reflects the expected part more than the unexpected part. However, the historical average of realized excess returns is a good measure of the long-run expected risk premium only if the unexpected parts exactly wash out.[7] This is more likely to happen if the sample period is long and does not contain an excessively bearish or bullish bias (yield trend).
研究回报数据更直接。历史平均回报差异通常用于估计预期风险溢价。即使这种方法也包含隐含的假设。根据定义,任何实现的回报都可以分为预期部分和非预期部分。类似地,实现的超额回报可以分为债券风险溢价和意外超额回报。对于某一天或几个月实现的风险资产回报,意外超额回报的部分占主导地位。然而,当许多观察值随着时间的推移而被平均化时,正面和负面的意外部分开始相互抵消。因此,长期平均来看预期的部分超过意外的部分。然而,实际超额回报的历史平均水平只有在意外的部分完全清除时才能很好地衡量长期预期风险溢价。如果样本期较长,且不包含看跌或看涨的偏差(收益率趋势),则这种情况更可能发生。
In other words, this approach is valid if the market's yield forecasts are correct, on average, during the sample period, so that the average unexpected yield changes are zero. The disinflation of recent years has surprised the bond markets positively, causing a realized risk premium that exaggerates the expected premium. (Many firms' databases begin in the early 1980s, near the peak yield levels, which may have given bond market participants a too optimistic view about expected bond returns.) Much longer sample periods suffer from the opposite problem, because of the persistent inflation surprises since the 1950s, which have caused capital losses to bondholders. It is not reasonable to assume that the market correctly anticipated the increase in long-term rates from the 3% levels in the 1950s.
换句话说,如果市场的收益率预测在样本期平均是正确的,那么这种方法是有效的,所以平均意外收益率变化为零。近年来的通货紧缩令债券市场繁荣,导致实现风险溢价夸大预期溢价。(许多公司的数据库始于20世纪80年代初,接近收益率峰值水平,这可能使债券市场参与者对预期债券回报过于乐观)。更长的样本期遭受相反的问题,因为自1950年代以来持续的通货膨胀,这些都给债券持有人造成了资本损失。假设市场正确地预测到长期收益率从上个世纪五十年代的3%水平开始上升是不合理的。
This discussion illustrates how empirical evidence about historical average returns can vary dramatically across samples even when long sample periods are used. Period specificity is a problem that sophisticated econometric techniques cannot overcome. In this report, we focus on a neutral sample period, chosen so that the beginning and ending yield levels are not far apart. (Of course, it is possible that the expected and unexpected rate changes are large but offsetting, even when the realized rate changes average to zero.)
这个讨论说明了即使使用较长的样本期,关于历史平均回报的经验证据可以在样本间有显着差异。时段特定性是复杂的计量经济学技术无法克服的问题。在本报告中,我们将重点放在一个中性的样本期,期初和期末收益率水平相差不大。(当然,当实现的收益率变化平均为零,预期和意外的收益率变化可能很大但是抵消了。)
Data Description
数据说明
We analyze average yields and returns of strategies that concentrate portfolio holdings in a certain maturity sector of the US Treasury market. We also offer some additional evidence from other US bond market sectors and from international government bond markets.
我们分析了美国国债市场特定期限上的投资组合的平均收益率和回报率。我们还提供了其他美国债券市场部门和国际政府债券市场的其他证据。
The main analysis covers the past quarter century (1970-94). We chose this period for three reasons:
主要分析涵盖了过去二十五年(1970-94年)。我们选择这个时期有三个原因:
- Length. 300 monthly observations reduce the problem of period-specific findings.
- 长度,300次月度观察减少了“时段特定”的问题。
- Relevance. Lengthening the sample period makes sense only if the world has not changed so much that old data are irrelevant. This quarter century has been a period of fiat money (that is, money backed only by the government's promise), floating exchange rates, volatile inflation, and large budget deficits. However, some may argue that bond markets have changed so dramatically with globalization, deregulation, securitization, and technological change, that the 1970s data are not relevant. If we eliminated the 1970s data, we would be left with a biased sample that covers only the disinflationary 1980s and 1990s.
- 相关性,只有当世界没有太大的变化,旧的数据是不相关的,延长样本期才有意义。这二十五年是一个法定货币时期(只有政府承诺支持的货币),浮动汇率、不稳定的通货膨胀,以及巨额的预算赤字。然而,有些人可能会认为,随着全球化、放松管制、证券化和技术变革,债券市场发生了巨大的变化,1970年的数据并不相关。如果我们消除了20世纪70年代的数据,我们将留下一个有偏的样本,仅涵盖通货紧缩的80年代和90年代。
- Neutrality. Net yield changes (declines in the short-term rates and increases in the long-term rates) were small between January 1, 1970, and December 31, 1994. Thus, a sample-specific yield trend does not excessively influence the historical average returns during this period.[8]
- 中立性,1970年1月1日至1994年12月31日期间,净收益率变动(短期收益率下降和长期收益率上升)较小。因此在这段时期,样本收益率趋势不会过度影响历史平均回报。
Because this report studies the behavior of bond markets over a longer period, we need to analyze portfolios whose characteristics do not change too much over time, such as constant-maturity or maturity-subsector portfolios. Therefore, we use yield and return series whose underlying assets are rebalanced monthly. The ten yield series include one-month, three-month, six-month, nine-month, and 12-month Treasury bill series constructed by the Center of Research for Security Prices (CRSP) at the University of Chicago[9], Salomon Brothers's "on-the-run" two-year, three-year, five-year, and ten-year Treasury bond series, and Ibbotson Associates's 20-year Treasury bond index. The ten return series include four Treasury bill portfolios (one-month, three-month, six-month, and nine-month) and five maturity-subsector Treasury bond portfolios (one to two years, two to three years, three to four years, four to five years, and five to ten years) from CRSP, and the 20-year Treasury bond index from Ibbotson Associates. The 20-year bond is the longest that we study because 30-year bonds were not issued regularly before 1977.
由于本报告研究了债券市场在较长时间内的行为,因此我们需要分析其特征随着时间的推移不会变化太大的投资组合,如不变期限或期限分组投资组合。因此,我们使用收益率和回报率序列,其基础资产每月重新平衡。十个收益率系列包括芝加哥大学证券价格研究中心(CRSP)的一月、三月、六月、九月和十二月期的国库券收益率序列,Salomon Brothers 的两年、三年、五年和十年期国债收益率序列,以及 Ibbotson Associates 的二十年期国债指数。十个回报率序列包括四个国库券组合(一月、三月、六月、九月期)和五个来自 CRSP 的期限分组国债组合(一至两年、两三年、三至四年、四至五年、五至十年)和来自 Ibbotson Associates 的20年期国债指数。20年期债券是我们研究的最长期限,因为1977年以前没有定期发行30年期债券。
Evidence From the Treasury Yield Curve Shapes
来自国债收益率曲线形状的证据
Figure 2 displays the path of the short-term rate and the long-term rate during the sample period. The time series have a distinct inverse "V" shape. In the first half, both rates increased dramatically; in the second half, they declined equally dramatically. In the first half, the yield curve frequently was inverted; through most of the second half, the curve was steeply upward sloping.
图2显示了样本期内短期收益率和长期收益率的路径。时间序列具有明显的倒“V”形。前半部分,两个收益率均大幅上涨;后半部分,下降幅度相当大。前半部分,收益率曲线时有倒挂;在后半部分大部分时间里,曲线非常陡峭。
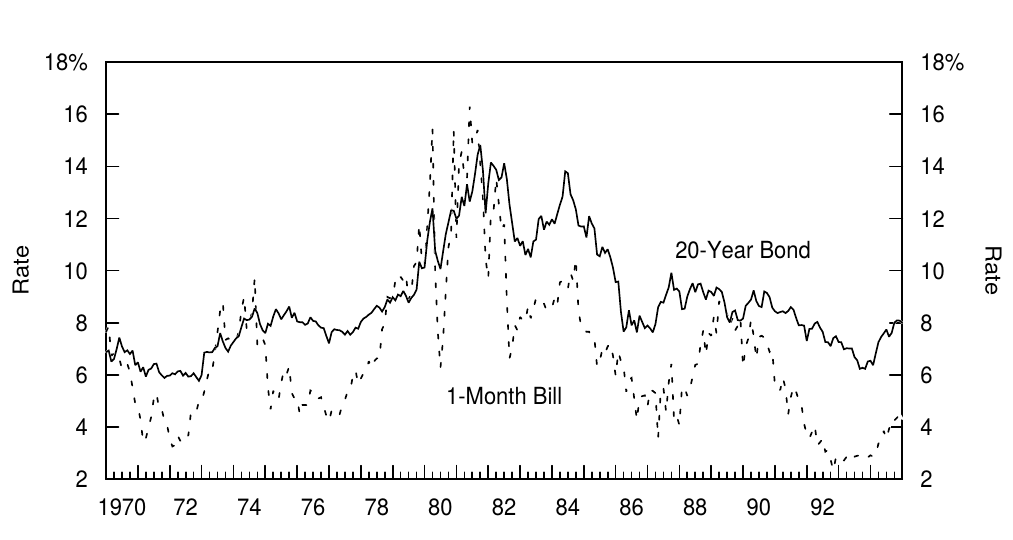
Figure 2. Yield Levels, 1970-94
Figure 3 reports average yields (semiannually compounded) and yield spreads over the shortest rate, as well as the annualized standard deviations of monthly yield changes. The main conclusions are as follows:
图3显示了平均收益率(半年付息)和最短期收益率的利差以及月度收益率变化的年化标准差。主要结论如下:
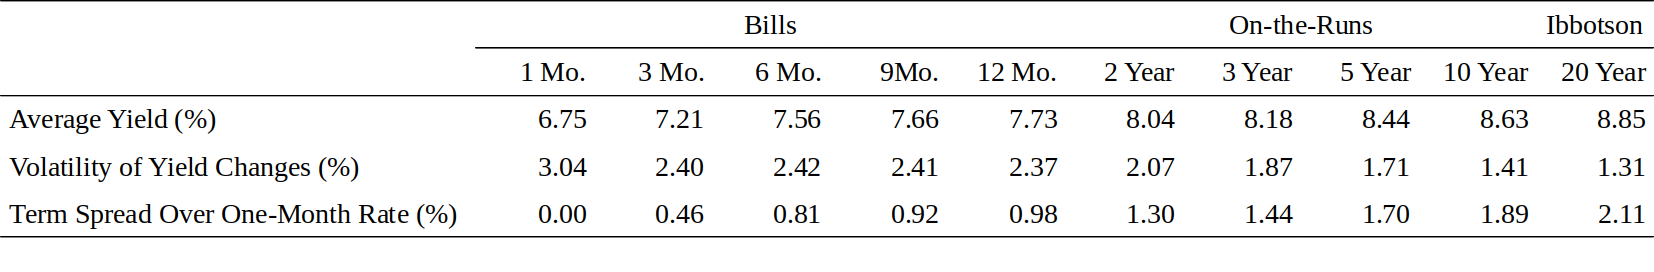
Figure 3. Treasury Instrument Yields, 1970-94
- Average yields are increasing across the curve. An upward-sloping curve shape probably reflects a positive bond risk premium, but perhaps also rising rate expectations. Such expectations may have been rational even if they were not realized, given the inflation fears in a world of fiat money and large budget deficits.
- 平均收益率在整个曲线上上涨。向上倾斜的曲线形状可能反映了正的债券风险溢价,但也可能反映了收益率上升的预期。即使预期没有实现,这种预期也可能是理性的,考虑到当时法定货币和巨额预算赤字带来的通胀恐慌。
- The curve is concave in maturity (as well as in duration), that is, yields increase at a decreasing rate as a function of maturity. Potential explanations for this shape include the demand for long-term bonds from the long-horizon investors and the convexity advantage of long-term bonds.
- 曲线关于期限(以及久期)是上凸的,也就是说,随着期限的变化,收益率的增长速度递减。这种形状的潜在解释包括长期投资者对长期债券的需求以及长期债券的凸度优势。
- The term structure of yield volatilities is inverted, likely reflecting mean reversion in short rates.[10] This observation implies that return volatility does not increase quite one-for-one with duration. For this reason, we present the risk-reward trade-off in Figure 1 by plotting average bond returns on return volatilities, not on durations.
- 收益率波动率的期限结构是倒挂的,可能反映了短期收益率的均值回归。这个观察意味着回报波动率不会必然随久期增加。因此,我们通过回报波动率,而不是久期来呈现图1中平均债券回报的风险-回报均衡。
Figure 4 displays the term spreads at the short end and at the long end of the curve. The shorter spread has been much more consistently positive. This may be an indication of the persistence of a positive bond risk premium at short maturities. We will next examine return data to study this issue in more detail.
图4显示了在曲线的短端和长端的期限利差。较短期限的价差一直是正的。这可能表明短期债券风险溢价持续存在。接下来我们将再次查看回报数据来更详细地研究这个问题。
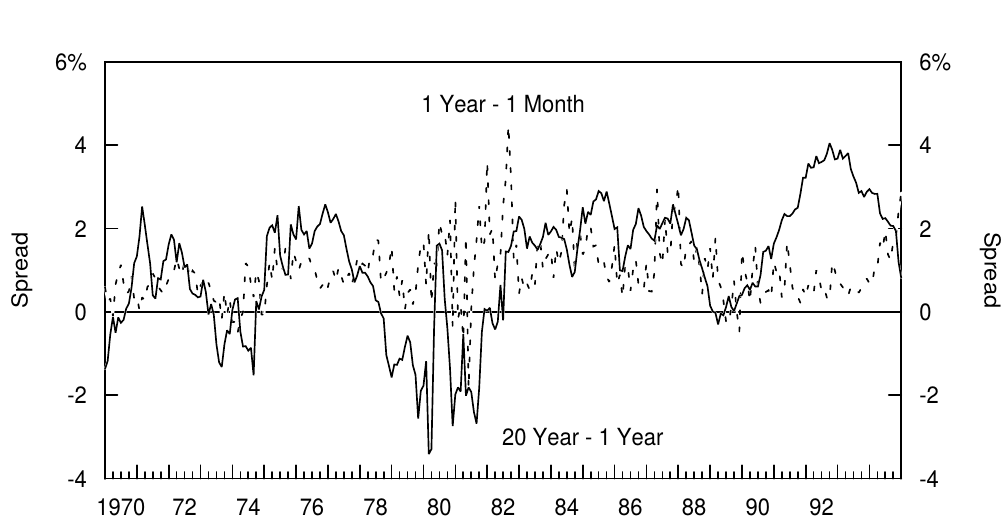
Figure 4. Yield Spreads, 1970-94
Evidence From Government Bond Returns
政府债券回报的证据
As explained before, historical bond returns offer more direct evidence about the bond risk premium than historical bond yields do. Figure 5 shows the annual arithmetic and geometric means (averages) and other statistics for the ten return series described above. Most of the analysis in this report focuses on geometric mean returns rather than on the arithmetic means. The geometric mean reflects the multiperiod compound return that various strategies would have accumulated over the sample. The arithmetic mean exaggerates the historical performance, but it may be a better measure of expected return.[11]
如前所述,历史债券回报率,而不是历史债券收益率,提供了关于债券风险溢价的更直接证据。图5显示了上述十个回报率序列的年化算术和几何平均值(平均值)和其他统计量。本报告中的大部分分析都集中在几何平均回报上,而不是算术平均回报。几何平均反映了各种策略在样本上累积的多期复合回报。算术平均夸大历史表现,但可能是对预期回报的更好衡量。
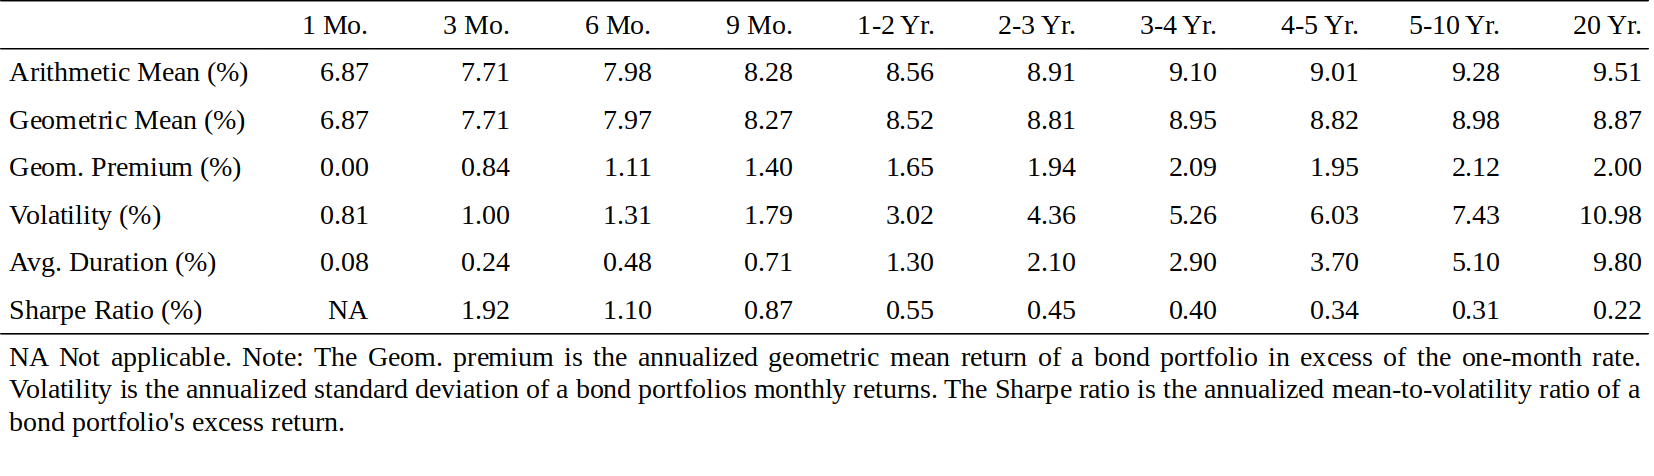
Figure 5. Treasury Maturity Subsector Annual Returns and Other Statistics, 1970-94
The arithmetic mean return curve increases almost monotonically, while the geometric mean return curve is quite flat after two years. There appears to be a positive bond risk premium, but mainly at the front end of the curve: roughly 150 basis points between one-month and one-year durations and an additional 50 basis points between one- and two-year durations. Beyond two years, it is unclear whether duration extension increases expected returns at all.[12] The pattern of Sharpe ratios confirms that the reward to volatility decreases with maturity.[13]
算术平均回报曲线几乎单调增加,而几何平均回报曲线在两年后相当平缓。似乎存在正的债券风险溢价,但主要是在曲线的前端:一月和一年期之间存在大约150个基点,一年和两年期之间存在另外50个基点。两年以后,增加久期是否增加预期回报是不清楚的。夏普比率的走势证实,波动率的回报随着期限而下降。
Figure 1 shows the ex-post risk-reward trade-off in the bond market (based on data from Figure 5) by plotting the geometric mean returns on their return volatilities. Recall that many theories predict that expected returns increase linearly with return volatility or with duration. The pattern in Figure 1 contradicts these predictions; average returns are concave in return volatility. The explanation that many market participants would offer is related to the old preferred habitat hypothesis. The expected returns of the long-term bonds are "pulled down" by the demand from long-horizon investors, such as pension funds, which perceive the long-term bond as the least risky asset because it best matches the average duration of their liabilities. However, these long-horizon investors are a minority in the marketplace; thus, they do not pull the expected return of the long-term bonds quite as low as that of the short-term bonds.
图1通过绘制几何平均回报率关于其波动率的关系,显示了债券市场中的后验风险-回报均衡(基于图5的数据)。回想一下,许多理论预测,预期回报随回报波动率或久期呈线性增长。图1中的模式与这些预测相矛盾;平均回报关于回报波动率是上凸的。许多市场参与者提供的解释与旧的优先偏好假说有关。长期债券的预期回报由长期投资者的需求(如养老基金)“下调”,养老基金将长期债券视为风险最低的资产,因为与他们的债务平均久期最匹配。然而,这些长期投资者在市场上是少数;因此,他们不会把长期债券的预期回报拉低至短期债券的水平。
Even if the sample period is well chosen, the findings are still period-specific unless the expected bond risk premium is very stable. We try to alleviate the problem of period specificity by conducting extensive subperiod analysis to search for patterns that hold across periods. Figure 6 shows separate reward-risk curves (similar to Figure 1) for five five-year subperiods. The bond markets were bearish or neutral in the first three subperiods and bullish (trend declines in long yields) in the last two subperiods. One striking pattern in Figure 6 is that average returns increase monotonically from the one-month bill to the nine-month bill in all five subperiods. This pattern provides further evidence regarding a persistent positive risk premium at the front end of the yield curve.[14]
即使样本期选择良好,除非预期的债券风险溢价非常稳定,否则结果仍然是因时段而异的。我们尝试通过进行广泛的子时段分析来寻找贯穿时段的模式来缓解时段特异性的问题。图6分别显示了五个五年子时段的回报-风险曲线(类似于图1)。债券市场在头三个时段看跌或看平,在最近两个时段看涨(长期回报的趋势下降)。图6中的一个引人注目的模式是,在所有五个子时段内,从一月期到九月期国库券的平均回报单调增加。这种模式进一步证明了在收益率曲线前端有一个持续的正风险溢价。
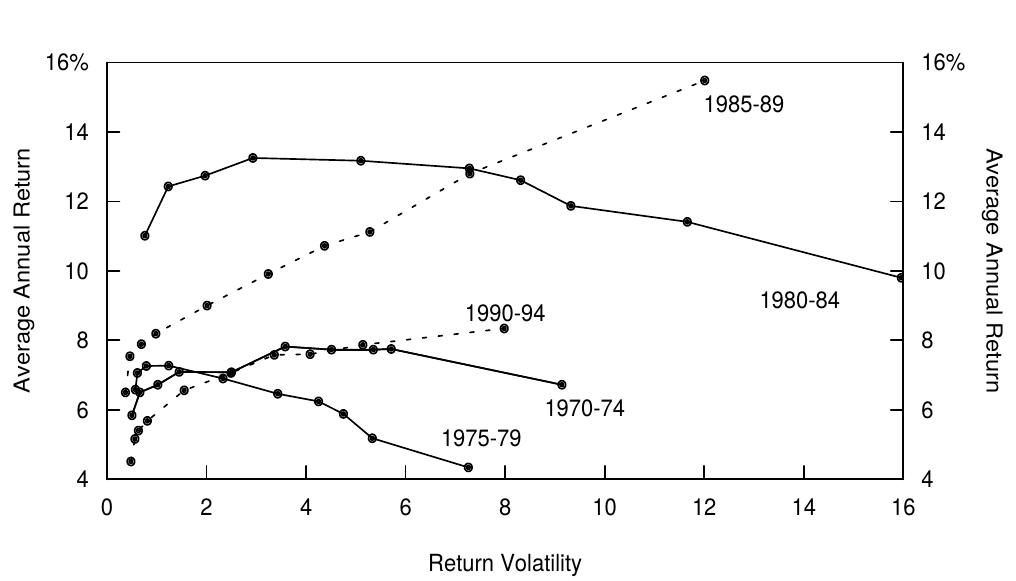
Figure 6. Return-Risk Trade-Off in the U.S. Treasury Market in Five Subperiods Between 1970 and 1994
We further study the stability of the bond risk premium over time by plotting in Figure 7 a moving average of the past 60 months' excess bond returns at the front end of the curve (one- to two-year bonds minus one-month bill) and at the long end of the curve (20-year bond minus one- to two-year bonds). We include in this figure the rolling premium already from the 1950s and 1960s to illustrate how bearish the bond market environment was before our main sample period. Again, the premium at the front end is almost always positive. In contrast, the premium at the long end is very often negative. In fact, the performance of the 20-year bond is surprisingly consistently bad until the mid-1980s. Only very recent samples support the claim that long-term bonds offer higher returns than intermediate-term bonds. These findings reflect the powerful impact that the slow and systematic changes in inflation rates have had on long-term bond returns.
我们进一步研究债券风险溢价随时间的稳定性,如图7所示,过去60个月的曲线前端(一至两年期债券减去一月期国库券)和曲线末端(20年期债券减去一年至两年期债券)债券超额回报的移动平均线。我们在这个图中列出了从1950年代和1960年代开始的滚动溢价,以说明在主要样本期之前债券市场的熊市环境。短期的溢价几乎总是正的。相比之下,长期的溢价往往是负数。事实上,20年期债券的表现令人惊讶地持续到1980年代中期。只有最近的样本支持长期债券比中期债券提供更高的回报。这些调查结果反映了通货膨胀率缓慢而系统的变化对长期债券回报的影响。
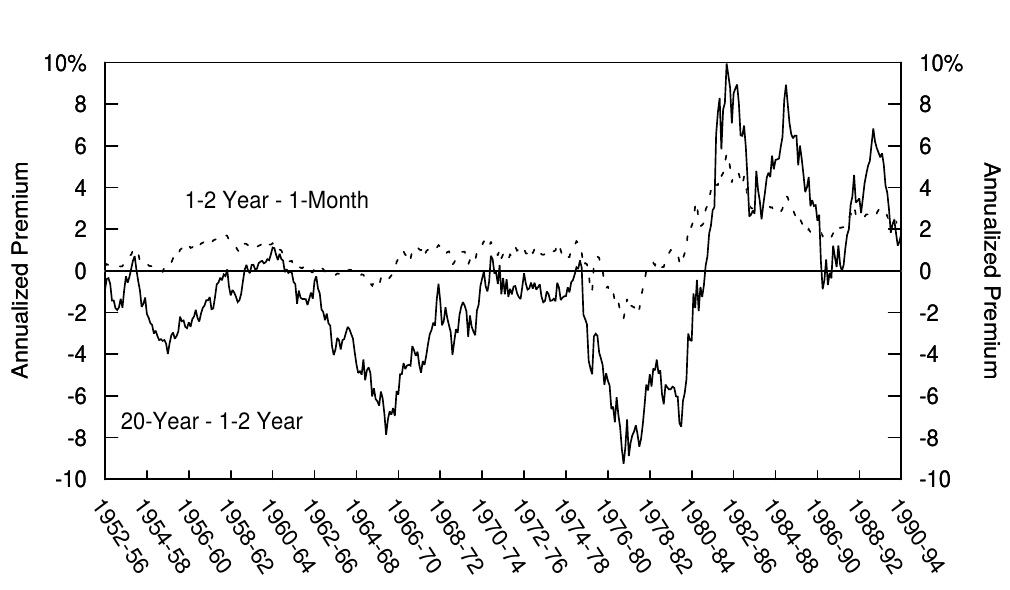
Figure 7. Rolling 60-Month Return Premium, 1957-94
We turn to one more way to study the bond risk premium. We estimate the probability of earning a positive bond risk premium in a short period. We also evaluate the marginal benefit from duration extension by estimating the probability of earning a higher holding-period return than the previous-maturity asset. The intuition behind this analysis is the following. If bond returns are symmetrically distributed and no risk premium exists, the outcome of a duration extension is like a coin toss. There is a 50% probability of gain and a 50% probability of loss. If a positive risk premium exists, long-term bonds will outperform short-term bonds more frequently than half of the time.[15]
我们再来一个方法研究债券风险溢价。我们估计短时间内获得正债券风险溢价的概率。我们还通过估算相对于前一期资产获得更高持有期回报的可能性,评估增加久期的边际效益。这个分析背后的直觉如下。如果债券回报对称分布,并且没有风险溢价存在,久期增加的结果就像抛硬币一样,有50%的概率获益和50%的概率损失。如果存在正的风险溢价,长期债券表现超过短期债券的时间将超过一半。
The first panel of Figure 8 shows that the yield curve has been upward sloping in the bill market about 95% of the sample and somewhat less frequently at longer maturities. The second and third panels show how frequently each asset outperforms the previous-maturity asset and the one-month bill at monthly and annual horizons. Our comments focus on the third panel, because many investors are concerned about the performance of different strategies at an annual horizon. Again we see that there is a consistent positive risk premium in the bill market. For example, a strategy of rolling over three-month bills outperforms a strategy of rolling over one-month bills 99% of the time, and a strategy of rolling over six-month bills outperforms a strategy of rolling over three-month bills 67% of the time. At the longer end, the reward for a marginal duration increase approaches a coin toss. However, the four- to five-year maturity sector is the only area in which a marginal duration increase makes underperformance more likely.
图8的第一部分显示,95%的样本中收益率曲线在国库券市场中向上倾斜了,但在更长的期限内却不如此频繁。第二和第三部分显示每个资产在月度和年度的频率下跑赢前一期资产和一月期国库券收益率的情况。我们的意见集中在第三部分,因为许多投资者都关心不同策略的年度表现差异。我们再次看到,国库券市场存在一致的正风险溢价。例如,99%的时间内三月期国库券滚动策略跑赢了一月期国库券滚动策略,而67%的时间内六月期国库券滚动策略跑赢了三月期国库券滚动策略。在曲线长端,久期增加的边际奖励接近于抛硬币。然而,四至五年期部分是边际久期增长有可能导致表现不佳的唯一领域。
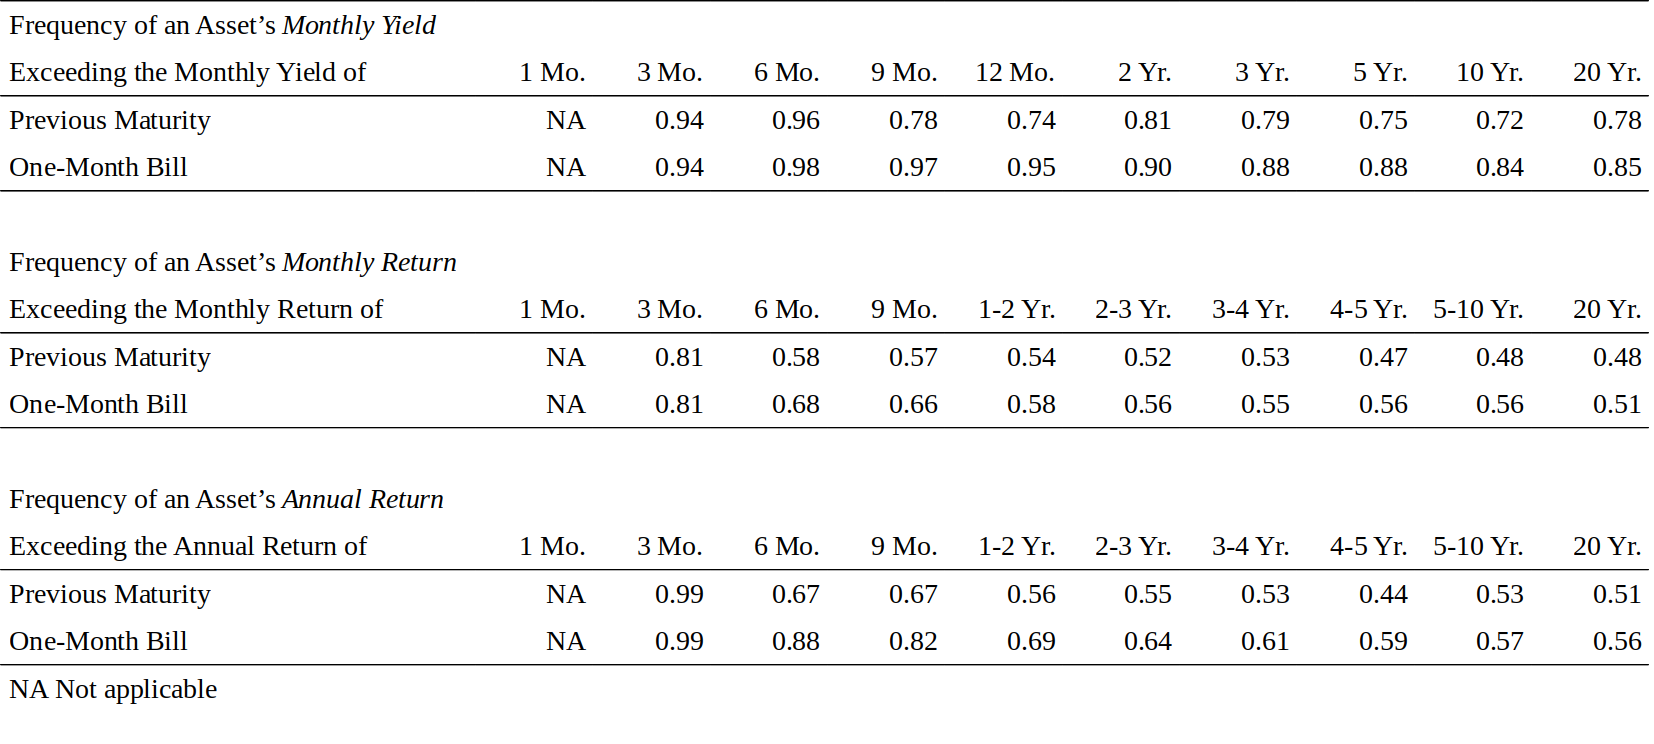
Figure 8. Frequency of Upward-Sloping Yield Curve or Return Curve, 1970-94
EVIDENCE FROM OTHER MARKETS
来自其他市场的证据
In this section, we examine whether the yield and return patterns documented above are specific to the US Treasury markets. We extend our historical analysis to the US non-government debt markets and to the government debt markets outside the United States. All yields in this section are expressed in the semiannual compounding frequency, and all returns are geometric averages. Figure 9 shows the average yields for various money market instruments. The last column shows that all private-sector yield curves are much flatter than the Treasury bill curve. In fact, the average return curves would be even steeper for Treasuries because they tend to roll down the steeper bill curve and earn larger rolldown returns in addition to their yields.
在本节中,我们将研究上文所述的收益率和回报率的模式是否仅限于美国国债市场。我们将历史分析扩展到美国非政府债券市场以及美国境外的政府债券市场。本节中的所有收益率都以半年频率付息,所有回报率均为几何平均数。图9显示了各种货币市场工具的平均收益率。最后一列显示,所有私营部门收益率曲线较国库券曲线平坦的多。事实上,国债的平均回报曲线将会更加陡峭,因为它们往往会从更陡的曲线上下滑,并且除了收益率之外还能获得更大的下滑回报。
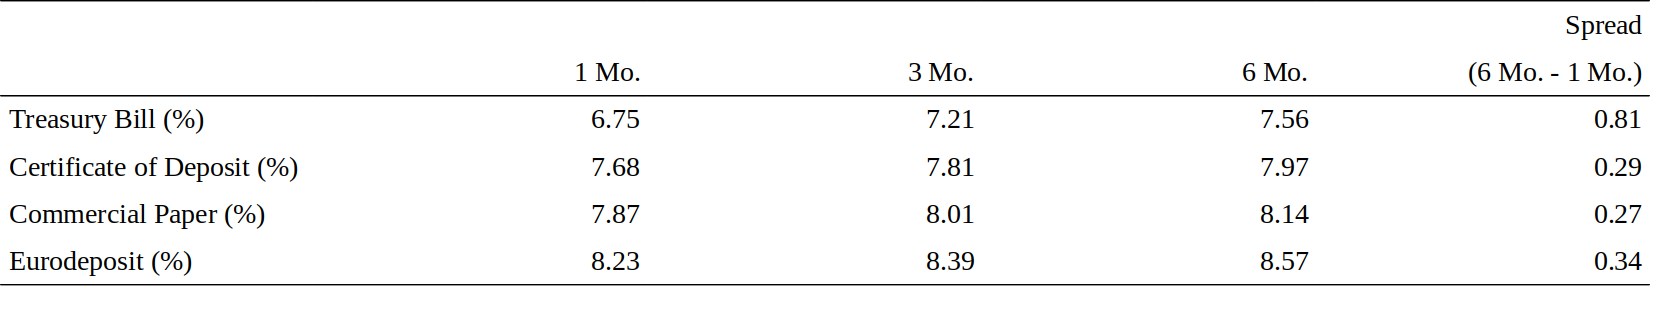
Figure 9. Average Yield Curve Steepness in Public- and Private-Issuer Money Markets, 1970-94
From another perspective, Figure 9 shows that the credit spreads are wider at a one-month maturity than at a six-month maturity. Fama (1986) already has noted such inversion of the term structure of money market credit spreads. This shape can be contrasted with the typical upward-sloping credit spread curve in the corporate bond market beyond one year [see Litterman and Iben (1991) and Iwanowski and Chandra (1995)]. Only one spread is available at shorter and longer maturities than one year: Treasuries versus Eurodeposits. Figure 10 confirms that, between 1985 and 1994, the term structure of this spread typically had a "V" shape. One investment implication is that it often makes sense to take a large share of the desired credit exposure at short maturities.
从另一个角度来看,图9显示信用利差在一月期比六月期更宽。Fama(1986)已经注意到货币市场信用利差期限结构的这种倒挂。这种形状与一年期以上公司债的市场中典型的向上倾斜的信用利差曲线形成对比(参见 Litterman 和 Iben(1991)和 Iwanowski 和 Chandra(1995))。在一个比一年期更短和更长的期限上,只有一种利差是可利用的:国债-欧元存款(译注:Eurodeposits泛指一国银行体系中的外币存款,如欧洲美元存款,常指期限从隔夜至一年不等的银行间大额外币存款。)。图10证实了这一点,在1985年至1994年期间,这种利差的期限结构通常具有“V”字形。这对于投资的意义在于,在短期内持有大量的信用风险敞口往往是有意义的。
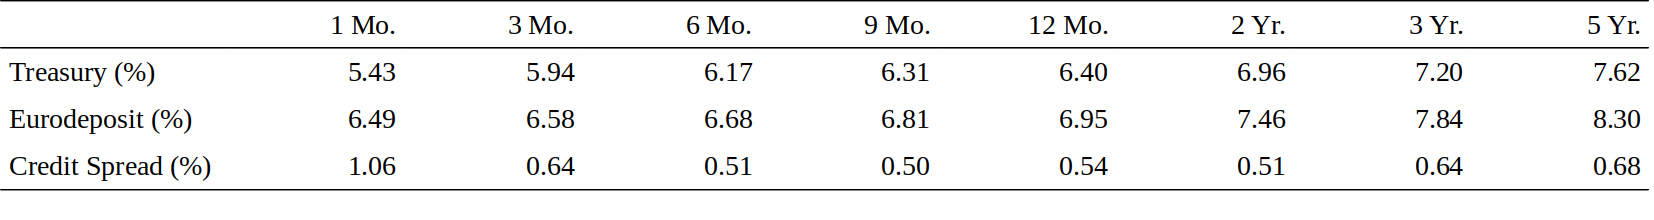
Figure 10. Average Yields in Treasury and Eurodeposit Curves, 1985-94
The wide spread between one-month bill and other assets is difficult to explain as a rational credit spread. More likely, it reflects some investors' return-insensitive demand for the ultimate safe asset. The narrowing of the Eurodeposit-Treasury bill spread in recent years may indicate that such demand for safety "at any cost" is shrinking. (The spread at one-month maturity averaged more than 160 basis points both in the 1970s and in the 1980s, but only 73 basis points in the 1990s.)
一月期国库券与其他资产之间的巨大利差难以解释为理性的信用利差。更有可能的是,这反映了一些投资者对终极安全资产回报的不敏感。近年来欧洲存款和国库券之间利差的缩小可能表明,这种“不惜一切代价”的安全需求正在缩小。(1970年代和80年代,一月期的平均利差超过160个基点,但在1990年代仅为73个基点)
Figures 11 and 12 offer further evidence of the risk premium from other bond markets. We compare yields and returns in the one- to three-year maturity subsector and the seven- to ten-year maturity subsector of each market. Data availability restricts the analysis to the past decade. Figure 11 shows that the reward for duration extension in the corporate bond market is somewhat lower than in the Treasury market. However. this conclusion is subject to several reservations: (1) the duration difference between the short and long maturity subsector is smaller in the corporate bond market than in the Treasury market: (2) the yields in Figure 11 ignore the impact of the bonds' option features (negative convexity); and (3) both the yield spreads and the return premia may be biased because different sectors have different industry structures.[16]
图11和12进一步证明了其他债券市场的风险溢价。我们比较了每个市场的一到三年期和七到十年期的收益率和回报率。数据可用性限制了对过去十年的分析。图11显示,公司债券市场增加久期的回报略低于国债市场。然而。这个结论有几个保留意见:(1)短期和长期债券的久期差异在公司债券市场比在国债市场要小;(2)图11的收益率忽略了债券的期权特征(负凸度);(3)由于不同行业具有不同的行业结构,利差和回报溢价均可能有偏差。
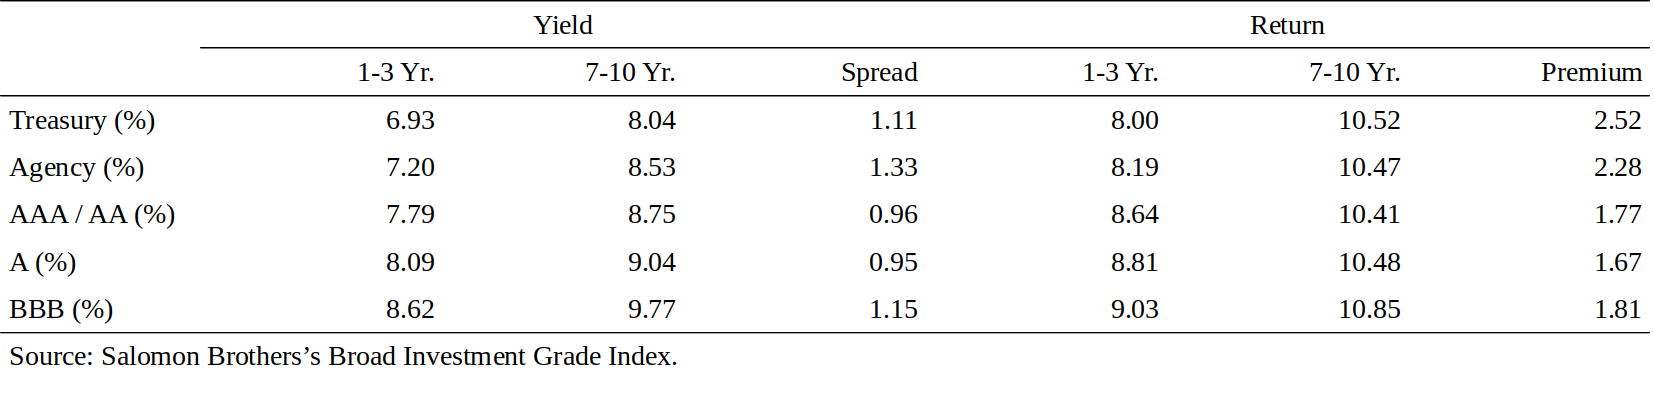
Figure 11. Average Yield Spread and Return Premium in Various U.S. Bond Market Sectors, 1985-94
Figure 12 shows local currency yields and returns in eight countries' government bond markets. Yield spreads and return premia are positive almost everywhere, but lower than in the United States. In most countries, the average return premium is higher than the average yield spread; the capital gains caused by long-term bonds' yield decline between 1985 and 1994 augment the premium. Clearly, the past decade offered a favorable environment for bondholders, except in Germany and the Netherlands.[17] Unfortunately, few government bond markets outside the United States are liquid at very short durations; thus, we cannot study whether the return curves in countries other than the United States have the concave shape of the average return curve in Figure 1.[18]
图12显示了8个国家政府债券市场的本币收益率和回报率。利差和回报溢价几乎总是正的,但低于美国的。在大多数国家,平均回报溢价高于平均利差;1985年至1994年期间长期债券收益率下降带来的资本回报增加了溢价。显然,除德国和荷兰外,过去十年为债权人提供了有利的环境。不幸的是,美国以外的政府债券市场很短久期的债券缺少流动性;因此,我们不能研究美国以外的国家的回报曲线是否具有上凸的形状。
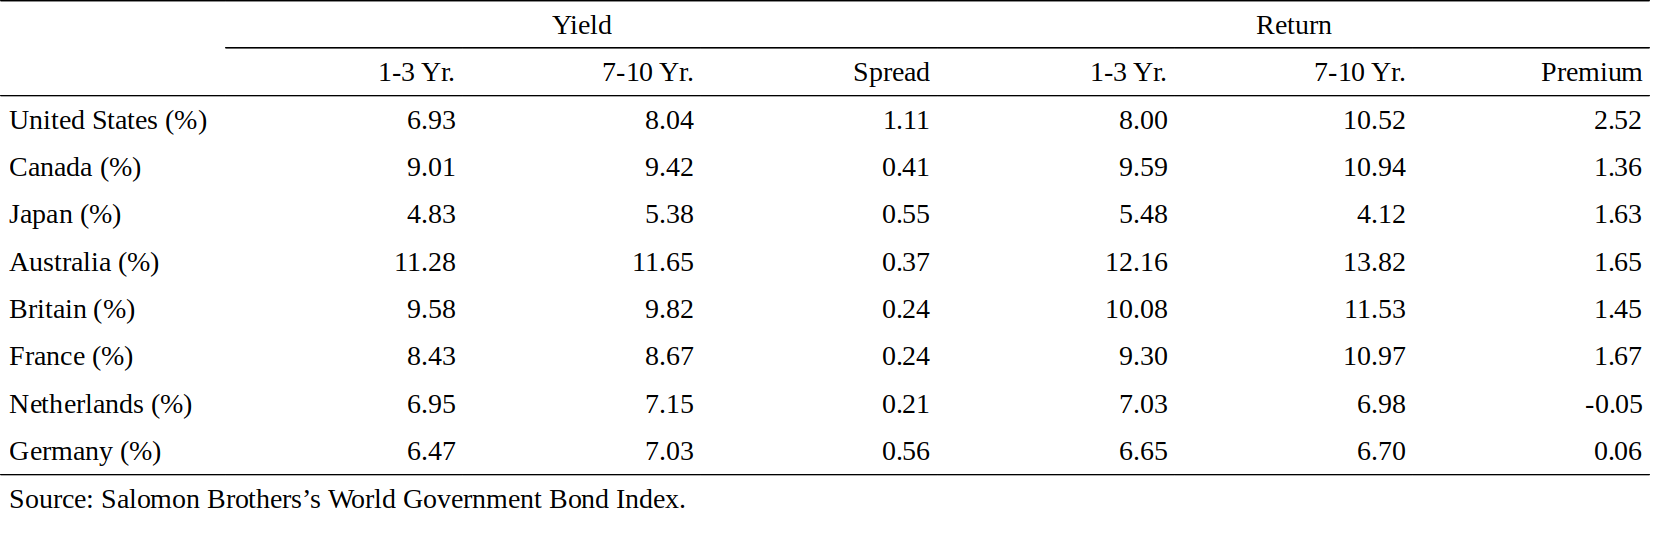
Figure 12. Average Yield Spread and Return Premium in International Government Bond Markets, 1985-94
CONCLUSIONS AND EXTENSIONS
结论与扩展
What Is the Best Estimate of the Long-Run Bond Risk Premium Today?
当前长期债券风险溢价的最佳估值是多少?
Any statements about the expected risk premium are partly subjective because expectations are not directly observable. Thus, caution is warranted when interpreting the empirical findings. However, we can draw some general conclusions. The US Treasury market does reward duration risk, but expected returns do not increase linearly with duration (or even with return volatility). The reward for duration extension is high at the front end of the Treasury curve (almost 200 basis points from the one-month to the two-year duration), but after two years, the expected return curve appears quite flat.
关于预期风险溢价的任何声明都是部分主观的,因为预期不能直接观察。因此,在解释实证结果时要谨慎。但是,我们可以得出一些一般性结论。美国国债市场确实奖励久期风险,但预期回报不会随久期线性变化(或者随回报波动率)。在国债曲线前端,久期增加带来的回报高(从一月期至两年期差距近200个基点),但两年期之后,预期回报曲线看起来相当平坦。
We argue that the numbers in Figure 5 are our best estimates of the long-run bond risk premium in the US Treasury market. If we can take these numbers at face value, yield curve analysts can subtract each maturity's risk premium from today's yield curve and, after adjusting for the rolldown effect and the convexity bias, infer the market's expectations of future rates. However, this approach is not valid if the risk premium varies over time.
我们认为图5中的数字是我们对美国国债市场长期债券风险溢价的最佳估计。如果我们可以把这些数字以面值来计算,收益率曲线分析师可以从当前的收益率曲线中减去每个期限的风险溢价,并且在调整下滑效应和凸度偏差之后,推断市场对未来收益率的预期。然而,如果风险溢价随时间而变化,则此方法无效。
While expected returns do not always increase with duration, short-run return volatility always does. This finding has important implications for fixed-income investors. If an investor has a short investment horizon and he is averse to the short-run fluctuations in bond returns, he has little incentive to extend the long-run benchmark duration beyond two years. Of course, long-duration bonds are good investments for investors who have long-duration liabilities or an otherwise long investment horizon. In addition, long-duration bonds may be excellent tactical investments if an investor can identify in advance periods of declining interest rates or if the yield curve is abnormally steep beyond the two-year maturity.
虽然预期回报并不总是随着久期而增加,但短期回报波动率总是如此。这一发现对固定回报投资者有重要的影响。如果投资者的投资期短,债券回报短期的波动是不利的,他几乎没有动力将长期基准久期增加到两年以上。当然,长久期债券对长久期负债或长期投资期限的投资者来说都是一个很好的投资。此外,如果投资者可以提前确定收益率下降的情况,或者如果收益率曲线在两年期之后异常陡峭,那么长久期债券可能是优秀的战术投资。
Another major finding is that the shortest Treasury bills appear to be systematically overpriced. In particular, the one-month bill has offered quite consistently a 100 basis point lower return than the more liquid three-month bill or other high-quality one-month papers in the money market.[19] Substituting longer bills or other money market instruments for the one-month bills in a portfolio may well provide the best reward-to-risk ratio in all capital markets.
另一个主要发现是,最短期的国库券似乎被系统地高估。特别是,一月期的国库券相对于货币市场中流动性更好的三月期国库券或其他高质量的一月期资产,一直存在100个基点的利差。在所有资本市场中,将长期国库券或其他货币市场工具替代投资组合中的一月期国库券可能会提供最佳的回报-风险比。
Will the Bond Risk Premium Be Different in the Future?
债券风险溢价将来会不同?
We conclude with some observations about the stability of these risk premium estimates. Realistically, the long-run bond risk premium will change over time. It probably has changed quite a bit during the past 40 years. Figure 13 shows that many plausible measures of long-term bonds' riskiness[20] were low until the mid-1960s and then rose systematically for 15 years. However. this fact is only known with the benefit of hindsight. Surely, the bond investors of the 1950s and 1960s were not demanding as high a risk premium as today's bond investors are. Part of the US bond market's poor performance in the 1960s and 1970s probably reflects the reassessment of the market's riskiness, which increased the required risk premium and thus (initially) led to higher yields and lower bond prices. Now that this major reassessment is over, bondholders can "enjoy" the higher expected returns. In fact, opposite forces may have helped the bond markets in the past decade. Inflation rates have declined and bond volatility has subsided. In addition to the reduced risk, structural changes may be lowering the long-run bond risk premium that the market offers, such as:
我们得出一些关于这些风险溢价估计的稳定性的观察结论。实际上,长期债券风险溢价会随着时间的推移而变化。在过去40年里,这可能已经发生了很大变化。图13显示,直到20世纪60年代中期,长期债券的风险很低,然后系统地上升了15年。然而,这个事实只是后见之明。当然,20世纪50年代和60年代的债券投资者并不像现在的债券投资者那样要求高风险溢价。美国债券市场在1960年代和1970年代表现不佳可能部分反映了市场风险的重新评估,这增加了相应的风险溢价,从而(最初)导致了更高的收益率和更低的债券价格。现在这个重估已经结束了,债券持有人可以“享受”更高的预期回报。事实上,过去十年来,相反的力量可能有助于债券市场。通货膨胀率下降,债券波动下降。除风险降低外,结构性变化可能会降低市场提供的长期债券风险溢价,如:
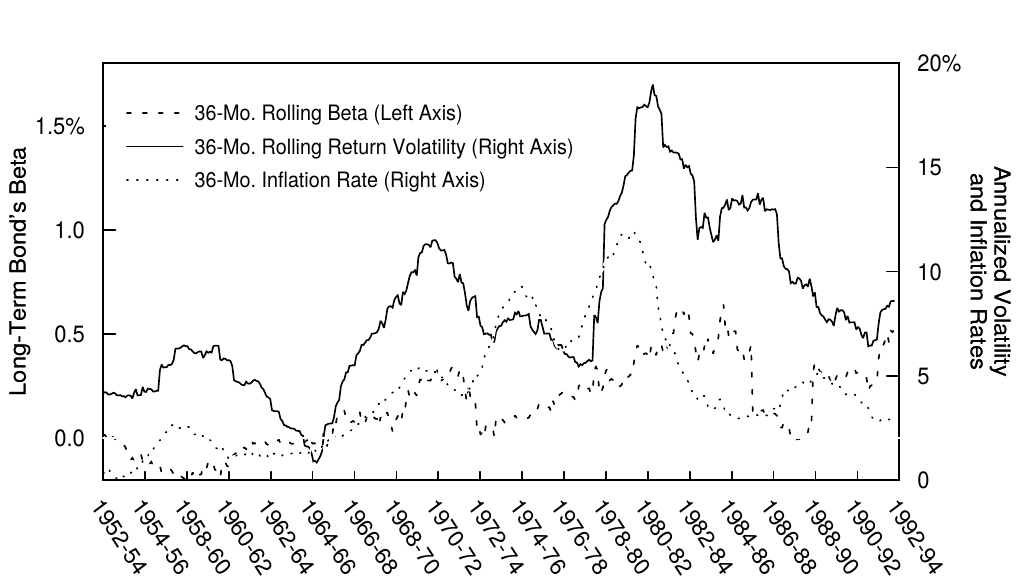
Figure 13. Reevaluating Long-Term Bond Riskiness, 1955-94
- The increasing importance of long-horizon investors who perceive the long-term assets as safe;
- 看好长期资产安全性的长期投资者日益重要;
- Strengthening anti-inflationary tendencies such as central bank independence and the discipline imposed by financial markets;
- 加强中央银行独立和金融市场纪律等抗通胀倾向;
- Risk-reduction caused by greater international diversification; and
- 由更大规模的国际多元化造成的风险降低;
- Improving liquidity.
- 提高流动性
The historical average risk premium is the optimal forecast of the future risk premium only if the required risk premium is constant over time. However, the above discussion shows that we expect the long-run risk premium to vary slowly when there are structural changes. In addition, the bond risk premium appears to fluctuate in a (short-run) cyclical fashion. As an introduction to the time-variation in expected returns, we offer a simple analysis in Figure 14.
只有当风险溢价随时间不变,历史平均风险溢价才是未来风险溢价的最佳预测。然而,上述讨论显示,当发生结构性变化时,我们预计长期风险溢价会缓慢变化。此外,债券风险溢价似乎以(短期)周期性方式波动。作为对预期回报时变性的介绍,我们在图14中提供了一个简单的分析。
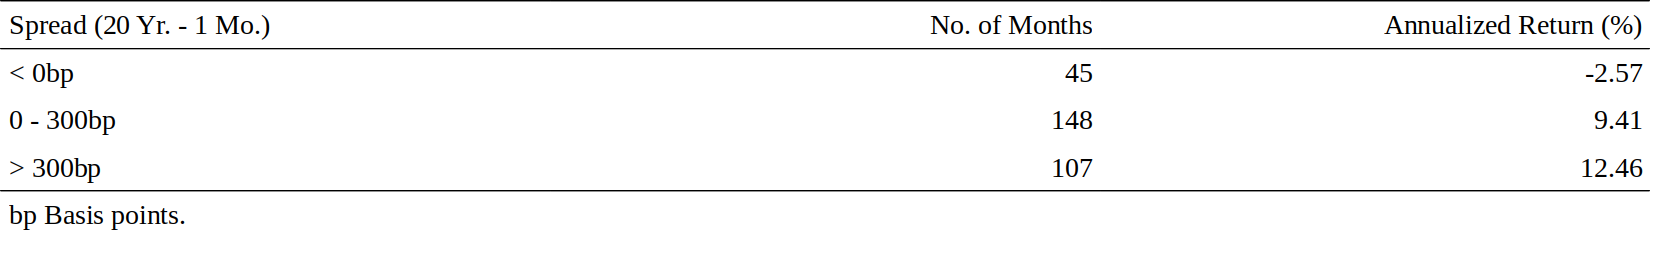
Figure 14. Average Return of the 20-Year Treasury Bond in Months that Begin with an Inverted, Mildly Upward-Sloping or Steep Yield Curve, 1970-94
The central question is whether we can identify, ex ante, periods when the near-term bond risk premium is particularly high or low. The most natural predictor is the steepness of the yield curve. Figure 14 shows that the curve shape has been able to distinguish good and bad times to invest in long-term bonds. Steep curves tend to be followed by abnormally high returns, and inverted curves tend to be followed by negative returns. These patterns have obvious investment implications, suggesting that strategies that adjust duration dynamically can produce superior long-run returns. We discuss the time-variation in the bond risk premium extensively in other papers (see "Literature Guide").
关键的问题是我们是否可以确定近期债券风险溢价特别高或低的时期。最自然的预测指标是收益率曲线的陡峭程度。图14显示,曲线形状已经能够区分投资长期债券的好坏时期。异常高的回报趋向于跟随陡峭的曲线,曲线倒挂之后往往是负的回报。这些模式具有明显的投资意义,表明动态调整久期的策略可以产生优异的长期回报。我们在其他论文中广泛讨论债券风险溢价的时变性(参见“文献指南”)。
APPENDIX: BOND RISK PREMIUM TERMINOLOGY
附录:债券风险溢价术语
We discuss bond yields, returns and risk premia from many different perspectives in our series of reports on the theme Understanding the Yield Curve. In this Appendix. we describe and motivate some key concepts and the terminology used throughout the series. We begin with a definition: The bond risk premium is the expected holding-period return of a long-term bond in excess of the riskless return of the one-period bond.
在《理解收益率曲线》的一系列报告中,我们从许多不同的角度讨论债券收益率、回报率和风险溢价。在本附录中。我们描述和强调了整个系列中使用的一些关键概念和术语。我们从一个定义开始:债券风险溢价是长期债券预期的持有期回报超过一(年)期债券的无风险回报的部分。
Why the name "bond risk premium"? Based on many academic theories, expected return differentials across bonds compensate for risk differentials across bonds. Nevertheless, we use the term ”bond risk premium" broadly to include any expected return differential over the riskless rate, whether it is caused by risk or by factors unrelated to risk. The term "bond risk premium" has many synonyms: interest rate risk premium; term premium; liquidity premium; and the more neutral "expected excess bond return."
为什么称“债券风险溢价”?基于许多学术理论,债券之间的预期回报差异弥补了债券之间的风险差异。然而,我们将“债券风险溢价”一词广泛地代指任何相对于无风险收益率的预期回报差异,无论是由风险或与风险无关的因素引起的。“债券风险溢价”一词具有许多同义词:收益率风险溢价、期限溢价、流动性溢价和更中性的“预期债券超额回报”。
Why return? Most investors are primarily interested in an investment's expected return, as opposed to its yield. For this reason, our analysis focuses on expected return differentials across bonds. Yield spreads do reflect these expected return differentials, but they also are influenced by other factors, such as the market's expectations about future rates. Furthermore, yields of different bonds are directly comparable only under restrictive conditions.
为什么用回报?大多数投资者主要对投资的预期回报感兴趣,而不是其收益率。因此,我们的分析侧重于债券的预期回报差异。利差确实反映了这些预期回报差异,但也受到其他因素的影响,如市场对未来收益率的预期。此外,不同债券的收益率只有在某些限定条件下才能直接比较。
Why excess return? It is useful to decompose any bond's holding-period return to the riskless return[21] over the holding period (reward for time), which is known in advance and common to all bonds, and to the excess return over the riskless rate (reward for risk or for bonds other characteristics), which is uncertain and may be specific to each bond. (Sometimes the excess bond returns are low even though bond returns are quite high, for example, when inflation and short-term rates are very high.)
为什么用超额回报?债券的持有期回报可以分解为持有期间的无风险回报(时间的回报),这是所有债券都是预先已知和共同的;以及超过无风险收益率的超额回报(对风险或债券其他特征的回报),这是不确定的,可能是针对具体每个债券的。(有时即使债券回报相当高,超额的债券回报却很低,例如在通胀和短期收益率都很高的时候)。
Why expected excess return? Realized returns have an expected part and an unexpected part. Active investors must try to earn high realized excess returns by capturing high expected excess returns, even though a large part of the realized excess returns is unexpected.[22]
为什么用预期超额回报?实现回报有可预期的部分和不可预期的部分。主动投资者必须通过捕捉高预期超额回报来获得高实现的超额回报,即使实现的超额回报的大部分是不可预期的。
Which holding-period return? In our theoretical analysis, we use annual holding periods because it simplifies the notation (because yields are expressed as percent per annum). In our empirical analysis, we focus on monthly holding periods, and we examine the excess returns of long-term bonds over the nominally riskless one-month rate.
哪个持有期的回报?在我们的理论分析中,我们使用年度持有期间,因为它简化了符号(因为收益率以百分比表示)。在我们的实证分析中,我们关注月度的持有期,检查长期债券超额回报超过一月期名义无风险收益率的部分。
How is the bond risk premium estimated? The answer to this question depends on the stability of the risk premium. If the risk premium is constant over time, a historical average return differential between the long-term bond and the riskless short-term bond is the best estimate of the future bond risk premium.[23] (Over a long sample period, the unexpected parts of the monthly returns should wash out, leaving only the expected return differential.) However, if the bond risk premium varies over time, we should use the information in the current yield curve and in other variables that describe current economic conditions to find out whether the near-term bond risk premium is abnormally high or low.[24] In Figure 14 of this report, we use the term spread as a crude measure of the information in the yield curve. A better measure would include the impact of the so-called rolldown return. The rolling yield differential between a long-term bond and the riskless rate is a proxy for the bond risk premium under the scenario of no change in the yield curve, but even this measure ignores the impact of convexity on expected returns. Finally, we can combine the information in the yield curve and in other predictor variables to develop an optimal forecast for the near-term bond risk premium. The other reports in this series discuss these topics in detail.
如何估计债券风险溢价?这个问题的答案取决于风险溢价的稳定性。如果风险溢价随时间不变,长期债券与无风险短期债券之间的历史平均回报差额是未来债券风险溢价的最佳估计。(在很长的抽样期,每月回报的非预期部分应该清除,只留下预期回报的差额。)然而,如果债券风险溢价随时间变化,我们应该使用当前收益率曲线和其他描述当前经济状况变量的信息,以了解近期债券风险溢价是否异常高或低。在本报告的图14中,我们使用利差作为收益率曲线中信息的粗略度量。一个更好的度量将包括所谓的下滑回报的影响。长期债券与无风险收益率之间的滚动收益率差异在收益率曲线没有变化的情况下代表了债券风险溢价,但即使这一度量也忽略了凸度对预期回报的影响。最后,我们可以将收益率曲线和其他预测变量中的信息结合起来,为近期债券风险溢价制定最优预测。本系列的其他报告详细讨论了这些主题。
LITERATURE GUIDE
文献指南
On the Historical Performance of the US Treasury Bonds with Various Maturities
关于不同期限美国国债的历史表现
- Fama, "Term Premiums in Bond Returns," Journal of Financial Economics, 1984.
- Ibbotson Associates, Stocks, Bonds, Bills, and Inflation 1993 Yearbook, 1994.
- Tyson, "Estimation of the Term Premium," in Fixed-Income Investment: Recent Research, ed. Ho, 1995.
On the Historical Behavior of the US Non-Government Money and Bond Market Behavior
关于美国非政府资金的历史行为和债券市场行为
- Fama, "Term Premiums and Default Premiums in Money Markets," Journal of Financial Economics, 1986.
- Litterman and Iben, "Corporate Bond Valuation and the Term Structure of Credit Spreads," Journal of Portfolio Management, 1991.
- Iwanowski and Chandra, "How Do Corporate Spread Curves Move Over Time?," Salomon Brothers Inc, July 1995.
On the Historical Performance of the Non-US Government Bond Markets
关于美国外国债市场的历史表现
- Bisignano, "A Study of Efficiency and Volatility in Government Securities Markets," Bank for International Settlements, 1987.
- Siegel and Kaplan, "Stocks, Bonds, Bills, and Inflation around the World," in Managing Institutional Assets, ed. Fabozzi, 1990.
On the Time-Variation in Expected Bond Returns .
关于债券预期回报的时变性
- Ilmanen, "Time-Varying Expected Returns in International Bond Markets," Journal of Finance, 1995.
- Ilmanen, "Forecasting US Bond Returns," Salomon Brothers Inc, 1995.
- Ilmanen, "When Do Bond Markets Reward Investors for Interest Rate Risk?," Journal of Portfolio Management (forthcoming), 1996.
In other words, they are risk averse and have a short investment horizon. An alternative and more subtle argument states that most investors have a vague investment horizon. If the horizon is so uncertain that it does not guide an investor's decision making and if he is more averse to price risk than to reinvestment risk, he is likely to bias the portfolio toward a short duration. Public accountability makes many investors more averse to price risk than to reinvestment risk. Erring toward a too-short duration exposes an investor "only" to reinvestment risk, which is akin to an opportunity cost. Erring toward a too-long duration exposes an investor to price risk, which is visible and, if realized, is more likely to cause a public outcry.
换句话说,他们规避风险并且投资期短。另一个更为微妙的论点说,大多数投资者的投资期限范围是模糊的。如果投资期限是不确定的,它就不能指导投资者的决策,如果投资者对价格风险的厌恶程度高于再投资风险,他很可能会将投资组合偏向短久期。公众问责制使得许多投资者对价格风险的厌恶程度高于再投资风险。过短的久期将使投资者面临再投资风险,这类似于机会成本。过长的久期会使投资者面临价格风险,这种风险是可见的,而且如果实现的话,更有可能引起公众的强烈抗议。 ↩︎In a sense, the long-horizon investors are fortunate to be in the minority among market participants; they earn a positive risk premium even though they might accept a lower yield for long-term bonds. Andre Perold and William Sharpe show that an investment strategy's long-run profitability is inversely related to its popularity in the marketplace: see "Dynamic Strategies for Asset Allocation," Financial Analysts Journal, January-February 1989.
从某种意义上说,长期投资者有幸在市场参与者中占有少数;即使可能接受长期债券的较低回报,他们也能获得正的风险溢价。Andre Perold 和 William Sharpe 表示,投资策略的长期盈利能力与其在市场上的受欢迎程度成反比:参见《Dynamic Strategies for Asset Allocation》(Financial Analysts Journal, January-February 1989)。 ↩︎However, these models specify a linear relation between expected returns and return volatility (or beta). A linear relation between expected returns and duration only follows if yields are equally volatile across the curve (because a bond's return volatility is approximately equal to its duration times the volatility of the yield changes). Empirically, however, the short-term rates tend to be more volatile than the long-term rates, making the return volatility increase by less than one-for-one with duration. Because return volatilities are somewhat concave as a function of duration, also expected returns (and bond risk premia) should be somewhat concave as a function of duration.
然而,这些模型指定了预期回报和回报波动率(或\(\beta\))之间的线性关系。预期回报和久期之间的线性关系只有在不同期限上波动率相等时才会发生(因为债券的回报波动率近似等于其久期乘以收益率变动的波动率)。然而,从经验上看,短期收益率往往比长期收益率波动性更大,使得回报波动率随着久期的增加而减小。因为回报波动率是有时候是久期的上凸函数,所以预期回报(和债券风险溢价)作为久期的函数也应该是有点上凸的。 ↩︎In these models, bad times are associated with a high marginal utility of a dollar. Intuitively, a dollar is more valuable when you are hungry and poor. For the economy as a whole, periods of high marginal utility ("bad times") may coincide with recessions.
在这些模型中,坏时期与一美元的高边际效用相关联。直觉上讲,当你又饿又穷时,一美元更有价值。对于整个经济体而言,高边际效用的时期(“坏时期”)可能与经济衰退相吻合。 ↩︎However, more liquid bonds have two advantages over less liquid bonds that may offset their lower yield and expected cheapening (as they lose their liquidity premium). First, liquid bonds are more often "special" in the repo market; thus, they offer a financing advantage. Second, their smaller bid-ask spread can be viewed as an option to trade at small transaction costs.
然而,流动性好的债券比流动性差的债券有两个优势,这可能抵消其较低的收益率和预期的低估值(因为它们失去了流动性溢价)。首先,流动性好的债券在回购市场中往往是“特殊的”;因此,它们提供融资优势。第二,他们较小的买卖价差可被视为以较小交易成本进行交易的期权。 ↩︎The expected rise in a long-term bond's yield will cause a capital loss that exactly offsets the bond's initial yield advantage over the short-term bond. The capital loss equals the product of the bond's expected yield rise and its duration —— if we ignore the convexity bias (which we discuss in other parts of this series).
预期长期债券收益率的上涨将导致资本损失,正好抵消了相对于短期债券的初始收益率优势。资本损失等于债券预期收益率上升幅度与久期的乘积——如果我们忽略了凸度偏差(我们将在本系列其他部分中讨论)。 ↩︎Even if the historical average risk premium is the optimal predictor of the long-run future risk premium, it is not the optimal predictor of the near-term risk premium unless the risk premium is constant over time. However, many recent studies show that the bond risk premium varies over time. At the end of this report, we present simple evidence that illustrates the time-variation in the risk premium.
历史平均风险溢价是长期未来风险溢价的最优预测,但不是近期风险溢价的最优预测,除非风险溢价不随时间而变化。然而,最近的许多研究表明,债券风险溢价随时间而变化。在本报告末尾,我们提供简单的证据以说明风险溢价的时变性。 ↩︎The earliest reasonable starting year would be 1952 in order to exclude a period of regulated long-term rates from the sample. The 1952-94 sample period would be somewhat less relevant and, because of the rising rates, much less neutral than the 1970-94 period.
最早合理的起始年份是1952年,以排除从样本中管制的长期收益率。由于收益率上升,1952-94年的样本期不太合适,不如1970-94年那样中性。 ↩︎The CRSP series have been updated with Salomon Brothers data for 1994.
1994年的 CRSP 数据由 Salomon Brothers 更新。 ↩︎It is widely known that interest rate volatility was exceptionally high between 1979 and 1982, when the Federal Reserve did not target the short-term rate behavior. Over the past decade, volatilities have been lower and the term structure of volatility has been flatter than in Figure 3. For the 1985-94 period, the volatilities of all maturity rates between three months and 20 years are 1.1%-1.3% (110-130 basis points), peaking at intermediate maturities.
众所周知,1979年至1982年期间,美联储并没有盯住短期收益率行为,收益率波动特别大。在过去十年中,波动率变得更低,波动率期限结构比图3更平坦。在1985-94年期间,三月至二十年期所有期限的波动率分别为1.1%-1.3%(110-130个基点),在中期达到最高。 ↩︎The arithmetic mean (AM) and geometric mean (GM) are computed using the following equations: \(AM = (h_1 + h_2 + \cdots + h_N) / N\); \(GM = [(1+h_1)*(1+h_2)*\cdots (1+h_N)]^{1/N} - 1\), where h are one-period holding-period returns and N is the sample size. The geometric mean is less than or equal to the arithmetic mean, and the difference increases with the return volatility. The geometric mean is the correct number to use in historical analysis. It is harder to say which number is relevant when describing the future prospects of a given strategy. The arithmetic mean is the mathematically correct measure of expected return, while the geometric mean better represents a typical outcome (median). For further discussion, see "What Practitioners Need to Know about Future Value," Kritzman, Financial Analysts Journal, May-June 1994.
算术平均(AM)与几何平均(AM)定义如下:\(AM = (h_1 + h_2 + \cdots + h_N) / N\);\(GM = [(1+h_1)*(1+h_2)*\cdots (1+h_N)]^{1/N} - 1\),其中 h 为一(年)期持有期回报,N为样本量。几何平均值小于等于算术平均值,差值随回报波动率增加。使用几何平均数是历史分析中的正确方式。在描述给定策略的未来前景时,很难说哪个方法是合适的。算术平均值是数学上预期回报的正确度量,而几何平均值更好地代表了一个典型的结果(中位数)。有关进一步讨论,请参阅《What Practitioners Need to Know about Future Value》(Kritzman, Financial Analysts Journal, May-June 1994)。 ↩︎In the earlier academic analysis of the average bond risk premium, long-term bonds perform even more poorly. Fama (1984) finds that over the 1953-82 period, average returns peak at the 12- to 18-month maturity. Fama's sample period was, however, clearly inflationary and thus "bearish"; as explained above, the 1970-94 period is more neutral.
在早期关于平均债券风险溢价的学术分析中,长期债券表现较差。Fama(1984)发现,在1953-82年期间,平均回报在12月至18月期达到高峰。然而,Fama 的样本期明显处于通货膨胀期,因此是“看跌”的;如上所述,1970-94年期更为中性。 ↩︎Incidentally, the t-statistics of the excess returns are five times larger than the Sharpe ratios (given a sample of 300 months); thus, most bonds have statistically significant positive excess returns.
顺便说一句,超额回报的t统计量比夏普比例高出五倍(给定300个月的样本);因此,大多数债券具有统计上显着的正超额回报。 ↩︎It is also worth noting that return volatility peaked in the early 1980s even though bond durations were at their lowest (because of high yield levels). Thus, the increased yield volatility more than offset the risk-reducing impact of higher yields on bond durations.
还值得注意的是,尽管债券久期最低(因为高回报水平),1980年代初期的回报波动率却达到顶峰。因此,增加的收益率波动性抵消了高收益率对债券久期的风险降低影响。 ↩︎An alternative explanation is that returns are not symmetrically distributed. Even if long-term bonds outperform short-term bonds 60% of the time, it is conceivable that the negative returns of long-term bonds are rare but severe, leading to the same average returns as for the short-term bond.
另一个解释是回报不是对称分布的。由于60%以上的时间里长期债券的表现优于短期债券,可以想象长期债券的负回报是罕见但严重的,这导致与短期债券的平均回报相同。 ↩︎In general, more creditworthy borrowers are able to issue longer-term debt. In the US corporate bond market, the (relatively safe) public utilities are important issuers of long-term debt, while the (more risky) financial companies typically issue short-term debt. These issuance patterns flatten the term structure of aggregate corporate credit spreads.
一般来说,更有信誉的借款人能够发行长期债务。在美国公司债券市场,(相对安全)的公用事业是长期债务的重要发行人,而(更有风险)的金融公司通常发行短期债务。这些发行模式使整体企业信用利差的期限结构平坦化。 ↩︎Analysis of average returns is notoriously sensitive to the chosen sample period. The period specificity is illustrated well by the fact that an extensive historical study by Bisignano (1987) identified Germany as the country with the highest reward for maturity extension. Bisignano used bond market data between the 1960s and mid-1980s. Rising rates caused by the German reunification have now pushed the former star performer to near the bottom of the ladder.
平均回报分析对所选择的样本期是非常敏感的。由 Bisignano(1987)进行的广泛的历史研究认为德国是对期限延长奖励最高的国家,这一研究很好地证实了时段特异性。Bisignano 在1960年代至80年代中期使用债券市场数据。由德国统一引起的收益率上涨,现在已经将从前的明星推到了末尾。 ↩︎One-month Eurodeposit rates are available for all eight countries, however. The average annual returns from rolling over these deposits are 6.68%, 8.92%, 5.19%, 12.34%, 10.98%, 9.44%, 6.99%, and 6.66%, respectively. Thus, the average premium of the one- to three-year government bond sector over the one-month Eurodeposits was negative in four of the eight countries. The average return curves in other countries than the United States appear to have different shapes than Figure 1, but we stress that ten years is quite short period for this type of analysis and that the comparison is contaminated by the use of default-risky data. Further analysis is clearly needed.
然而,一月期的欧洲存款收益率可以适用于所有8个国家。滚动持有策略的平均年回报率分别为6.68%、8.92%、5.19%、12.34%、10.98%、9.44%、6.99%、6.66%。因此,八个国家中的四个国家,一至三年期政府债券相对与一月期欧洲存款收益率的平均溢价为负。与美国相比,其他国家的平均回报曲线似乎与图1不同,但我们强调,对于这种分析来说十年的时间相当短,并且这种比较被违约风险数据所污染。显然需要进一步分析。 ↩︎The wide credit spreads at the front end imply that it is not easy to exploit the positive risk premium. A simple strategy of purchasing leveraged two-year notes will lose a large part of its profits when the borrowing is done at a private-issuer rate and not at a Treasury bill rate. Because most arbitrageurs must borrow at the private-issuer rate, they cannot eliminate the overpricing of short-term Treasury bills; only the holders of the expensive bills or the government can do it (by selling or by issuing more bills).
前端扩大的信用利差意味着利用正的风险溢价是不容易的。购买加杠杆的两年期票据的简单策略将损失大部分利润,如果借款以私人发行收益率,而不是以国库券收益率的方式进行。因为大多数套利者必须以私人发行收益率借款,不能消除短期国库券的高估价;只有昂贵的国库券持有人或政府才能做到这一点(通过出售或发行更多的国库券)。 ↩︎The figure shows the 20-year bond's annualized return volatility and its sensitivity (beta) to US stock market returns as well as the recent 36 months' annualized inflation rate. Many market participants think that bond risk (and not just losses from bond holdings) increases with the inflation level because inflation uncertainty appears to increase with the inflation level.
该图显示了20年期债券的年化回报波动率及其对美国股市回报以及最近36个月的通货膨胀率的敏感度(\(\beta\))。许多市场参与者认为,债券风险(而不仅仅是债券的损失)随通货膨胀水平而增加,因为通货膨胀的不确定性似乎随着通货膨胀水平的增加而增加。 ↩︎We measure the riskless return by the return of the Treasury bill that matures at the end of the horizon (holding period). This return is nominally riskless because the bill's holding-period return is known from its price today and its known maturity value (100). Treasury issues are perceived to be default-free but they have some purchasing power (or inflation) risk.
我们通过在期限结束(持有期)到期的国库券回报来衡量无风险回报。该回报名义上是无风险的,因为该国库券的持有期回报是从今天的价格及其已知的到期价值(100)得知的。国债被认为是无违约的,但具有一定的购买力(或通货膨胀)风险。 ↩︎We sometimes add the redundant word "expected" before bond risk premium to emphasize the distinction between the expected bond risk premium and the realized bond risk premium (or equivalently, between the expected excess return and the realized excess return). We may also use the term "required return" instead of expected return, because the latter term may have a misleading optimistic connotation; in reality, expected bond returns are more likely to be high in bad times when investors require a high risk premium for holding risky assets.
我们有时在债券风险溢价之前加上冗余的“预期”两字,以强调预期的债券风险溢价与实现的债券风险溢价之间的区别(同样的,预期的超额回报与实现的超额回报之间的区别)。我们也可以使用“要求的回报”而不是预期的回报,因为后一个术语可能会有误导性的乐观内涵;实际上,当投资者对所持有的风险资产要求高风险溢价时,预期债券回报更有可能在坏时期变高。 ↩︎A further question is whether we should use an arithmetic or a geometric average of the monthly returns, or perhaps an arithmetic average of the continuously compounded returns.
另一个问题是我们是否应该使用每月回报的算术或几何平均值,或者是连续复合回报的算术平均值。 ↩︎A historical average of excess bond returns may still be an excellent forecast for the long-run expected excess bond return (relevant for strategic investment decisions) but not the optimal forecast for the near-term excess bond return. The near-term and the long-run forecasts are equal only if the bond risk premium is constant over time.
债券超额回报的历史平均值仍可能是长期预期债券超额回报(与战略投资决策相关)的良好预测,但不是近期债券超额回报的最佳预测。只要债券风险溢价随时间不变,近期和长期的预测是相等的。 ↩︎

