一个简单的性能计数器:CodeTimer
2009-03-10 09:03 Jeffrey Zhao 阅读(48090) 评论(77) 编辑 收藏 举报有数据,有真相,相信大家在平时的工作或学习过程中,都需要比较几种不同方法或实现之间的性能差距。在这些时候,往往就需要我们不断地创建Stopwatch,打开,关闭,然后打印时间。这种一遍又一遍的重复终有一天会让人忍无可忍,因此如果能有一个“标准”的性能计数器,那应该可以让生活轻松许多。这个性能计数器不用复杂,够用就好;也不需要考虑扩展性,要扩展时直接修改代码就够了;同样不需要考虑输出格式,直接打印在Console就行。
在上次的.NET技术大会中,Jeffrey Richter大叔在Keynote Session中进行了一个名为“The Performance of Everyday Things”的主题演讲,展示了各种常用编程元素之间的性能对比。在演示中他使用了一个名为CodeTimer的简单计数器,用于统计每种做法的性能。可惜翻遍了每个地方都没发现JR大叔在哪里公开了这个计数器的实现。算了,那么就凭着印象写一个出来吧,反正也不复杂。
总的来说,CodeTimer有两个公开方法,一个是Initialize,一个是Time:
public static class CodeTimer
{
    public static void Initialize()
    {
        Process.GetCurrentProcess().PriorityClass = ProcessPriorityClass.High;
        Thread.CurrentThread.Priority = ThreadPriority.Highest;
        Time("", 1, () => { });
    }

    public static void Time(string name, int iteration, Action action)
    {
        ...
    }
}
CodeTimer.Initialize方法应该在测试开始前调用。首先它会把当前进程及当前线程的优先级设为最高,这样便可以相对减少操作系统在调度上造成的干扰。然后调用一次Time方法进行“预热”,让JIT将IL编译成本地代码,让Time方法尽快“进入状态”。Time方法则是真正用于性能计数的方法,实现如下:
public static void Time(string name, int iteration, Action action)
{
    if (String.IsNullOrEmpty(name)) return;

    // 1.
    ConsoleColor currentForeColor = Console.ForegroundColor;
    Console.ForegroundColor = ConsoleColor.Yellow;
    Console.WriteLine(name);

    // 2.
    GC.Collect(GC.MaxGeneration, GCCollectionMode.Forced);
    int[] gcCounts = new int[GC.MaxGeneration + 1];
    for (int i = 0; i <= GC.MaxGeneration; i++)
    {
        gcCounts[i] = GC.CollectionCount(i);
    }

    // 3.
    Stopwatch watch = new Stopwatch();
    watch.Start();
    ulong cycleCount = GetCycleCount();
    for (int i = 0; i < iteration; i++) action();
    ulong cpuCycles = GetCycleCount() - cycleCount;
    watch.Stop();

    // 4.
    Console.ForegroundColor = currentForeColor;
    Console.WriteLine("\tTime Elapsed:\t" + watch.ElapsedMilliseconds.ToString("N0") + "ms");
    Console.WriteLine("\tCPU Cycles:\t" + cpuCycles.ToString("N0"));

    // 5.
    for (int i = 0; i <= GC.MaxGeneration; i++)
    {
        int count = GC.CollectionCount(i) - gcCounts[i];
        Console.WriteLine("\tGen " + i + ": \t\t" + count);
    }

    Console.WriteLine();
}

private static ulong GetCycleCount()
{
    ulong cycleCount = 0;
    QueryThreadCycleTime(GetCurrentThread(), ref cycleCount);
    return cycleCount;
}

[DllImport("kernel32.dll")]
[return: MarshalAs(UnmanagedType.Bool)]
static extern bool QueryThreadCycleTime(IntPtr threadHandle, ref ulong cycleTime);

[DllImport("kernel32.dll")]
static extern IntPtr GetCurrentThread();
Time方法接受三个参数,名称,循环次数以及需要执行的方法体。打印出花费时间,消耗的CPU时钟周期,以及各代垃圾收集的回收次数。具体实现分几个步骤,如下:
- 保留当前控制台前景色,并使用黄色输出名称参数。
- 强制GC进行收集,并记录目前各代已经收集的次数。
- 执行代码,记录下消耗的时间及CPU时钟周期1。
- 恢复控制台默认前景色,并打印出消耗时间及CPU时钟周期。
- 打印执行过程中各代垃圾收集回收次数。
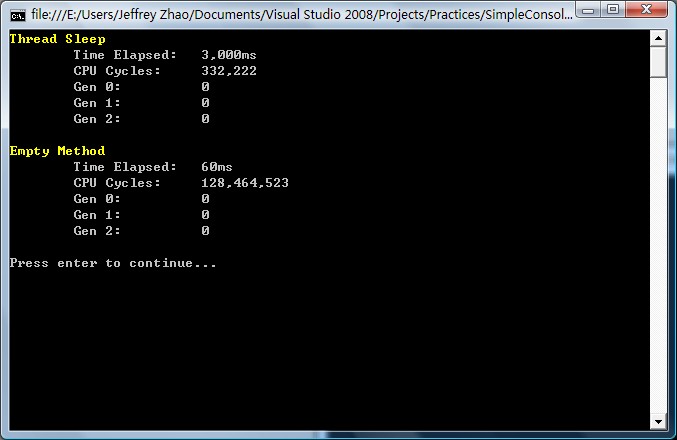
与传统计数方法相比,这段代码还输出了更多信息:CPU时钟周期及各代垃圾收集回收次数。CPU时钟周期是性能计数中的辅助参考,说明CPU分配了多少时间片给这段方法来执行,它和消耗时间并没有必然联系。例如Thread.Sleep方法会让CPU暂时停止对当前线程的“供给”,这样虽然消耗了时间,但是节省了CPU时钟周期:
CodeTimer.Time("Thread Sleep", 1, () => { Thread.Sleep(3000); });
CodeTimer.Time("Empty Method", 10000000, () => { });
结果如下:
而垃圾收集次数的统计,即直观地反应了方法资源分配(消耗)的规模:
int iteration = 100 * 1000;

string s = "";
CodeTimer.Time("String Concat", iteration, () => { s += "a"; });

StringBuilder sb = new StringBuilder();
CodeTimer.Time("StringBuilder", iteration, () => { sb.Append("a"); });
结果如下:

老赵最近在研究一个问题的几种不同做法在性能上的优劣,其中CodeTimer起到了很重要的作用——这边也先卖个关子,接下来老赵也将会写几篇文章来讲解这个问题。
注1:统计CPU时钟周期时使用P/Invoke访问QueryThreadCycleTime函数,这是Vista和Server 2008中新的函数。感谢装配脑袋在这里提供的帮助。
注2:对于.NET 2.0及Vista以下操作系统,请参考《对老赵写的简单性能计数器的修改》

