
【822】GeoPandas 绘图,专题图绘制
参考:geopandas.GeoDataFrame.plot
参考:geopandas,用python分析地理空间数据原来这么简单!
参考:「GIS教程」Python-GeoPandas地图、专题地图绘制
1. 基本地图显示
import pandas as pd
import geopandas
import matplotlib.pyplot as plt
%matplotlib inline

world = geopandas.read_file(geopandas.datasets.get_path('naturalearth_lowres'))
# 加上末尾的分号,不会先是某行文字
world.plot(figsize=(20,10));
2. 显示地图边界线
world.boundary.plot(figsize=(20,10))
3. 专题地图显示
- 属性对应的列
- 选择地图的颜色模式
- 显示大小
- 边界颜色
# remove the record of Antarctica
world = world[(world.pop_est>0) & (world.name!="Antarctica")]
# add a new column "gdp_per_cap"
world['gdp_per_cap'] = world.gdp_md_est / world.pop_est
# show the world map based on "gdp_per_cap", different colors, with black edge
world.plot(column='gdp_per_cap', cmap='OrRd', figsize=(20,10), edgecolor="black");
4. 专题地图加入图例
# Plot population estimates with an accurate legend
import matplotlib.pyplot as plt

fig, ax = plt.subplots(1, 1, figsize=(20,12))

world.plot(column='gdp_per_cap',
           ax=ax,
           cmap='OrRd',
           edgecolor='black',
           legend=True,
           legend_kwds={'label': "GDP per capita by Country", 'orientation': "horizontal"});
fig, ax = plt.subplots(1, 1, figsize=(20,6))

world.plot(column='gdp_per_cap',
           ax=ax,
           cmap='OrRd',
           edgecolor='black',
           legend=True,
           legend_kwds={'label': "GDP per capita by Country", 'orientation': "vertical"});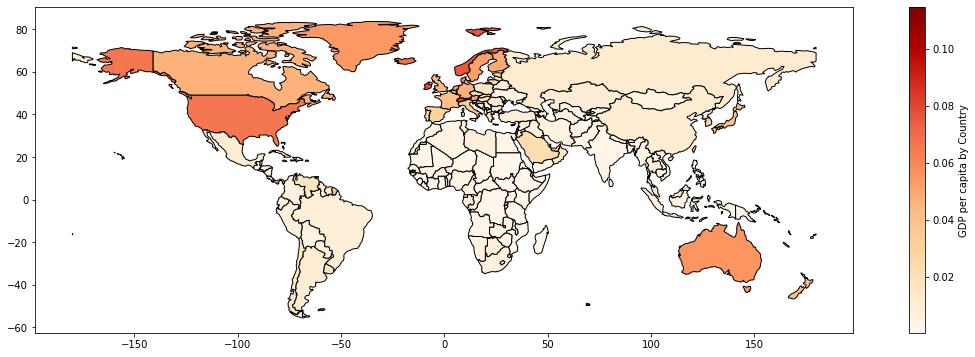
5. 多图层显示
cities = geopandas.read_file(geopandas.datasets.get_path('naturalearth_cities'))

base = world.plot(color='#CCFFE5', edgecolor='black', figsize=(20,8))
cities.plot(ax=base, marker='o', color='red', markersize=10);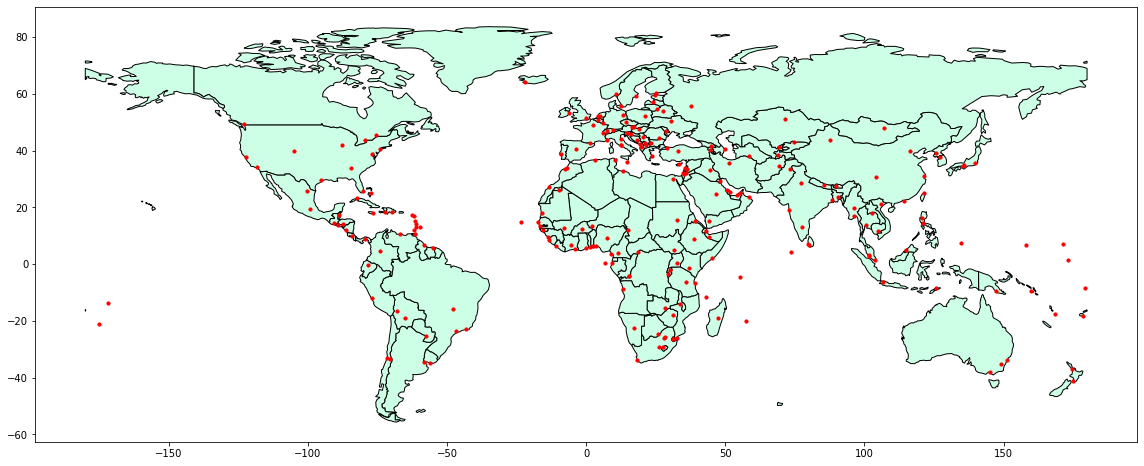
6. 图例、标题、经纬网显示
world = geopandas.read_file(geopandas.datasets.get_path('naturalearth_lowres'))

# remove the record of Antarctica
world = world[(world.pop_est>0) & (world.name!="Antarctica")]
# add a new column "gdp_per_cap"
world['gdp_per_cap'] = world.gdp_md_est / world.pop_est
# show the world map based on "gdp_per_cap", different colors, with black edge
world.plot(column='gdp_per_cap',
           scheme='quantiles',
           legend=True,
           legend_kwds={"loc": "lower left"},
           cmap='OrRd',
           figsize=(20,10),
           edgecolor="black")

# show the title
plt.title('Python - GPD Per Cap World Map', fontsize=18, fontweight='bold')

# show the grid
plt.grid(True, alpha=0.5)

# save the figure
plt.savefig('GDP_per_cap_world_map.png', dpi=300);
7. 地图上面的文字显示
reg02 = world.copy()
reg02['coords'] = reg02['geometry'].apply(lambda x: x.representative_point().coords[0])

# create a map based on the name, so they all have different colours
reg02.plot(figsize=(20, 10),
           column='name',
           legend=False,
           cmap='Pastel1_r',
           edgecolor='k')

# show every country's name
for n, i in enumerate(reg02['coords']):
    if n == 159: continue # this record is wrong and will raise errors
    area = reg02.loc[n, 'geometry'].area
    if area > 200:
        plt.text(i[0], i[1], reg02['name'][n], fontsize=9, horizontalalignment="center")

# show the title
plt.title('Python - World Map', fontsize=18, fontweight='bold')

# show the grid
plt.grid(True, alpha=0.5)

# save the figure
plt.savefig('world_map.png', dpi=300);

 浙公网安备 33010602011771号