
用highcharts展现你的数据
摘要:
前面已经分享过图表插件,今天在来将下如何使用highcharts来绘制图表。highcharts支持在线定制,你可以选择你所需要的模块,然后点击build就会生成一个js文件链接,右键保存到本地酒可以在项目中使用了。highcharts支持多种图表,如折线、饼状、柱状等等,可以去官网查看(英文、中文)。并且你可以打印图表或者以PNG、JPEG、PDF、SVG格式下载,你可以从官网下载示例。
charts:
highcharts提供了很多功能,你可以在图上显示节点数据,或者当鼠标悬上时提示。支持多种形状的节点标签,异步加载数据。
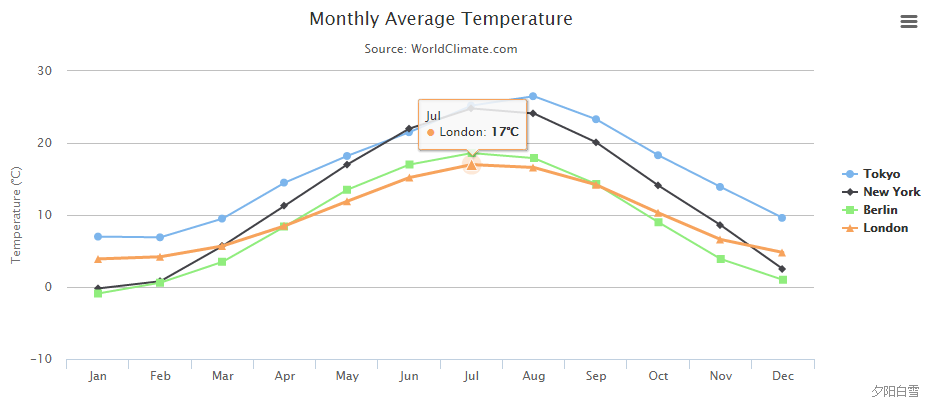


<!DOCTYPE HTML>
<html>
    <head>
        <meta http-equiv="Content-Type" content="text/html; charset=utf-8">
        <title>Highcharts Example</title>

        <script type="text/javascript" src="http://ajax.googleapis.com/ajax/libs/jquery/1.8.2/jquery.min.js"></script>
        <style type="text/css">
${demo.css}
        </style>
        <script type="text/javascript">
$(function () {
    $('#container').highcharts({
        credits: {
            text: '夕阳白雪',
            href: 'www.cnblogs.com/xiyangbaixue'
        },
        title: {
            text: 'Monthly Average Temperature',
            x: -20 //center
        },
        subtitle: {
            text: 'Source: WorldClimate.com',
            x: -20
        },
        xAxis: {
            categories: ['Jan', 'Feb', 'Mar', 'Apr', 'May', 'Jun',
                'Jul', 'Aug', 'Sep', 'Oct', 'Nov', 'Dec']
        },
        yAxis: {
            title: {
                text: 'Temperature (°C)'
            },
            plotLines: [{
                value: 0,
                width: 1,
                color: '#808080'
            }]
        },
        tooltip: {
            valueSuffix: '°C'
        },
        legend: {
            layout: 'vertical',
            align: 'right',
            verticalAlign: 'middle',
            borderWidth: 0
        },
        series: [{
            name: 'Tokyo',
            data: [7.0, 6.9, 9.5, 14.5, 18.2, 21.5, 25.2, 26.5, 23.3, 18.3, 13.9, 9.6]
        }, {
            name: 'New York',
            data: [-0.2, 0.8, 5.7, 11.3, 17.0, 22.0, 24.8, 24.1, 20.1, 14.1, 8.6, 2.5]
        }, {
            name: 'Berlin',
            data: [-0.9, 0.6, 3.5, 8.4, 13.5, 17.0, 18.6, 17.9, 14.3, 9.0, 3.9, 1.0]
        }, {
            name: 'London',
            data: [3.9, 4.2, 5.7, 8.5, 11.9, 15.2, 17.0, 16.6, 14.2, 10.3, 6.6, 4.8]
        }]
    });
});
        </script>
    </head>
    <body>
<script src="../../js/highcharts.js"></script>
<script src="../../js/modules/exporting.js"></script>

<div id="container" style="min-width: 310px; height: 400px; margin: 0 auto"></div>

    </body>
</html>
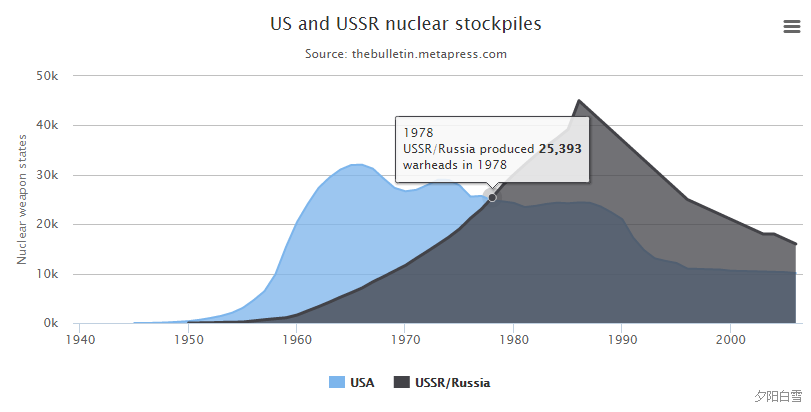
<!DOCTYPE HTML>
<html>
    <head>
        <meta http-equiv="Content-Type" content="text/html; charset=utf-8">
        <title>Highcharts Example</title>

        <script type="text/javascript" src="http://ajax.googleapis.com/ajax/libs/jquery/1.8.2/jquery.min.js"></script>
        <style type="text/css">
        </style>
        <script type="text/javascript">
$(function () {
    $('#container').highcharts({
        chart: {
            type: 'area'
        },
        credits: {
            text: '夕阳白雪',
            href: 'www.cnblogs.com/xiyangbaixue'
        },
        title: {
            text: 'US and USSR nuclear stockpiles'
        },
        subtitle: {
            text: 'Source: <a href="http://thebulletin.metapress.com/content/c4120650912x74k7/fulltext.pdf">' +
                'thebulletin.metapress.com</a>'
        },
        xAxis: {
            allowDecimals: false,
            labels: {
                formatter: function () {
                    return this.value; // clean, unformatted number for year
                }
            }
        },
        yAxis: {
            title: {
                text: 'Nuclear weapon states'
            },
            labels: {
                formatter: function () {
                    return this.value / 1000 + 'k';
                }
            }
        },
        tooltip: {
            pointFormat: '{series.name} produced <b>{point.y:,.0f}</b><br/>warheads in {point.x}'
        },
        plotOptions: {
            area: {
                pointStart: 1940,
                marker: {
                    enabled: false,
                    symbol: 'circle',
                    radius: 2,
                    states: {
                        hover: {
                            enabled: true
                        }
                    }
                }
            }
        },
        series: [{
            name: 'USA',
            data: [null, null, null, null, null, 6, 11, 32, 110, 235, 369, 640,
                1005, 1436, 2063, 3057, 4618, 6444, 9822, 15468, 20434, 24126,
                27387, 29459, 31056, 31982, 32040, 31233, 29224, 27342, 26662,
                26956, 27912, 28999, 28965, 27826, 25579, 25722, 24826, 24605,
                24304, 23464, 23708, 24099, 24357, 24237, 24401, 24344, 23586,
                22380, 21004, 17287, 14747, 13076, 12555, 12144, 11009, 10950,
                10871, 10824, 10577, 10527, 10475, 10421, 10358, 10295, 10104]
        }, {
            name: 'USSR/Russia',
            data: [null, null, null, null, null, null, null, null, null, null,
                5, 25, 50, 120, 150, 200, 426, 660, 869, 1060, 1605, 2471, 3322,
                4238, 5221, 6129, 7089, 8339, 9399, 10538, 11643, 13092, 14478,
                15915, 17385, 19055, 21205, 23044, 25393, 27935, 30062, 32049,
                33952, 35804, 37431, 39197, 45000, 43000, 41000, 39000, 37000,
                35000, 33000, 31000, 29000, 27000, 25000, 24000, 23000, 22000,
                21000, 20000, 19000, 18000, 18000, 17000, 16000]
        }]
    });
});
        </script>
    </head>
    <body>
<script src="../../js/highcharts.js"></script>
<script src="../../js/modules/exporting.js"></script>

<div id="container" style="min-width: 310px; height: 400px; margin: 0 auto"></div>

    </body>
</html>
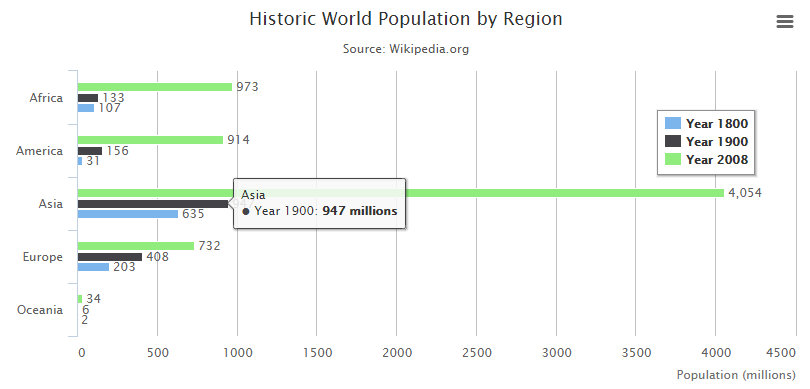
<!DOCTYPE HTML>
<html>
    <head>
        <meta http-equiv="Content-Type" content="text/html; charset=utf-8">
        <title>Highcharts Example</title>

        <script type="text/javascript" src="http://ajax.googleapis.com/ajax/libs/jquery/1.8.2/jquery.min.js"></script>
        <style type="text/css">
${demo.css}
        </style>
        <script type="text/javascript">
$(function () {
    $('#container').highcharts({
        chart: {
            type: 'bar'
        },
        title: {
            text: 'Historic World Population by Region'
        },
        subtitle: {
            text: 'Source: Wikipedia.org'
        },
        xAxis: {
            categories: ['Africa', 'America', 'Asia', 'Europe', 'Oceania'],
            title: {
                text: null
            }
        },
        yAxis: {
            min: 0,
            title: {
                text: 'Population (millions)',
                align: 'high'
            },
            labels: {
                overflow: 'justify'
            }
        },
        tooltip: {
            valueSuffix: ' millions'
        },
        plotOptions: {
            bar: {
                dataLabels: {
                    enabled: true
                }
            }
        },
        legend: {
            layout: 'vertical',
            align: 'right',
            verticalAlign: 'top',
            x: -40,
            y: 100,
            floating: true,
            borderWidth: 1,
            backgroundColor: ((Highcharts.theme && Highcharts.theme.legendBackgroundColor) || '#FFFFFF'),
            shadow: true
        },
        credits: {
            enabled: false
        },
        series: [{
            name: 'Year 1800',
            data: [107, 31, 635, 203, 2]
        }, {
            name: 'Year 1900',
            data: [133, 156, 947, 408, 6]
        }, {
            name: 'Year 2008',
            data: [973, 914, 4054, 732, 34]
        }]
    });
});
        </script>
    </head>
    <body>
<script src="../../js/highcharts.js"></script>
<script src="../../js/modules/exporting.js"></script>

<div id="container" style="min-width: 310px; max-width: 800px; height: 400px; margin: 0 auto"></div>

    </body>
</html>
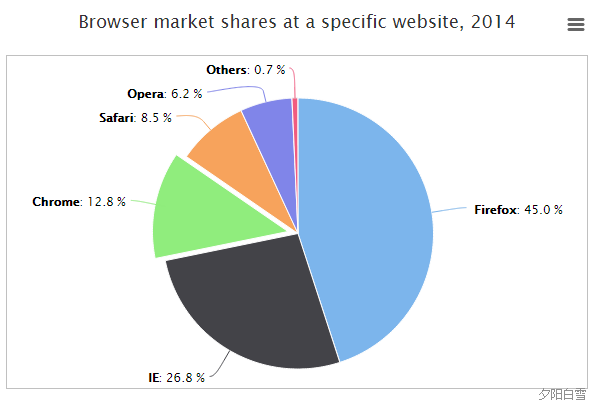
<!DOCTYPE HTML>
<html>
    <head>
        <meta http-equiv="Content-Type" content="text/html; charset=utf-8">
        <title>Highcharts Example</title>

        <script type="text/javascript" src="http://ajax.googleapis.com/ajax/libs/jquery/1.8.2/jquery.min.js"></script>
        <style type="text/css">
${demo.css}
        </style>
        <script type="text/javascript">
$(function () {
    $('#container').highcharts({
        chart: {
            plotBackgroundColor: null,
            plotBorderWidth: 1,//null,
            plotShadow: false
        },
        credits: {
            text: '夕阳白雪',
            href: 'www.cnblogs.com/xiyangbaixue'
        },
        title: {
            text: 'Browser market shares at a specific website, 2014'
        },
        tooltip: {
            pointFormat: '{series.name}: <b>{point.percentage:.1f}%</b>'
        },
        plotOptions: {
            pie: {
                allowPointSelect: true,
                cursor: 'pointer',
                dataLabels: {
                    enabled: true,
                    format: '<b>{point.name}</b>: {point.percentage:.1f} %',
                    style: {
                        color: (Highcharts.theme && Highcharts.theme.contrastTextColor) || 'black'
                    }
                }
            }
        },
        series: [{
            type: 'pie',
            name: 'Browser share',
            data: [
                ['Firefox',   45.0],
                ['IE',       26.8],
                {
                    name: 'Chrome',
                    y: 12.8,
                    sliced: true,
                    selected: true
                },
                ['Safari',    8.5],
                ['Opera',     6.2],
                ['Others',   0.7]
            ]
        }]
    });
});


        </script>
    </head>
    <body>
<script src="../../js/highcharts.js"></script>
<script src="../../js/modules/exporting.js"></script>

<div id="container" style="min-width: 310px; height: 400px; max-width: 600px; margin: 0 auto"></div>

    </body>
</html>
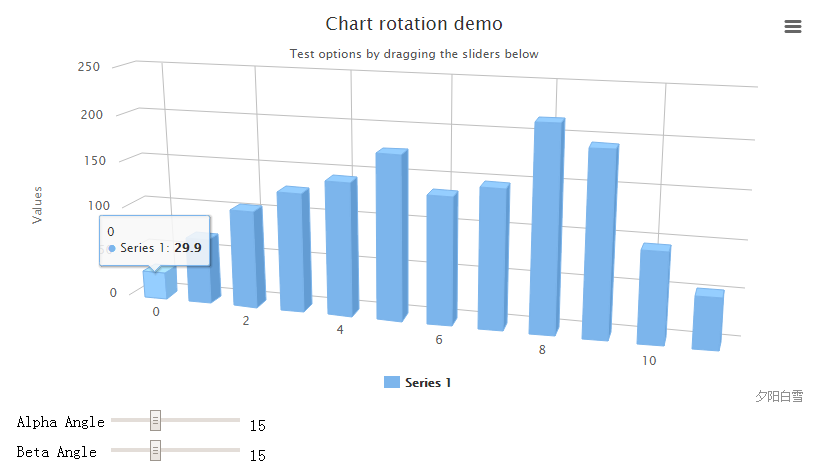
<!DOCTYPE HTML>
<html>
    <head>
        <meta http-equiv="Content-Type" content="text/html; charset=utf-8">
        <title>Highcharts Example</title>

        <script type="text/javascript" src="http://ajax.googleapis.com/ajax/libs/jquery/1.8.2/jquery.min.js"></script>
        <style type="text/css">
#container, #sliders {
    min-width: 310px;
    max-width: 800px;
    margin: 0 auto;
}
#container {
    height: 400px;
}
        </style>
        <script type="text/javascript">
$(function () {
    // Set up the chart
    var chart = new Highcharts.Chart({
        chart: {
            renderTo: 'container',
            type: 'column',
            margin: 75,
            options3d: {
                enabled: true,
                alpha: 15,
                beta: 15,
                depth: 50,
                viewDistance: 25
            }
        },
        credits: {
            text: '夕阳白雪',
            href: 'www.cnblogs.com/xiyangbaixue'
        },
        title: {
            text: 'Chart rotation demo'
        },
        subtitle: {
            text: 'Test options by dragging the sliders below'
        },
        plotOptions: {
            column: {
                depth: 25
            }
        },
        series: [{
            data: [29.9, 71.5, 106.4, 129.2, 144.0, 176.0, 135.6, 148.5, 216.4, 194.1, 95.6, 54.4]
        }]
    });

    function showValues() {
        $('#R0-value').html(chart.options.chart.options3d.alpha);
        $('#R1-value').html(chart.options.chart.options3d.beta);
    }

    // Activate the sliders
    $('#R0').on('change', function () {
        chart.options.chart.options3d.alpha = this.value;
        showValues();
        chart.redraw(false);
    });
    $('#R1').on('change', function () {
        chart.options.chart.options3d.beta = this.value;
        showValues();
        chart.redraw(false);
    });

    showValues();
});
        </script>
    </head>
    <body>
<script src="../../js/highcharts.js"></script>
<script src="../../js/highcharts-3d.js"></script>
<script src="../../js/modules/exporting.js"></script>

<div id="container"></div>
<div id="sliders">
    <table>
        <tr><td>Alpha Angle</td><td><input id="R0" type="range" min="0" max="45" value="15"/> <span id="R0-value" class="value"></span></td></tr>
        <tr><td>Beta Angle</td><td><input id="R1" type="range" min="0" max="45" value="15"/> <span id="R1-value" class="value"></span></td></tr>
    </table>
</div>
    </body>
</html>
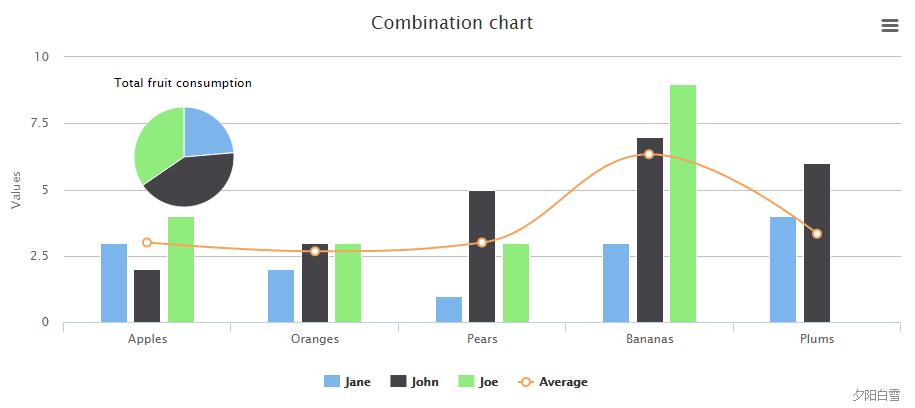
<!DOCTYPE HTML>
<html>
    <head>
        <meta http-equiv="Content-Type" content="text/html; charset=utf-8">
        <title>Highcharts Example</title>

        <script type="text/javascript" src="http://ajax.googleapis.com/ajax/libs/jquery/1.8.2/jquery.min.js"></script>
        <style type="text/css">
${demo.css}
        </style>
        <script type="text/javascript">
$(function () {
    $('#container').highcharts({
        title: {
            text: 'Combination chart'
        },
        credits: {
            text: '夕阳白雪',
            href: 'www.cnblogs.com/xiyangbaixue'
        },
        xAxis: {
            categories: ['Apples', 'Oranges', 'Pears', 'Bananas', 'Plums']
        },
        labels: {
            items: [{
                html: 'Total fruit consumption',
                style: {
                    left: '50px',
                    top: '18px',
                    color: (Highcharts.theme && Highcharts.theme.textColor) || 'black'
                }
            }]
        },
        series: [{
            type: 'column',
            name: 'Jane',
            data: [3, 2, 1, 3, 4]
        }, {
            type: 'column',
            name: 'John',
            data: [2, 3, 5, 7, 6]
        }, {
            type: 'column',
            name: 'Joe',
            data: [4, 3, 3, 9, 0]
        }, {
            type: 'spline',
            name: 'Average',
            data: [3, 2.67, 3, 6.33, 3.33],
            marker: {
                lineWidth: 2,
                lineColor: Highcharts.getOptions().colors[3],
                fillColor: 'white'
            }
        }, {
            type: 'pie',
            name: 'Total consumption',
            data: [{
                name: 'Jane',
                y: 13,
                color: Highcharts.getOptions().colors[0] // Jane's color
            }, {
                name: 'John',
                y: 23,
                color: Highcharts.getOptions().colors[1] // John's color
            }, {
                name: 'Joe',
                y: 19,
                color: Highcharts.getOptions().colors[2] // Joe's color
            }],
            center: [100, 80],
            size: 100,
            showInLegend: false,
            dataLabels: {
                enabled: false
            }
        }]
    });
});


        </script>
    </head>
    <body>
<script src="../../js/highcharts.js"></script>
<script src="../../js/modules/exporting.js"></script>

<div id="container" style="min-width: 310px; height: 400px; margin: 0 auto"></div>

    </body>
</html>
配置选项:
全局配置:
Highcharts.setOptions({
    // 全局配置并不适合所有图表。
    "global": {
        // VML所需要的图像路径正则,以便来绘制径向渐变
        "VMLRadialGradientURL": "http://code.highcharts.com/{version}/gfx/vml-radial-gradient.png",
        // 附加文件的URL为Android 2设备延迟加载。这些设备不支持SVG,所以我们下载一个helper文件,其中包含canvg,依赖rbcolor,和canvg渲染器类。为了避免外连接我们的网站,您可以安装canvas-tools。js在您自己的服务器,并相应地改变这个选项。
        "canvasToolsURL": "http://code.highcharts.com/{version}/modules/canvas-tools.js",
        // 分钟的时区偏移。Positive的值为西方的UTC,negative的值为东方的UTC,正如ECMAScript中的getTimezoneOffset方法。使用这个来显示基于UTC的数据在一个预定义的时区。
        "timezoneOffset": 0,
        // 是否使用UTC时间轴缩放、tickmark Highcharts.dateFormat位置和时间显示。使用UTC的优点是,时间显示同样不管用户代理的时区设置。当地时间可以使用实时数据加载时或者当正确夏令时转换是必需的。
        "useUTC": true
    },
    // language
    "lang": {
        // 输出模块菜单。上下文菜单的工具提示标题打印和导出菜单项。
        "contextButtonTitle": "Chart context menu",
        // Highcharts.numberFormat方法默认使用小数点,除非另有函数参数中指定的方法。
        "decimalPoint": ".",
        // 导出模块。JPEG的文本下载菜单项。
        "downloadJPEG": "Download JPEG image",
        // 导出模块。PDF的文本下载菜单项。
        "downloadPDF": "Download PDF document",
        // 导出模块。PNG的文本下载菜单项。
        "downloadPNG": "Download PNG image",
        // 导出模块。PDF的文本下载菜单项。
        "downloadSVG": "Download SVG vector image",
        // 当按下按钮时显示的文本,链接回到父级。父级的名字是通过{ series.name }插入。
        "drillUpText": "Back to {series.name}",
        // 当图表处在加载状态时,紧接着调用chart.showLoading方法,然后加载提示文本出现的内容。
        "loading": "Loading...",
        // 一个数组,其中包含几个月的名字。对应于Highcharts.dateFormat方法的% B格式。
        "months": [ "January" , "February" , "March" , "April" , "May" , "June" , "July" , "August" , "September" , "October" , "November" , "December"],
        // 当chart没有数据时显示的内容
        "noData": "No data to display",
        // 公制前缀缩短大的数字用于轴标签。设置numericSymbols为null完全禁用缩短。
        "numericSymbols": [ "k" , "M" , "G" , "T" , "P" , "E"],
        // 菜单项的文本打印图表
        "printChart": "Print chart",
        // 放大图表是显示坐标文本
        "resetZoom": "Reset zoom",
        // 放大图表时显示工具提示标题
        "resetZoomTitle": "Reset zoom level 1:1",
        // months的简写
        "shortMonths": [ "Jan" , "Feb" , "Mar" , "Apr" , "May" , "Jun" , "Jul" , "Aug" , "Sep" , "Oct" , "Nov" , "Dec"],
        // Highcharts.numberFormat方法中默认数字分隔符
        "thousandsSep": ",",
        // 与months类似
        "weekdays": ["Sunday", "Monday", "Tuesday", "Wednesday", "Thursday", "Friday", "Saturday"]
    }
});
图表配置:
$('#container').highcharts({
    // 图表的配置参数
    chart: {
        // 当绘制多条轴线时,每条轴线上都会自动添加不同的
        alignTicks: true,
        // 设置动画,当图表更新时
        animation: true,
        // 背景色
        backgroundColor:  '#FFFFFF',
        // 边框颜色
        borderColor: '#4572A7',
        // 边框圆角
        borderRadius: 5,
        // 边框宽度
        borderWidth: 0,
        // 给图表容器div添加class
        className: '',
        // 已废弃
        defaultSeriesType: 'line',
        // 操作图表的一些事件
        events: {
            // 当图表添加一条线时执行的事件
            addSeries: function() {},
            // 当点击图表时执行的事件
            click: function() {},
            // 当鼠标按下坐标轴标签时执行的事件
            drilldown: function() {},
            // 当鼠标抬起坐标轴标签时执行的事件
            drillup: function() {},
            // 当图表加载时执行的事件
            load: function() {},
            // 当图表重新绘制时执行的事件
            redraw: function() {},
            // 当选择图表时执行的事件
            selection: function() {}
        },
        // 图表高度
        height: null,
        // 忽略隐藏的轴线
        ignoreHiddenSeries: true,
        // x轴与y轴互换
        inverted: false,
        // 图表边框与绘图区域的外边距
        margin: [],
        // margin的下边距
        marginBottom: null,
        marginLeft: null,
        marginRight: null,
        marginTop: null,
        // 三维绘制图表的一些参数
        options3d: {
            // 透明度
            alpha: 0,
            // 旋转角度
            beta: 0,
            // 图像深度
            depth: 100,
            // 是否使用三维绘图
            enbaled: false,
            // 通过定义底部、前面、后面的面板来围绕图表绘制一个frame
            frame: {
                back: {
                    color: 'transparent',
                    size: 1
                },
                bottom: {
                    color: 'transparent',
                    size: 1
                },
                side: {
                    color: 'transparent',
                    size: 1
                }
            },
            viewDistance: 100
        },
        //
        panKey: '',
        panning: false,
        pinchType: null,
        plotBackgroundColor: '',
        plotBackgroundImage: '',
        plotBorderColor: '#C0C0C0',
        plotBorderWidth: 0,
        plotShadow: false,
        polar: false,
        reflow: true,
        renderTo: '',
        resetZoomButton: {
            position: {},
            relativeTo: 'plot',
            theme: {}
        },
        selectionMarkerFill: rgba(69,114,167,0.25),
        shadow: false,
        showAxes: false,
        spacing: [10, 10, 15, 10],
        spacingBottom: 15,
        spacingLeft: 10,
        spacingRight: 10,
        spacingTop: 10,
        style: {},
        type: 'line',
        width: null,
        zoomType: ''
    },
    colors: [{}],
    credits: {
        enabled: true,
        href: 'http://www.highcharts.com',
        position: {
            align: 'right',
            x: -10,
            verticalAlign: 'bottom',
            y: -5
        },
        style: {
            cursor: 'pointer',
            color: '#909090',
            fontSize: '10px'
        },
        text: 'Highcharts.com'
    },
    drilldown: {
        activeAxisLabelStyle: {
            cursor: 'pointer',
            color: '#0d233a',
            fontWeight: 'bold',
            textDecoration: 'underline'
        },
        activeDataLabelStyle: {
            cursor: 'pointer',
            color: '#0d233a',
            fontWeight: 'bold',
            textDecoration: 'underline'
        },
        animation: null,
        drillUpButton: {
            position: '',
            relativeTo: 'plotBox',
            theme: ''
        },
        series: [],
    },
    exporting: {
        buttons: {
            contextButton: {
                align : 'right',
                enabled: true,
                height: 20,
                menuItems: [],
                onclick: function() {},
                symbol: 'menu',
                symbolFill: '#A8BF77',
                symbolSize: 14,
                symbolStroke: '#666',
                symbolStrokeWidth: 1,
                symbolX: 12.5,
                symbolY: 10.5,
                text: null,
                theme: null,
                verticalAlign: 'top',
                width: 24,
                x: -10,
                y: 0
            }
        },
        chartOptions: null,
        enabled: true,
        filename: 'chart',
        formAttributes: null,
        scale: 2,
        sourceHeight: null,
        sourceWidth: null,
        type: 'image/png',
        url: 'http://export.highcharts.com',
        width: null
    },
    labels: {
        items: [{
            html: null,
            style: null
        }],
        style: {
            color: '#3E576F'
        }
    },
    legend: {
        align: 'center',
        backgroundColor: null,
        borderColor: '#909090',
        borderRadius: 0,
        borderWidth: 0,
        enabled: true,
        floating: false,
        itemDistance: 20,
        itemHiddenStyle: {
            color: '#CCC'
        },
        itemHoverStyle: {
            color: '#000'
        },
        itemMarginBottom: 0,
        itemMarginTop: 0,
        itemStyle: {
             "color": "#333333",
             "cursor": "pointer",
             "fontSize": "12px",
             "fontWeight": "bold"
        },
        itemWidth: null,
        labelFormat: '{name}',
        labelFormatter: null,
        layout: 'horizontal',
        lineHeight: 16,
        margin: 15,
        maxHeight: null,
        padding: 8,
        reversed: false,
        rtl: false,
        shadow: false,
        // 已废弃
        style: null,
        symbolHeight: 12,
        symbolPadding: 5,
        symbolRadius: 2,
        symbolWidth: 16,
        title: {
            style: {
                fontWeight: 'bold'
            },
            text: null
        },
        useHTML: false,
        verticalAlign: 'bottom',
        width: null,
        x: 0,
        y: 0
    },
    loading: {
        hideDuration: 100,
        labelStyle: {
            "fontWeight": "bold",
            "position": "relative",
            "top": "45%"
        },
        showDuration: 100,
        style: {
            position: 'absolute',
            backgroundColor: 'white',
            opacity: 0.5,
            textAlign: 'center'
        }
    },
    navigation: {
        buttonOptions: {
            align: 'right',
            enabled: true,
            height: 20,
            symbolFill: '#E0E0E0',
            symbolSize: 14,
            symbolStroke: '#666',
            symbolStrokeWidth: 1,
            symbolX: 12.5,
            symbolY: 10.5,
            text: null,
            theme: null,
            verticalAlign: 'top',
            width: 24,
            y: 0
        },
        menuItemHoverStyle: {
            background: '#4572A5',
            color: '#FFFFFF'
        },
        menuItemStyle: {
            padding: '0 5px',
            background: 'NONE',
            color: '#303030'
        },
        menuStyle: {
            border: '1px solid #A0A0A0',
            background: '#FFFFFF'
        }
    },
    noData: {
        attr: null,
        position: {
            "x": 0,
            "y": 0,
            "align": "center",
            "verticalAlign": "middle"
        },
        style: {
            "fontSize": "12px",
            "fontWeight": "bold",
            "color": "#60606a"
        }
    },
    pane: {
        background: null,
        center: ["50%", "50%"],
        endAngle: null,
        startAngle: null
    },
    // 绘制图表参数,比如:柱状图,饼状图等
    plotOptions: {

    }
});

 浙公网安备 33010602011771号