As much as we may wish to deny it, human beings are not perfect. We make mistakes. Programmers are not exempt from this and, frequently, the mistakes we make are in the programs we create; such mistakes lead to issues, defects or, as they are most commonly known, bugs in the programs. The process of fixing these mistakes, of removing the bugs, is known as debugging.
Bugs come in many different shapes and sizes; there are even formal categories for them, such as syntax bugs, logic bugs, or design bugs. A syntax bug might be something as simple as a spelling mistake in the source code; these bugs are usually caught by the compiler. A logic bug might be a conditional operation that uses an incorrect condition - if (x > 0) instead of if (x < 0) - leading to incorrect behaviour in the program. Design bugs tend to be the most costly bugs in terms of time to fix. These are situations where the components of the system are each behaving correctly individually, but the overall resulting behaviour is incorrect; the design of the components has led to this conflict. There are also many other categories.
Programmers wouldn't be programmers if they didn't try to get the computer to do things for them. So, over time, they've developed quite an extensive library of debugging tools and technologies to help track down and wipe out bugs. Some are very complex, impressive pieces of technology that take a huge quantity of source code and analyse it to find bugs without the need for any human interaction. At the other end of the spectrum are simple memory probes, that know nothing about bugs or source code, but can (given a user with appropriate training, and an awful lot of time) tell you anything you want to know about why your program does not work.
The process of debugging is not actually specific to programming; it's one of the core parts of engineering as a whole. The same processes and steps can be seen in software engineering as well as in electrical engineering, medicine (a sort of biological engineering) and even speechwriting (language engineering). The steps most frequently seen are:
- Issue recognition - identifying exactly what it is about the target being worked on that is coming across as incorrect
- Intelligence gathering - examining the target to understand the way that it works and the way the symptom is being produced
- Diagnosis - identifying the root cause of the symptom, the bug itself
- Prescription - planning out how the bug should be fixed
- Response - fixing the bug
- Verification - checking that the bug is now fixed and that the fix has not caused other bugs to be created
The model is very fluid; these are not discrete stages that must be worked through for every problem. They'll blur together: some may be omitted, some may be repeated and there are other activities that may happen, such as collaboration (asking others for their thoughts on an issue). Still, if you are new to debugging, this list may serve as a helpful way to think about the process.
Debugging tools vary widely in both their intrusiveness and in the stage of the process at which they are aimed. Some can be used preventatively, while others are only brought out after a bug has arisen. Let's look at some of the tools used in each stage of the process.
Issue Recognition
Issue recognition can be quite difficult to automate, as it requires that the tester know how the program should behave in order to detect when it differs from that. Some general-purpose tools for doing things like stress testing exist, which throw large amounts of random input at your program. They're non-intrusive, in that you don't generally need to modify your program in order to run the tool. Stress tests can help you find some of the better hidden bugs as they will often put your program into unusual states, exploring edge conditions and unusual interactions between components. However, as the name implies, stress testing only tests the behaviour of your program in extreme situations; it does not test the more common, "average" cases. Also, it knows nothing about the way your program should behave; so it can only detect very obvious error conditions, like crashes.
More helpful than these general-purpose tools are unit tests. These are small chunks of code that test parts of your program in a particular way, reporting a simple boolean pass or fail value. Because you write the tests yourself, you're expressing how your program should behave, which is why the tests give you much more useful results. Testing frameworks exist to help you wire up your tests for batch processing, so you can integrate the tests directly into your build process, running all the tests to check that they pass. Of course, there's a caveat: you might have bugs in your tests, so you should aim to keep each test as small and simple as possible, reducing the chances of a bug occurring.
There are also static analysis tools: the aforementioned tools that analyse your source code to look for potentially buggy code. For unmanaged C and C++ coders, one such popular tool is PC-Lint; the product website includes examples of the kind of bugs that it can find for you. There's also ITS4 and FlawFinder, freeware tools which focus particularly on potential bugs that have security issues, such as buffer overruns. Meanwhile, under .NET, tools like FxCop can help to ensure that your code obeys coding standards, even ones you define yourself. Static analysis tools are limited in that they are inferring intention from the code itself instead of getting it from the programmer as with unit tests, and so they will not know when something is being done deliberately, resulting in false positives; they are also always going to be incomplete in terms of the catalogue of bugs that they recognise, resulting in false negatives. Also, when it comes to things like syntax bugs, the build tools (compiler, linker, etc) will usually flag things for you, sometimes preventing you from even running your program until you fix them.
Right alongside the static analysis tools are runtime analysis tools. Instead of taking a source code database and poring over it, runtime analysis tools sit in the background while your program is running and watch how it behaves - an example would be something like a memory leak checker or a tool to monitor thread interactions. While you often don't get these tools out until you already suspect that a bug is present - as they can affect performance, or simply take slightly longer to set up - it is still useful to run your program with them every once in a while to make sure that nothing is awry. Some of the tools in this category are external to your program, packaged as entirely separate applications, while others come as libraries or headers that you build directly into your code. Examples of the former include Valgrind, BoundsChecker or the DirectX debug runtime; examples of the latter include Paul Nettle's MMGR, the profiler presented by Steve Rabin in Game Programming Gems 1 or the heap verification section of the C runtime library.
It should also be mentioned that the operating system will usually perform some runtime analysis. It can only detect situations where you've interacted with the system in an incorrect way - by dividing by zero, for example, or by accessing memory that does not belong to your program, or by writing past the end of your program's heap - but it tends to give you some information that can help track down the cause. To augment this, the build tools can automatically include extra state-verification code in your programs, checking periodically that you've not corrupted the stack, or written past the end of a buffer. This approach is semi-intrusive, in that it does involve changing your program, but doesn't require those changes to be made by you at the source code level. You can, of course, write such state-verification code yourself - the key technique in this hand is assertions; they are discussed in detail towards the end of this article.
There's more to issue recognition than simply seeing a bug and writing it down; the stage begins to blur into intelligence gathering as you pin down the exact nature of the issue. Is it repeatable? Does it happen under any other circumstances? Testing the exact nature of the symptom more extensively can help narrow down the hunting ground for the bug; in your average game, many processes are happening simultaneously, so when a bug occurs, it could be due to any of them. For example, say you're taking out an enemy AI with your electro-cannon when the game crashes. Is it the code that's rendering the electro-beam, is it the bot AI trying to react, is it the sound system trying to play the beam sound, is it the physics system trying to throw the bot backwards, is it the scoring system trying to give you a point, is it the networking system trying to notify all the other players, is it...? And so on. By trying it out in different situations - offline mode, maybe, or just firing the beam at the wall instead of an AI - the number of systems that need to be checked can be decreased.
Intelligence Gathering
Intelligence gathering is a process that cannot, at its core, be automated. It is the process by which you build the road between the symptom and the problem, and it is beyond any computer to determine which pieces of information you do and do not need in order to do so. The computer does not know about the past experiences of the programmer or the extent of the programmer's knowledge of the system, and it does not know which approaches the programmer prefers to use to solve the problem.
However, while the computer cannot decide which information you do and do not need, it is very capable of providing you with information that you request. A very large number of tools exist to assist you in this regard.
The most common package in this category is simply called a debugger. It usually contains a suite of tools that let you examine and control program flow, the values of variables and the ways in which they change, memory, program threads, and processor registers - sometimes more, sometimes less. Different debuggers have different tools, and may be targeted at different parts of the system (for example, a GPU debugger that contains a suite of tools for examining the execution of vertex and pixel shaders on the graphics card).
Tools exist for intelligence gathering on pretty much every part of a computer. Recently, Microsoft released a graphics profiling and debugging tool called PIX For Windows that allows developers to gather information about Direct3D objects; similarly, Graphic Remedy have released their gDEbugger tool, which provides similar (if more extensive) information for OpenGL. People writing drivers for Windows will probably find the kernel debugging tool KD useful, as it allows them to inspect parts of the Windows kernel that are usually not accessible to a standard debugger. The Mozilla Foundation has developed a debugger to debug Javascript scripts, while elsewhere on the web Dmitri Dmitrienko has released a PHP debugger. The list goes on. The existence and quality of debugging tools is definitely something to bear in mind when evaluating a technology.
As far as general-purpose CPU debuggers for C++ go, the two most popular packages are the GNU project's GDB debugger, and Microsoft's Visual Studio (though I'm advised that Microsoft also offer a more powerful but less widely used debugger known as WinDBG). I'm going to cover some of the key tools in Visual Studio 2005 as applied to debugging native C++ code; hopefully many of the concepts will still be useful to readers using other languages or GDB, as much of the terminology is similar in other tools. For this article, I'm going to assume that you're using the default UI configuration for Visual Studio. If you've customised icons or selected a different key configuration, naturally some shortcuts or button icons may be inaccurate.
Visual Studio Debugging - Execution Flow tools
The most used part of the Visual Studio debugger is its ability to control execution flow.
Visual Studio lets you pause and resume your program, either manually, by hitting the pause ( ) or start/resume (
 ) buttons, or in a controlled and automatic way. It can resume execution for a single line of code and then pause again ("Step Over,"
  ), it can resume and then pause again either after the current line or at the beginning of any functions the program enters ("Step Into,"
  ), it can resume and then pause once the current function has exited ("Step Out,"
  ), or it can resume and then pause automatically once it reaches the line of code at which you have placed the text insertion point ("Run to Cursor,"
  ).
).
When you pause the program, the yellow arrow to the left of the code indicates where it stopped, and you can use the "Show Next Statement" button ( ) to quickly jump back there. There are three other buttons that relate to program flow: "Stop Debugging" (
 ), which forcibly terminates your program and shuts down the debugging tools, "Restart" (
 ), which forcibly terminates the program and then starts it up again, stopping at the beginning of the program's initial function, and "Set Next Statement" (
 ). Set Next Statement allows you to jump the yellow arrow to any line of any function in your code, but you need to be extremely careful - it's very easy to break your program's internal state like this, and things are pretty much guaranteed to go wrong if you try using it to jump from one function to another. Unless you understand clearly how the call stack and program pointer work, it's probably best to leave this one alone.
Those are the basic execution controls. The next step up is to look at breakpoints: points in your code where you want the debugger to automatically pause your program, as if you'd hit the pause button yourself. You can set up as many of these points in your program as you want (though going overboard can cause your program to slow down). In Visual Studio 2005, the breakpoints window looks like this:
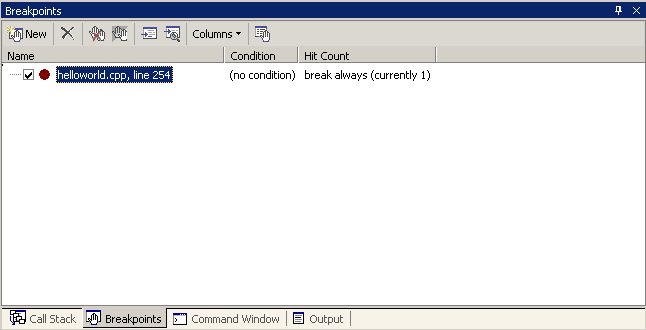
The simplest kind of breakpoint is called an unconditional breakpoint (or more commonly just "a breakpoint"); when the program reaches one of these, the debugger will pause the program, every time. These are the most frequently used type of breakpoint. You can turn one on or off without removing it if you want (the checkbox to the left of the breakpoint), but you have to do that by hand. The simplest way to create an unconditional breakpoint is to click on the grey bar to the left of the line of code where you want to set the breakpoint, or to click in that line and press F9. The breakpoint might not show up exactly where you tried to place it - that's because it must be on a line of code that produces some actual executable statements, instead of on lines such as function signatures or comments.
Slightly more complex are conditional breakpoints. As the name suggests, these are breakpoints that have some particular conditions or qualifiers applied to them; when your program reaches a conditional breakpoint, the debugger will pause the program but only if the conditions are met.
Say you've got a bug in a function which only shows up when the input is negative. If you placed an unconditional breakpoint at the beginning of the function, the breakpoint may be hit in a call to the function that passes a positive value - something you're not interested in. Instead of having to repeatedly break and resume the program until you get a negative value, you could set a condition on the breakpoint (e.g. input < 0) and then the program will only stop when the input variable is below zero. There's a limit to the complexity of the conditions that you can set, but if you stick to simple comparisons and logic then you shouldn't have any problems.
Instead of having the breakpoint happen when the condition is true, you could also have it happen when the condition has changed from the last time the breakpoint was checked. You can also set up the breakpoint to only break on the fifth time, or on every fifth time, or to skip the first four times but break every time after that (the "Hit Count" setting). All of these things can be set up by right-clicking a breakpoint in the breakpoints window and choosing the relevant options.
A new feature in Visual Studio 2005 is the When Hit property of breakpoints. Simply put, you can instruct the debugger to do something instead of pausing the program, like printing the value of some variables to the Output window, or running a macro. You can have it pause as well, if you like. One of the most useful things this feature lets you do is to add debug traces (text messages telling you about the state of the program) without having to change any code or rebuild; that particular aspect is so useful that there's actually a shortcut for setting one up (Insert Tracepoint instead of Insert Breakpoint).
Up to this point we've only considered location-based breakpoints: breakpoints that exist at particular places within the code. There's a second kind of breakpoint known as a data breakpoint. Instead of waiting for the code to reach a particular place before checking whether to stop, data breakpoints continually monitor a variable or location in memory, and pause the program whenever the value stored there changes, no matter where the program is at the time. If one of your variables is mysteriously changing and you can't figure out why, stick a data breakpoint on it. They're very effective when it comes to tracking down things like buffer overruns. All the conditions and filters that you can apply to location-based breakpoints can be applied to data breakpoints too. Data breakpoints have a bit of a reputation for being slow and harming your program's performance; that's only true if the data breakpoint is being emulated, and data breakpoints on the PC in Visual Studio 2005 are no longer ever emulated, they're provided by the hardware.
There's one more feature that involves pausing your program in the debugger, and that's exception handling. If your program experiences an exception that isn't handled - for example, an access violation - then the debugger will always catch it and pause your program. Sometimes you will have inserted code to catch exceptions before they get to that level (try/catch blocks). Yet you may still find that you want the debugger to pause your program even though the exception is being handled - your program has been written to recover from the error, but you'd like to investigate exactly how and why it happened in the first place. You can do this using the 'Exceptions' dialogue in the Debug menu (Ctrl-Alt-E); the dialogue gives you full access to all C++, .NET, runtime, and Win32 exceptions, and you can specify which ones you want it to pause on regardless of whether they have been handled or not.
Visual Studio Debugging - State Inspection tools
So, we've covered how to move the point of execution around, catch it here, throw it up there, pass it under your leg and roll it along your arm, like a small cheese. The next group of tools are used to give you information about the state of the program when it is paused in the debugger - everything from a raw memory inspector to a list of threads and processes.
First, however, we need to cover a key concept on state inspection, the concept of context. When your program is paused in the debugger, there is a huge amount of information that could be reported to you; you've usually got multiple variables across multiple functions, which may be operating in multiple threads, or even across multiple programs on multiple computers. Understandably, that can be quite hard to manage. It gets worse when you consider that the same variable name may be used in many different places (particularly loop variables like i, j, or index). If you tell the debugger you want it to report the value of foo, do you mean foo the local variable in the function you broke the program in, or foo the local variable in the function that called this function, or foo the local variable in the current function of the other thread, or foo the global variable in the other program that you're debugging via the network? To solve this problem, the debugger tracks at all times what it calls the context or frame (of reference), which consists of:
- One program, from which you can choose
- One thread, within which you can choose
- One currently executing function.
- One thread, within which you can choose
You can change which process, thread, or function you want to "talk about" through the processes, threads, and call stack windows respectively, as we'll see in a moment. Bear in mind that the context is a different thing to the program position; you can change the context around as much as you like, but when you allow the program to continue running, it will continue running from the current program position. It's really a lot easier to use than to explain; just be careful that you don't get surprised by data that turns out to be coming from a different context than what you thought you were looking at.
We should also take a moment to talk about symbols. Symbols, as far as the compiler or debugger are concerned, are names of things - functions, variables, classes, etc. One of the things that the compiler and linker do is to fix up all the names you use, replacing them with the actual address of the things you refer to. After they've done that, the names are no longer strictly necessary to have hanging around; in a debug build you'll generally keep them for the debugger's use, but if you're trying to produce the smallest possible executable (as you usually will for release builds), you want the tools to throw them away.
As a result, when the debugger loads up your program to operate on it, most of the names may have been removed - and that, obviously, can make it quite hard to work with. This problem is solved by asking the compiler/linker to create symbol files, which are files that contain all the symbols used in your code, and the addresses of the things they refer to. It's basically the same information that was used by the compiler and linker, but instead of storing it alongside the code and then throwing it away, it gets put into an entirely separate file throughout the process. Your executable is still of minimum size but you get to keep the symbol information.
When you ask the debugger to show you the contents of variable foo, it can look up foo in the symbol file, get the address of it in memory, and get the result from that address. Under Visual Studio, symbol files have the extension .PDB, and can be turned on and off in the project property pages - you need settings both in the C/C++ "General" page ("Debug Information Format," with "Program Database for Edit & Continue" being the most comprehensive), and in the Linker "Debugging" page ("Generate Debug Info"). Generating symbol files has no impact on your application's performance; it only takes a little time during the compile and link steps. If you find yourself looking at utter gibberish with lots of hex numbers and assembly codes, then chances are you don't have symbol files for what you're looking at, so Visual Studio can't convert what it's seeing into a more readable format for you. Microsoft run a 'symbol server' that provides symbol files for Windows DLLs, if you need them; information about how to have Visual Studio download these symbols is available from MSDN.
Now, onto the tools themselves. The majority of these are accessible via the "Windows" submenu in the 'Debug' menu. The first of these are the watch windows (Alt-3).
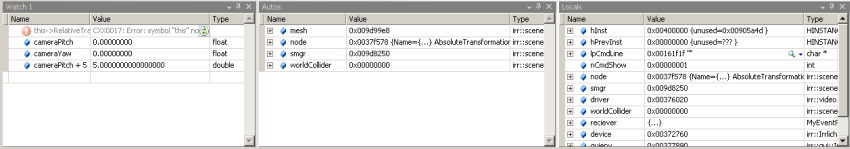
The watch windows display various expressions, and what they evaluate to in the current context - there's one that displays your local variables (Locals, Alt-4), one that guesses at what you'd like to know based on the current chunk of code (Autos, Ctrl-Alt-V) , and four that display expressions of your choosing (called Watch 1 through Watch 4). The expressions are re-evaluated every time the program stops or every time the context changes, so you can watch how expressions change as you step through a function. The evaluator can understand a decent range of expressions, including arithmetic, casting, assembly registers, and pointer math, so you can happily use expressions like (DWORD*)ptrVar[index] + 5 or this->pBitmap[10][10] if you want. Also, you can mess with the way in which the watch displays those values - MSDN describes "Format Specifiers" you can apply to individual expressions by sticking a little typecode on the end; and if you're working with integers, you can right-click the window and turn on 'Hexadecimal Display' to have those integers displayed in hexadecimal format.
To further extend the power of the watch, if the expression you enter is something to which you could assign a value in code (i.e. if you could write watch_window_expression = value in your source and it would compile OK), then you can assign to it in the watch window. This is great for tweaking things - you can just pause the program, have the relevant variables as individual expressions in the watch window, adjust the values, and hit continue to see the effect. Be careful that you don't make your program state invalid in the process; imagine that you've got an object which contains a string array, and a value that is the length of that string. You shouldn't change one without changing the other, but the watch window would let you do that, possibly leading to behaviour which appears to be buggy but in reality could not actually happen.
Visual Studio also includes a sort of "portable watch" system that displays the value of variables in tooltips that pop up as you hover the mouse over your source code. In VS.NET 2005 the system has been upgraded and renamed to DataTips, and now can be expanded to show you submembers in the same way as watch window expressions.
The second commonly-used state inspection tool is the call stack window (Alt-7).
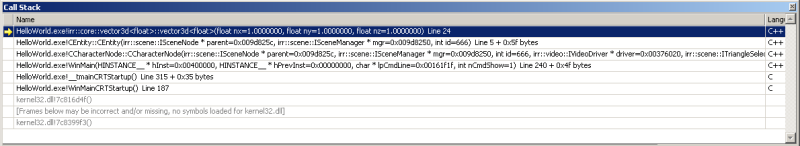
As the name suggests, it displays the call stack: the set of functions that the program is currently "inside." As functions get called in your program, they get added to the top of the call stack, and when the function exits it is removed again. The picture here shows that the process started down inside kernel32.dll, which contains functions (ones we don't have symbols for) that called WinMainCRTStartup() inside my HelloWorld.exe program. WinMainCRTStartup() then called _tmainCRTStartup() - both functions are provided by the runtime libraries - which then called WinMain, the first function in the stack that is actually part of my code. My WinMain function has called the CCharacterNode constructor, which has called the CEntity constructor, which has called Irrlicht's vector3d<float> constructor. Why is this interesting information? Because frequently a bug will only appear in a function when it is called in a specific way, and looking at the call stack tells you which function made the current call, so you can check that function out to see what's special about the way the call has been made.
Notice that as well as the module and function names, each entry in the window also tells you the parameters that were passed to the function. This can be extremely handy; it can, at a glance, show you how a value such as a null pointer has percolated to a position at which it is causing a problem. Chances are that in such situations the problem lies deeper in the call stack than you might otherwise have thought.
Double-clicking an entry in the call stack will change the context to that function; bear in mind that only the stack for the current context's thread is displayed, and other threads have entirely separate stacks. If you don't see a function that you expected to see, check the Threads window (see below) to make sure you're looking at the right thread.
The call stack window also provides a quick way of doing "step out" over multiple functions: just right click the function you want to come back up to, and choose 'Run to Cursor.' The program runs until all functions above that one in the stack have returned.
The next parts of the debugger tend not to be so frequently used, but can still be extremely useful. This is the modules window (Ctrl-Alt-U).
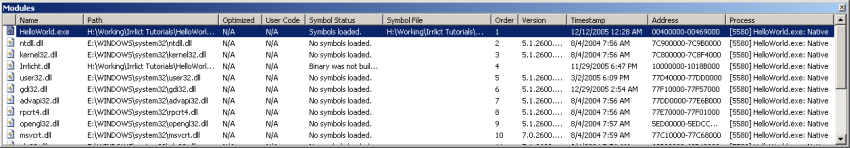
The modules window displays all the code modules - mainly EXEs and DLLs - that the debugger's collected information about, because they're used (maybe indirectly) by the thing you're debugging. Using this window can help you catch mistakes like loading the wrong copy/version of a DLL. It also allows you to check on the state of the symbol files for each module.
The processes window (Ctrl-Shift-Alt-P) shows you all the processes that the debugger is attached to:
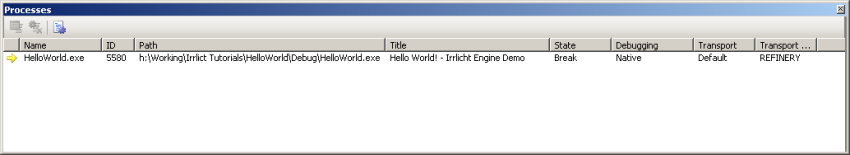
It's not generally that useful unless you're debugging multiple programs at the same time - something I rarely find I need to do - but if you are doing it, then double-clicking an entry will set the context to that process. It lets you review the way in which you're attached to processes such as native code versus .NET code versus ASP code, debugging on your own machine versus debugging a program running on another machine, etc. You can also find the 'Attach to Process' button here (Ctrl-Alt-P) that you can use to attach the debugger to a program running on both your machine and on network machines. This can be handy if your program has hung and you didn't have the debugger attached.
Related to the processes window is the threads window (Ctrl-Alt-H):
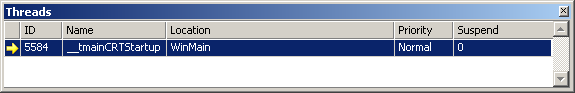
It simply lists all the threads in the current context's process, lets you change the current context's thread by double-clicking, and allows you to pause ("freeze") and un-pause ("thaw") them. Most threads don't have names, and it's generally not something to worry about, as the names are only ever visible to the debugger; however, if you'd find it useful, then there's a SetThreadName function demonstrated in MSDN. The window also displays the topmost function in that thread's call stack, the priority that the operating system has assigned to the thread (usually just Normal, but you can request that a thread have higher or lower priority), and whether or not the thread has been paused by your code.
Be aware that while your own program may not use threads, it may deal with other technology - such as DirectSound - that does create its own threads within your process.
There are just three more windows to cover in our whirlwind tour of the state-inspection tools. They're the most low-level (and in my experience, least frequently used) tools, but they do still have their moments. First up, the memory windows (Alt-6):
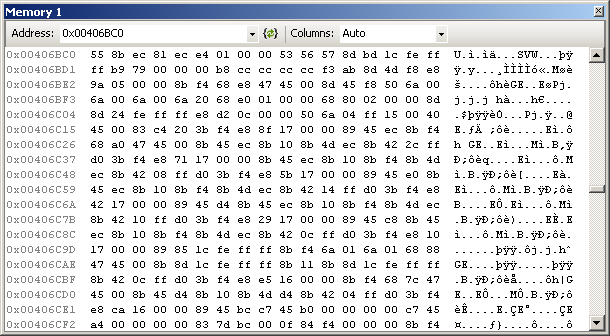
Exactly what it says on the tin: It shows you the contents of memory, on a byte-by-byte level; right-clicking the window lets you choose from a number of different formats for the data, so you can have it presented as 4-byte integers, as floats, you can make it big-endian or little-endian, etc. Like the watch windows, you've got four you can use and set up independently. You can even edit values in memory, though it's very easy to break things by doing so.
This is the registers window (Alt-5)
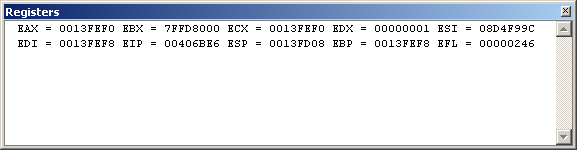
It shows you the value of the hardware registers available to your program. Don't be fooled by the fact that it looks mostly empty - by default, only the main CPU registers are set to be visible. If you right-click the window, you'll get a popup menu that allows you to turn on other sets of registers, such as the x87 floating point registers or the SSE registers.
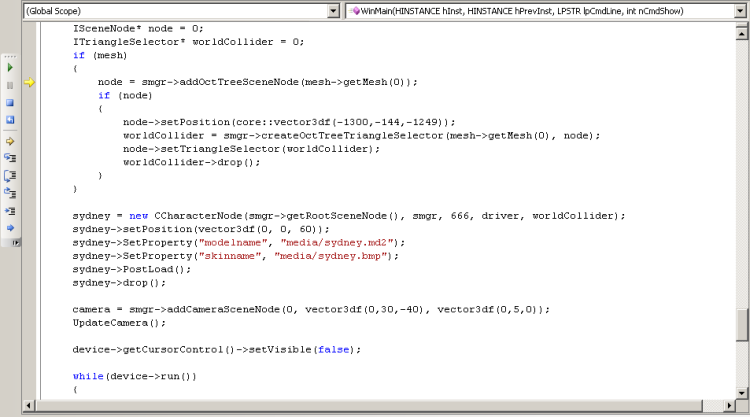
Last, but not least, the disassembly view (Alt-8) allows you to see the machine-code instructions that the compiler has generated from your code:
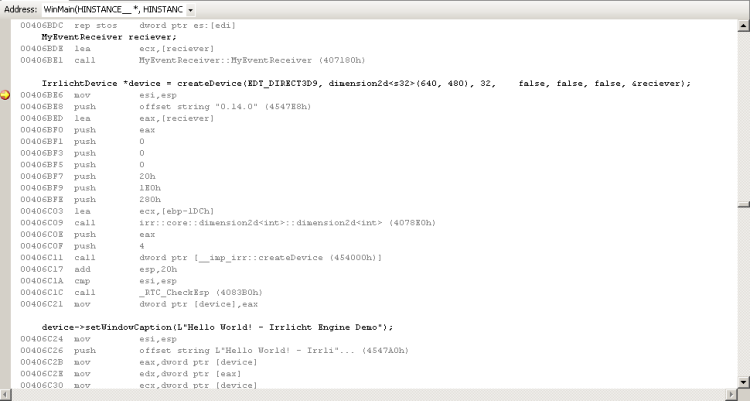
The disassembly view will do its best to match up the code you wrote (in black) to the machine-language section that your code corresponds to (underneath it, in grey).
However, if you've turned on optimizations - or any other option which would involve reprocessing or reordering the assembly - then what it ends up showing you may not make much sense. The code should still behave in the same way, and might still be packed inside the right function, but some lines of code may be accompanied by apparently unrelated assembly, while others may have no assembly listed for them at all. As such, if you need to use disassembly view for any extensive work, you probably want to turn off optimizations first (or switch to a build profile that doesn't have them turned on, like Debug). Be aware that if you do work in Debug mode, you may see some strange symbols appearing that seem to have nothing to do with your code - they tend to be runtime checks inserted by the compilers to verify that particular things have not entered invalid states (the sort of checks we talked about in the Issue Recognition overview). For example, in the image above you can see a call to _RTC_CheckEsp near the bottom - that's something the compiler has inserted to check that the createDevice function has returned correctly and not messed up the call stack.
Much like the regular source view, disassembly view also supports breakpoints - unlike source view, they can be set on individual instructions, instead of only on lines of code - and DataTips, if you mouse over registers or variables.
Visual Studio Debugging - Other Tools
There's two more parts of the Visual Studio debugger that should be mentioned, but they don't really fit into the program flow or state inspection categories. The first of these is the output window:
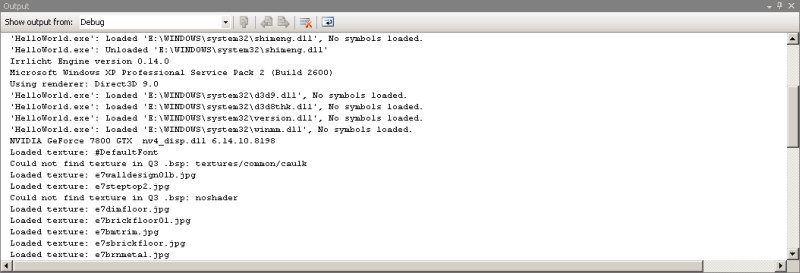
The output window is a general dumping-ground for messages generated by your program (and by things your program uses, like parts of Windows). These messages can be about anything; often errors will display a message giving you more information about the error than you might otherwise get from things like function error codes. DirectX does this on a particularly regular basis, if you turn on the debugging mode in the DirectX control panel. Messages generated by tracepoints also go here. You can have your own program write messages into this window, if you want; in unmanaged C/C++, the function is called OutputDebugString(), while in managed languages you want to use the System.Diagnostics.Debug and System.Diagnostics.Trace classes. It's actually the same window as is used for compiler/linker output - see the "Show output from:" dropdown at the top there?
The other window we want to look at is the immediate window:
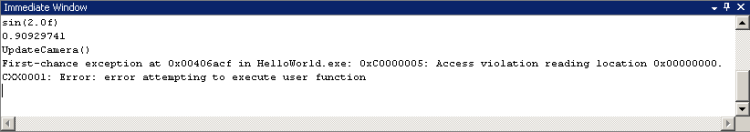
The immediate window is a bit of an oddity. It sort of feels like it's been inherited from older, command-line debuggers. Simply enough, you give it an expression (including assignments and function calls if you want), it evaluates it and displays the result. Sounds pretty similar to the watch window, no? The difference is that what you put in gets evaluated once and only once, instead of every time the context changes. As such it can be quite handy for doing things like calling complex setter functions. The window also supports a group of single-letter debugger commands, like X to search for a symbol and K to display the call stack. The full list is in MSDN.
Diagnosis and Prescription
We've covered the common tools used to collect information about the state and behaviour of our programs. How do we use that information to identify a bug, and then to work out a fix for it?
This is the point at which the computer can't generally help us. It can tell us that the program might have crashed from an access violation, and we can use the watch window to see that we're dereferencing a null pointer, but what's the bug there? Are we failing to check that the pointer is not null immediately before that line, or should it have been caught higher-up in code? What does a null pointer mean in this context? Identifying the bug itself requires that you translate the information you've gathered up to the "conceptual" level of your program, where you're dealing with objects and behaviours instead of source code; as such, it's the point at which you really need to have an understanding of that conceptual level, or you won't be able to address the root problem and may mistakenly address a symptom instead.
Here's an example. I've discovered that killing another player in a death-match game correctly produces a ragdoll (i.e. the player changes from a regular animated model to a limp, physics-controlled corpse) on my own machine, but on all other machines that player just disappears. That's incorrect behaviour; the ragdoll should be appearing in the same way on all machines. So, I set up a breakpoint on the "player death" code on my own machine, and watch to see exactly what happens. I observe that firstly, my machine calls SendNetworkMessage(MSG_PLAYERKILLED), which sends a "PlayerKilled" message to the other machines. Then, it calls RagdollSystem::Create() to create a ragdoll object, and gives it the same position/orientation as the player that was just killed, as well as setting up the initial forces (the force of the fatal shot). Huh, so what's telling the other machines to create ragdolls? Oops… as a matter of fact, nothing. Checking the message-receiving code for the PlayerKilled message reveals that there's no call to RagdollSystem::Create() there for setting up a ragdoll. So, my bug is that non-local machines aren't being instructed to create ragdolls at all. If I don't tell the program to do it, it isn't going to happen.
Now, working through that bug required a fair amount of knowledge of the system on my part. I needed an understanding of how the player-to-ragdoll swap-over process was supposed to work; I also needed an understanding of the network-messaging system between machines, to know what functions like SendNetworkMessage do. (This bug is a watered-down version of a bug I did meet in the wild; the real bug was sending a message and creating the ragdolls on the other machines, but it still wasn't working. I think it turned out that the ragdoll we were creating was associated with the player that we'd just killed, and as such it was also being marked as 'dead' and thus getting garbage collected along with it or something like that).
Diagnosis tends to be the stage at which any work you've invested in clarity of design and coding style will pay off in spades. What does it mean if "foo" is null? Probably not nearly as much as if "currentPlayerWeapon" is null. Using names and structures that match the conceptual model of your program will help you to translate information between the two.
Once you've identified your bug on a conceptual level, developing the fix is sort of working backwards: you work out the fix on a conceptual level, and then translate that down to code. There's often a number of different ways to fix a bug, and each one will have pros and cons, each one will have tradeoffs. Returning to my ragdoll example, I know that I need to instruct the other machines to create ragdolls. What's the best way of achieving that? I could add code to the "PlayerKilled" message handler to set up the ragdoll in there; seems like it should work, right? So I go ahead and implement that. Now, however, it means that killing a player will always generate a ragdoll… so I guess I'd better hope that the designers don't ask me to implement a disintegrator gun. A different fix might have been to split "killing the player" and "creating the ragdoll" into two separate network messages. The "create ragdoll" message could include all necessary information to create a ragdoll, including position, orientation, and initial forces; that way I'd actually make it a lot easier to support things like ragdolls as part of scripted sequences or in-game cut-scenes. What's the catch? Well, now I'm sending two network messages instead of just one. So here, my trade-off is between flexibility and network performance; I have to make the call based on how much I value one over the other. If I'm pretty sure that our designers are never going to ask for player deaths without ragdolls, and our network usage is already pretty high, then the first fix is probably better. If, on the other hand, we're fairly early on in the project and the designers could ask for anything, and the network usage is currently very low, then I'd probably opt for the second fix.
Response
Response is a stage often treated as part of Prescription, which is fairly natural; Prescription is figuring out what the fix is, and Response is actually implementing that. For most projects, response is a simple matter of changing the code and rebuilding the executable. However, it's not so simple if you need to apply the fix while the system is running. What if you're looking at fixing a server issue in a massively multiplayer game? Can you really afford to stop the server, kicking hundreds of players offline, while you rebuild, test the fix, and restart the server? Sometimes you'll have no other options, but issue response is definitely something you should bear in mind when designing software for which it may be a non-trivial problem. Perhaps you should split your code up into DLLs and support reloading DLLs at runtime, so that you can rebuild the DLL elsewhere and then ask the server to reload it without going offline. Or perhaps you should support the transfer of everything the program is currently handling to another program (perhaps another instance of the same program) while you take the first one offline to apply fixes. The most sensible approach will depend on your project.
Verification
This is the point at which the process comes full circle. You've applied the fix; now you need to check that it works and that the issue can be safely closed. It's sometimes one of the hardest things to accomplish, because you're trying to cause the program to do something that it has been explicitly told not to do. Usually, this step should be performed by the person who identified the issue in the first place, usually using the same tools and techniques that were used at the issue recognition stage; it's also another point at which work in the issue recognition stage will pay off, as you have a greater understanding of where the bug was and what sorts of things would cause it to manifest itself.
Dealing with a couple of common runtime bugs
Now that we've covered the full debugging process, let's look at how it's put into action on a couple of common types of bug. We'll only look at the first three stages of the process here.
Access Violation
Symptom: The program crashes. The error report gives an exception information code of 0xc0000005.
Intelligence-gathering:
- Run the program in the debugger and do what you did to make the program crash again. The debugger should catch it this time, telling you that it has halted the program because "an unhandled exception of type 0xc0000005 has occurred: Access Violation" and a memory address.
- Look at the memory address reported. If it's 0x00000000, or a very low value like 0x0000000B, then we're probably looking at a null pointer dereferencing. If it's a higher value like 0x00455CD2, then we're probably looking at a pointer corruption bug.
- There are a few other special codes to look out for as well - values close to 0xCDCDCDCD, 0xCCCCCCCC or 0xBAADF00D indicate an uninitialised variable, while values close to 0xDDDDDDDD and 0xFEEEFEEE indicate recently deleted variables. If you see these in a pointer, it doesn't mean that the pointer is pointing to uninitialised or deleted memory - it means that the pointer itself is uninitialised or has been deleted. The other one to watch out for is 0xFDFDFDFD - it can indicate that you're reading past the beginning or end of a buffer.
- Dismiss the exception report message, and the debugger will show you the point in your program at which the exception occurred.
- Mouse-over (or add to the watch window) the variables in the line of code in question. Do they all appear to have reasonable values? If the error is due to dereferencing a null pointer then you will probably find at least one variable with value 0x00000000; if it's not a null pointer, then look for values that are close to the one reported in the error (usually on the side of being slightly smaller). Also, check array indices - accessing a normal array using a way-out-of-bounds array index can sometimes result in an access violation, too.
- Use the watch window, if necessary, to evaluate larger parts of the expression. For example, your code might contain "arrayvar[index]->member," where both arrayvar and index are valid but arrayvar[index] is actually null.
- Once you've found the suspect data, consider what that means in the context of your program. What does it mean to say that the current player object is null? Is that something that makes sense to have? Is it something you should allow?
- It's possible that the data in question shouldn't happen - you shouldn't be able to call "Player::SetCurrentWeapon" if the player object is null. Use the Call Stack window to see how your program reached this point; if the data is a parameter then you might be able to see it being passed up the stack. Trace it back, checking that things are behaving correctly as they go along, to find the point where your program first started going off the rails.
- If the pointer in question is becoming corrupted after working fine for a while, and you can't figure out where it's being changed, try setting up a data breakpoint on it. Unless the pointer is global, its address can change with each run of the program and so you may need to run through program initialisation before you can set up the breakpoint. Using an unconditional breakpoint at the end of your initialisation code is the simplest way to achieve that.
Diagnosis: It depends on the code in question, but the common diagnoses for access violations are the following:
- Failure to check for null before dereferencing a pointer, i.e. you just do ptr->something without first doing if(ptr)
- Failure to check for invalid function parameters, i.e. there is no if(!isValid(argument)) return; at the beginning of a function
- Failure to reset a pointer to null after deleting the memory it points to
- Pointer overwritten due to a bug elsewhere, e.g. a buffer overrun
Logic Bug
Symptom: The program runs without crashing, but behaves incorrectly, e.g. allowing you to select weapons you do not currently have, or declaring the game won/lost at the wrong time.
Intelligence-gathering:
- First, decide whether the program is doing something it should not be doing, or whether it is not doing something it should be doing.
- If it's doing something it should not be doing, stick a breakpoint on it and then push the context up the call stack to see how it got there.
- If it's not doing something that it should be doing, find the function that you expect to be calling it and stick a breakpoint on that function. If that breakpoint never gets hit, stick a breakpoint on a function that calls that function, etc. Eventually you should end up in some code that is actually being run, so the breakpoint will get hit. As a sanity check, it may first be worth sticking a breakpoint on the code itself to be sure that it's not being called - sometimes it can seem like the code isn't being called, when actually, it's being called just fine, it's just not doing anything.
- When you find the code that is erroneously calling the function (or not calling it), put a breakpoint at the beginning of it and step through it to see how it behaves in the run-up to the call. Put key variables in the watch window to monitor them; you can put more complex expressions, such as parts of the conditions used for if statements, there as well if necessary.
Diagnosis: Usually, logic bugs come from incorrect 'if' or 'while' statements - either using conditions that are incorrect (commonly, using 'and' instead of 'or', or 'greater than' instead of 'less than'), or conditions that are incomplete (i.e. there's an extra thing you need to be checking for). Less commonly, they can come from syntax errors - an accidental semicolon after an if statement, for example.
Miscellany
Prevention, not prescription
Debugging, while something you should definitely be able to do if necessary, is however something you should always avoid having to do - you should always be trying to write code in ways that make it harder for bugs to creep in. While the thing that will best help you write solid code is a solid understanding of your program, your computer, your tools and how they are all supposed to work together, there are also some common practices that I want to mention.
Firstly, there's an attitude amongst some beginners that ignoring compiler warnings is OK. That's very much not the case! The fact that your code compiles with warnings but no errors guarantees that it's written well enough to run - it does not guarantee that it is written well enough to run correctly. The compiler isn't generating those warnings for its own amusement; it's trying to draw your attention to the location of potential bugs. Check each one out, and decide whether the warning is warranted; you can usually make it go away by making your code more explicit.
Of course, whenever you change the code, think about the change that you're making. Does it make sense? Is it the right thing to do? Don't just do it for the sake of silencing the warning; do it for the sake of improving the code quality. Compilers include an option for treating warnings as errors, preventing compilation from succeeding if there are any warnings generated; turning this on is not a bad idea. It's perfectly possible to keep a few million lines of code free from warnings. You can also increase the strictness of the compiler by increasing the warning level - this will cause it to report things that it would normally just let slide. In the event that you're faced with a warning that you really can't do anything about, or really don't need to do anything about (such as the use of a compiler-specific extension when you have no intentions of ever using other compilers), then it may be possible to disable the warning - under Microsoft's compilers, this is done using the #pragma directive. This is not something to be done lightly, but sometimes it is necessary as a flood of unwanted warnings can make it harder to spot the ones you need to be paying attention to. Aim to disable warnings only temporarily, and for as short a block of code as possible - Visual Studio supports both explicit enabling of warnings, and saving/restoring the warning state, so it's not hard to minimize the affected area.
Use safe containers. Many people - particularly beginners - fall foul of buffer overruns and general pointer mismanagement issues because they use straight arrays when the container classes in the STL would be more suitable. While it's important to know about arrays, using the STL containers like vector and string will help you avoid mistakes like using an array index that is out of bounds or forgetting to reserve space for the null terminator on your string. Similar containers exist in other technologies - ArrayList under .NET, for example. Also, don't forget that std::string is a container type, and does support iterators, just like list or vector - this means you can use functions from <algorithm> like for_each(), which let you achieve pretty much anything the C string functions can do but in a safer manner.
In a similar vein, for C++ coders, use C++-style IO - the iostream library. The C-style functions like printf and scanf rely on you to ensure that the format string matches the other arguments correctly; because there's no guarantees made about types it becomes very simple to accidentally specify a pointer to a variable when you meant the variable itself, or something similar. The C++ iostream library is typesafe, allowing the compiler to do a better job of checking your code for you, and does not require that you keep values in sync with some format string. Also, don't forget that iostream goes beyond input and output. In-memory string formatting a la sprintf can be done by the stringstream class.
The last thing that should be mentioned is assertions. Assertions are "things that are supposed to be true" - for example, you might assert that a particular pointer should never be null, or that the number of items in a list at the end of your function is the same as the number of items in the list at the beginning. If the assertion is tested and found to be false, then the program can immediately halt itself to be checked out in the debugger, instead of waiting for the point at which the situation leads to a crash or something like it. Assertions can save you a lot of time because they catch bugs earlier, and they reinforce ideas about the way your code is supposed to work. One particularly common place for assertions is at the beginning of a function, checking that the parameters that have been passed to the function are all valid.
However, assertions are not designed to replace error checks. In a release build, you're often no longer interested in why something went wrong, because the build has been released and you're not a position to fix the problem - you just want to know that it did go wrong, so that your other code can account for that. Consider also the fact that testing an assertion does take a small amount of time, so having lots of them around can reduce performance.
For these reasons, release builds will still contain the broader, coarser error checks designed to stop the program from crashing, but will often be configured to ignore assertions, leaving them out of the compiled executable. For this reason, you should never assert expressions that have side-effects - you shouldn't assert 'i++,' for example, as it will not happen in a release build, thus causing behaviour to differ. Assertion expressions should treat everything as read-only.
How do you put assertions into your code, and have them tested? The fastest approach is to use the assert() function in the C Runtime Library, which will give you a generic error dialogue reporting the thing you were asserting. However, you can often get a lot more information by writing your own assertion macro and handler; you can include state about your game, you can have the handler write a log message instead of throwing up a dialogue, you can provide the option to ignore the assertion and continue on anyway, etc.
Post-mortem Debugging
One of the features Visual Studio provides that people tend to forget about is the fact that it supports post-mortem debugging - that is, debugging your program after it has crashed. If you had the debugger attached to your program when it crashed then you'd see it catch the crash and pause the program for you, but if you didn't have it attached then it may seem like any information is lost. Not so!
Windows contains a component that allows the creation of dump files. A dump is a simple copy of some part of your program's current state, ranging from the contents of memory that it's using, to the contents of the processor registers and the call stack, to lists of Windows resources that it owns. They can get quite large - in some cases, can contain a copy of everything that was in memory on your machine at the time of the crash - but can also be quite small, no more than 64K, depending on what you include. The tool usually used to create these dump files is called 'Dr. Watson;' it launches automatically upon a crash, and can also be launched manually if a program has hung (but not crashed). You can also initiate a dump from code using the DbgHelp API, and the MiniDumpWriteDump() function. Here's an article from CodeProject, if you're feeling particularly adventurous.
Bright sparks amongst you may have already spotted that if you want to write a dump after a crash, you'll be in no position to call functions like MiniDumpWriteDump() - in fact you'll be in no position to call functions at all, because control has passed to the code that produces the crash dialogue. In truth, Windows allows you to install your own code that gets run when the program crashes, via SetUnhandledExceptionFilter(). You can write a function that calls MiniDumpWriteDump() to make the dump just the way you want it, and then install that function using SetUnhandledExceptionFilter(). There may be other useful tricks you can do, such as automatically submitting the dump to an internal bug tracking system; you need to be careful, however, that whatever code you write in the function cannot throw any unhandled exceptions itself. A try/except block may help you here.
If you obtain a dump file from a crash, you can load it up into Visual Studio (though "Open Project/Solution"), and you will be able to inspect the state of the application at the moment of the crash as if you had the debugger attached. You can't try to continue running the program, but the information provided is often invaluable.
Bear in mind that for the debugger to make sense of the dump file, it needs to have both the executable/DLLs and the symbol files for the program present, and they need to be the exact same version as was in use on the crashing machine. As such, if you intend to collect and analyse dump files from users, it is very important that you clearly track version numbers on builds that you release to them, and that you keep the symbol files from that build somewhere safe. Without them, you're wasting your time.
Rolling your own debugging facilities
While we've looked at a fair number of reasonably powerful tools in this article, they're general-purpose beasts, and it's usually going to be true that they do not report information in a format that is really optimal for your situation. They're good at presenting a text-based view of a static shot of your program, but frequently one needs more than that. What if you want to view how a value is changing over time? What if you want to display information graphically? For whatever reason, whether the usual tools are unsuitable or unavailable, it is sometimes necessary to "throw good code after bad." And you may even wish to do so pre-emptively - debug code can be used to check that things are working correctly just as easily as it can be used to investigate when they break.
The oldest instances of this are things like traces. If you're working in a situation where you can't break/step program flow but you want to see how things are executing, it's fairly common to insert some (temporary) code that something highly visible to happen - a message to be displayed, the screen to change colour, etc.
Moving into a more game-specific context, something that people often overlook is developer cheats. The ability to have infinite lives or infinite ammo may seem very handy to players, but it's likely even more handy to developers who wish to test out the second part of a level without having to worry about getting killed working their way through the first part. Things like the ability to move the camera completely freely ("flymode") can be very handy for inspecting graphics issues.
An entire subcategory of developer cheats is data visualisation. This means putting data about the internal state of your game into the screen somehow. The most common instance of this is an on-screen framerate counter; you might also see memory allocation counts or network activity graphs. The information presented is often related directly to what is visible in the regular game view; the current AI state of an NPC might be drawn over that character's head, for instance.
Another component, useful for diagnosing problems in release builds if crash dumps are not available, is log files. A log file is just a file to which the game writes messages about operation - information about the game startup process, information about the shutdown process, information about when it loads a new level or fails to find a particular sound. Log files are often used in very similar ways to the debugger's output window, but have the advantage of persisting on disk after the debugger is closed, and of not requiring that a debugger be installed (allowing them to be used for error reporting on end-user machines).
Lastly, some projects have included a facility for remote debugging, which is debugging the program from another machine via a network. It's worth noting that Visual Studio itself supports this via the 'Attach to Process' command, though as has been said, more specialised tools can be useful to have. It's perfectly possible to write a small information server into your game that you can communicate with via a customised client program over whatever network technology you like, perhaps displaying your scene graph or your entity list in an easily consumable format. Shea Street wrote recently that he has embedded a tiny HTTP server in his project, allowing him to inspect and interact with the game on a developer level using a simple web browser.
The Probe Effect
Unfortunately, some bugs - particularly timing-related ones - tend to be affected by the mere presence of the debugger; the added slowdown just happens to be enough to stop the bug from happening, to cause threads to switch execution order and so on. This is known as the "probe" effect, in that "probing" the bug with the debugger causes it to disappear (making the bug in question a "heisenbug").
How does one combat the probe effect? You can't attach a debugger because that'll cause the bug to disappear. You can try and change the nature of the bug to stop it from being affected - this can sometimes be achieved by trying to make the bug more pronounced and then attaching a debugger in the hope that it will no longer be enough to knock the bug undercover.
Most often, the probe effect is seen when handling bugs related to multiple threads or multiple processes and shared memory. If one thread is consistently performing an action before another thread that is leading to the bug, then attaching the debugger could affect the timing of the threads to the extent that the order switches around. If you suspect that this is the case, then you can try forcibly desynchronising the threads to exaggerate the condition (using a mutex that forces one thread to wait for the other, for example), allowing you to attach the debugger without causing the bug to disappear. (Desynchronising the threads in the other direction is not usually a suitable fix). It's important to collect whatever information you can to try and understand what is going on at the moment the bug occurs; this may mean resorting to a straight-out code inspection to see where threads interact with shared data and resources. (Bear in mind that the threads in contention may not necessarily be ones that you yourself created, or even ones that show up in your process space).
At the last resort, however, the only option is exploratory surgery - guessing at where the bug lies, creating and applying a fix, then testing to see if it worked. While a fix may not work, it will usually provide you with more information to improve your second guess, and can sometimes stop the probe effect from happening (allowing you to gather information through more orthodox channels). If this route appears to be necessary, it's important to ensure that a backup of your code exists before you start, and that the bug is very clearly defined - a bug that nobody can really consistently reproduce and that doesn't show up under the debugger is practically a ghost and will be impossible to track down.
Conclusion
I hope that this article has given you some useful insights into the debugging process, into how it works and how you can use it. The field of "programs to fix programs" is not a small one, and new products and new research is permanently under development. Always keep an eye out for tools that can help you, and always keep in mind the "debuggability" of a technology if you're evaluating it for a project. It might be the easiest thing in the world to use, but if it's a complete black box, then you'll find yourself regretting it when it inevitably breaks.
However, all the data-gathering tools in the world won't help you if you don't know how your code works - you won't know what the data you're looking at means. Debugging is always, always, always going to be strengthened and improved by a solid understanding of what is going on within your program, both within the code that you yourself have written, and within the libraries, technologies, and tools that you use. (This, incidentally, is why copy-pasting code is in general a bad practice; it is a very quick way to introduce code that you don't completely understand into your project). The broader and deeper this understanding, the better you will find yourself able to deal with problems through reasoning about your program's behaviour.
If you find yourself resorting to "voodoo" methods to try and fix bugs, thrashing around randomly doing things like swapping class declarations and renaming functions and variables, then you need to stop and take some more time to understand your program (or more frequently, your compiler and computer). That said, if a particularly weird bug isn't going away, it's sometimes worth doing a 'Rebuild All' - just in case.
And finally, if the bug's really eluding you, and the deadline's closing in, and you've not slept for a week, and you've run out of coffee… don't panic. In such situations, it may be necessary to recall the wise words of my friend Kyle Kaitan:
If deep in nested code you find
a bug that brings you to a halt,
continue on and pay no mind;
it's probably the artist's fault.
Further Reading
- Debugging in Visual Studio, MSDN2
- GNU DeBugger (GDB) Home Page
- A Word for WinDbg, Mike Taulty
- Robbins, Debugging .NET and Windows Applications, MS Press, ISBN 0735615365
- Oualine, How Not to Program in C++: 111 Broken Programs and 3 Working Ones, or Why Does 2+2=5986, No Starch Press, ISBN 1886411956
- Stallman et al, Debugging With GDB: The Gnu Source-Level Debugger, Free Software Foundation, ISBN 1882114884
- McShaffrey, Game Coding: Complete, Second Edition, Paraglyph Press, ISBN 1932111913
- McConnell, Code Complete: A Practical Handbook of Software Construction, MS Press, ISBN 0735619670
- Beck, Test Driven Development, Addison Wesley, ISBN 0321146530
- Metzger, Debugging by Thinking: A Multidisciplinary Approach, Digital Press, ISBN 1555583075
- Ford, Teorey, Practical Debugging in C++, Prentice Hall, ISBN 0130653942
Acknowledgements
My thanks to the many people who assisted in providing feedback throughout the construction, verification, and proofreading of this article. Particular thanks go to Kyle Kaitan, Sean Kent, Henrik Stuart, Yannick Loitiere, Anthony Whitaker, Oluseyi Sonaiya, and all the other folk on IRC; Jack Hoxley, David Eccleston, and David Lowndes from the MVP newsgroups; David Weller, Eric Sassaman, Marian Luparu, Sergey Grankin, and Boris Jabes at Microsoft; Rachel Sterling for keeping me motivated; and Tom Rackham and "Hassans Kebabs" for catering services.
And a very special thanks to Barry T. Smith for the use of his Angst Technology cartoon. Dante is the man.