
使用 Printf via SWO/SWV 输出调试信息
Stdout and stderr of the application can be redirected to ITM stimulus port #0.
It means that stdout/stderr messages (e.g. strings sent by printf) can be transferred
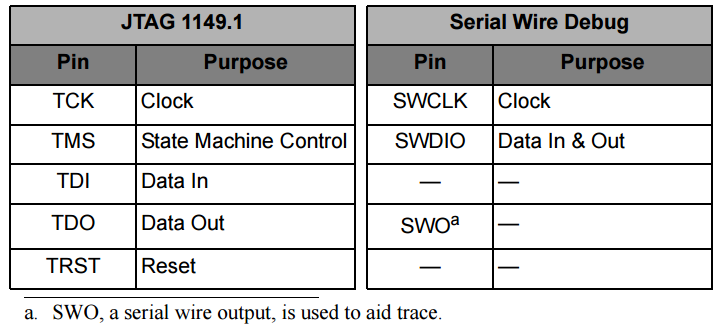
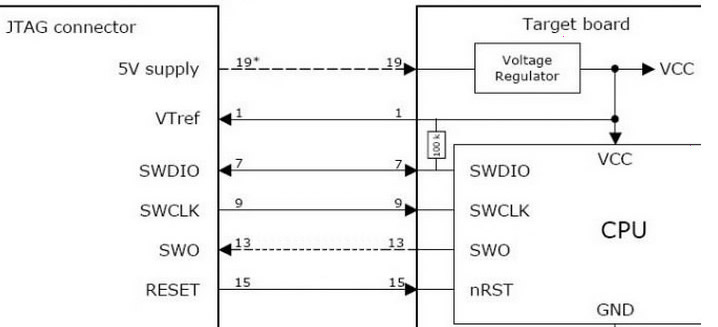
from the target application to the C-SPY Terminal I/O window via SWD.SWO pin <JTAG.TDO pin>.
Requirements:
Cortex-M3/M4 board; J-Link/J-Trace;
IAR Embedded Workbench for ARM, V5.50.5 or later.
1. plus rerouting stdout/stderr messages via SWO (library low-level interface implementation, see the figure below).

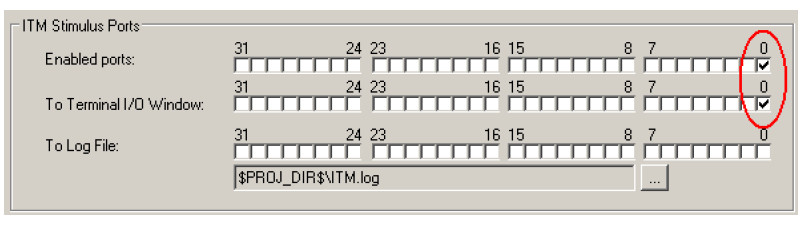
2. except for enabling ITM stimulus port #0 and using it for routing data to the C-SPY Terminal I/O window.
3. Open the Terminal I/O window from the View menu.
Start executing the application to collect Software Trace information.
Stdout messages sent by printf( ) in the application will be displayed here via SWO Trace.
Semihosting技术
将应用程序中的IO请求通过一定的通道传送到主机(host),由主机上的资源响应应用程序的IO请求,而不是像在主机上执行本地应用程序一样,由应用程序所在的计算机响应应用程序IO请求,也就是将目标板的输入/输出请求从应用程序代码传递到远程运行调试器的主机的一种机制。
简单来说,目标开发板上通常不会有输入/输出这些外设,开发板运行的代码想要将结果打印出来,或者获得用户的输入,可以通过请求远程主机IO设备来实现,如:显示器,键盘等。
目标开发板执行代码中加入对输入/输出设备进行访问函数,如:printf,scanf等,这些函数并不是目标开发板的库函数,而是远程主机交叉编译器中带有的库函数,这些库函数被编译时,编译成一条软件中断指令。
当目标开发板上电运行之后,执行到请求访问输入/输出设备指令时,产生特定中断号的软件中断SWI,与开发板相连的调试器会先截获目标板SWI请求,由于开发板程序中也可能存在用户自定义软件中断,为了区分二者,调试器会根据SWI的软中断号来判断是不是semihosting模式IO请求,如果是,则取出R0寄存器里代表的具体请求号,然后使用远程主机来响应目标板具体IO请求,而不是开发板本身去处理setmihosting请求。
semihosting仅仅是一种调试手段,它的工作原理就是利用调试器捕捉目标环境运行过程中产生SWI中断,然后向远程主机调试环境发送对应的调试信息。
也就是说目标开发板通过特定的软件中断指令,借用了远程主机的输入输出设备实现IO请求的访问。
Semihosting半主机调试模式,只能使用在开发板和调试主机通过仿真器连接的情况下,也就是说脱离了主机调试环境上述代码不能正常运行。
目标开发板上执行的IO实际上是交给了远程主机来处理实现,正是因为如此,这种方式只适合在调试模式下,真正的嵌入式系统不可能依赖于主机实现IO处理的,嵌入式系统要想独立出来实现IO请求的处理,这就需要将输入输出库函数的底层相关硬件实现重定向。
新一代调试机制
使用ITM机制实现调试,实现printf与scanf, ITM是ARM在推出semihosting之后推出的新一代调试机制。ITM机制要求使用SWD方式接口,并需要连接SWO线。
It is only TX and not RX but most people just use printf for tracing anyways.
If you have a USB serial adapter, you can also use it as a SWO viewer, SWO is actually very similar to UART except using a much faster speed,
for example, with JLink, I can push it to 6MHz, which most USB serial adapters do not support.
The speed is incredibly important in timing critical debugging.
Remember, SWO is not just an application software printf style debugging, it is tied to ITM (instrumentation trace macrocell)
which enables software & hardware trace with timestamp. i.e it allows you to debug OS and application events.
It's not a problem to use SWO out in production code.
The SWO is separate from the debugger.
You can even run the SWO console w/o the debugger connected.
Target 使用 SWO 的条件
- 硬件条件:你得把芯片的SWO脚接到调试口上,按JTAG接线的话,这个默认已经接上了.
- 代码条件:你得把Printf的输出函数,替换成SWO输出函数,其实这个函数在CMSIS库里已经提供了,就在core_cm4.h里面,如下:
/** \brief  ITM Send Character

    This function transmits a character via the ITM channel 0.
    It just returns when no debugger is connected that has booked the output.
    It is blocking when a debugger is connected, but the previous character send is not transmitted.

    \param [in]     ch  Character to transmit
    \return             Character to transmit
 */
static __INLINE uint32_t ITM_SendChar (uint32_t ch)
{
  if ((CoreDebug->DEMCR & CoreDebug_DEMCR_TRCENA_Msk)  &&      /* Trace enabled */
      (ITM->TCR & ITM_TCR_ITMENA_Msk)                  &&      /* ITM enabled */
      (ITM->TER & (1UL << 0)        )                    )     /* ITM Port #0 enabled */
  {
    while (ITM->PORT[0].u32 == 0);
    ITM->PORT[0].u8 = (uint8_t) ch;
  }
  return (ch);
}
Redirecting/retargeting printf()
#include <stdio.h>
#include <stm32f4xx.h>

int fputc(int c, FILE *stream)
{
   return(ITM_SendChar(c);
}
SWO printf in IAR
The following steps demonstrate how to configure the SWO pin to output printf() statements in IAR.
1) Add #include to the beginning of the file where you want to write your printf statement.
2) Enable SWO Output.
The simplest way of enabling the SWO line in the EFM32 is by using the setupSWO function.
You can find this function in the energyAware Profiler, in the left pane, when you open up the program.
Once this is run, the SWO output will be enabled to the correct pin on the Development Kit or the Starter Kit.
3) Configure the project in IAR to send printf statements through SWO:
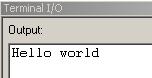
4) Write printf('Hello world'); in your code after you have enabled the SWO output.
5) Compile the code and download it to the Starter Kit/Development Kit. Enter a debug session.
6) Once you are in debug mode, you should set the correct SWO clock speed (14 MHz) in J-link->SWO Configuration...:
(The SWO output is clocked by the auxiliary HFRCO oscillator which is running at 14MHz regardless of the chosen system clock frequency.)
7) Open up View->Terminal I/O.
8) When you hit Go you should see the printf statement show up as below:
#ifndef LOG_LEVEL_LOWEST
#define LOG_LEVEL_LOWEST    _LOG_LEVEL_DEBUG
#endif

/**
 * Defines the default log level.
 */
#ifndef LOG_LEVEL_DEFAULT
#define LOG_LEVEL_DEFAULT   _LOG_LEVEL_INFO
#endif

#if LOG_LEVEL_LOWEST <= _LOG_LEVEL_TRACE
#define logTrace(MSG, ...)       __logLine(&_log, LOG_LEVEL_TRACE, MSG, ##__VA_ARGS__)
#else
#define logTrace(MSG, ...)
#endif

#if LOG_LEVEL_LOWEST <= _LOG_LEVEL_DEBUG
#define logDebug(MSG, ...)      __logLine(&_log, LOG_LEVEL_DEBUG, MSG, ##__VA_ARGS__)
#else
#define logDebug(MSG, ...)
#endif

#if LOG_LEVEL_LOWEST <= _LOG_LEVEL_INFO
#define logInfo(MSG, ...)       __logLine(&_log, LOG_LEVEL_INFO, MSG, ##__VA_ARGS__)
#else
#define logInfo(MSG, ...)
#endif

#if LOG_LEVEL_LOWEST <= _LOG_LEVEL_WARN
#define logWarn(MSG, ...)       __logLine(&_log, LOG_LEVEL_WARN, MSG, ##__VA_ARGS__)
#else
#define logWarn(MSG, ...)
#endif

#if LOG_LEVEL_LOWEST <= _LOG_LEVEL_ERROR
#define logError(MSG, ...)       __logLine(&_log, LOG_LEVEL_ERROR, MSG, ##__VA_ARGS__)
#else
#define logError(MSG, ...)
#endif
#ifdef DEBUG
   dbgPrintf(MSG, ...)     printf(MSG, ##__VA_ARGS__)
#else
   dbgPrintf(MSG, ...)
#endif

